
Brute force approach to pattern search (Part III): New horizons
Table of Contents
- Introduction
- New ideas
- Sample segmentation and predictability of samples
- Final modifications of the search algorithm
- Optimization of templates and auxiliary Expert Advisor
- Analyzing Global patterns
- Drawing conclusions
- Conclusion
- References
Introduction
In the previous article, I have shown that it is possible to create profitable Expert Advisors using the simple brute force mechanism, because this approach is no worse than others. This topic is actually very close to my article entitled "Optimal approach to the development and analysis of trading systems", and especially to its "Math behind the optimal search" section. When creating this software, I mainly used the ideas that were formulated in this article. In general, the article aims at providing further modernization of my program algorithms with the purpose of improving the quality of the found options, as well as for a more detailed market research on different days of the week and in different time corridors.
A few of my Expert Advisors prove the viability of this approach. Different patterns exist on different currency pairs. Also, there are narrow time corridors which work on all pairs. What we need to do is to conduct an in-depth analysis. This is what we are going to do in this article. Such a comprehensive analysis cannot be performed without additional software. Please note that I do not consider my software to be the best solution.
The program emerged as a research software and served as an auxiliary toolkit for analyzing various assets. However, its capabilities have become much wider. So, we can try to get the most out of this approach. Let us try to do so. To be honest, I consider approaches like neural networks, artificial intelligence, and gradient boosting, to be much more progressive. Nevertheless, it turned out that the brute force approach can compete with these methods of analysis. Do not forget that as for now the approach is based on very simple math. I think that the algorithm can perform better.
New ideas
The program was at the prototype stage and I wanted to squeeze the maximum out of it to see what such a simple brute force method is capable of. The main problem was that a reliable global pattern search required analysis of large quote intervals, while the capacity of one pass was very small. For example, when analyzing M5 quotes for any currency pair for a period of 10 years, the program produced about 700-2000 variants per hour on one good core (even with mild settings).
Even if you take, let's say, a 30-core server, you will have to wait for days. The only solution is to reduce the amount of data for analysis. This can be done by splitting the entire period into equal intervals and skip some of them uncalculated. Such intervals are minutes, hours, days, months and years. In addition, these conditional areas characterize certain trading parameters. In other words, in addition to acceleration, we can study in detail every day of the week, hour and minute in terms of patterns. We will not have to worry about what this pattern is connected with.
Generally, it is impossible to classify all patterns, as their number is infinite, while the human brain is not able to understand and describe all of them (which is not really necessary, if you have a working formula). This is mathematics. It is possible to explore a fixed period of time and fixed days, or explore all data once. This can be compared to the following case: we have a function of one variable, and then it turns out that this is just a special case of a function of multiple variables, we just didn't know about it.
Sample segmentation and predictability of samples
I think that it will be interesting to analyze this option, as pattern search modes differ much in their upper capabilities, because samples of different length are analyzed. In addition to significant acceleration of calculations, a more useful (smaller) sample can be obtained based on the initial sample. This obtained function can further be analyzed using simple formulas or polynomials. This is because the market is strictly linked to world time.
Trading activity is formed largely based on the daily activity of traders. Here we can also refer Expert Advisors. Many Expert Advisors can be considered predictable players, but not all. For example, many developers create time-based night scalpers. It turns out that the nature of the price movement is determined not only by past prices, but also by certain days, weeks, months, possibly even years. Each of these values is quantized, that is, it has certain fixed values.
Of course, the values can be split. For example, the time window can be measured not in hours and minutes, but in seconds elapsed since the beginning of a new day. It all depends on which quantities are easier to measure. These quantized quantities can be further split up to infinity. In my program, segmentation occurs only within days and within weeks. I think segmentation by years is not so efficient. As for months, maybe I will add the relevant functionality later. The following diagram demonstrates the above ideas:
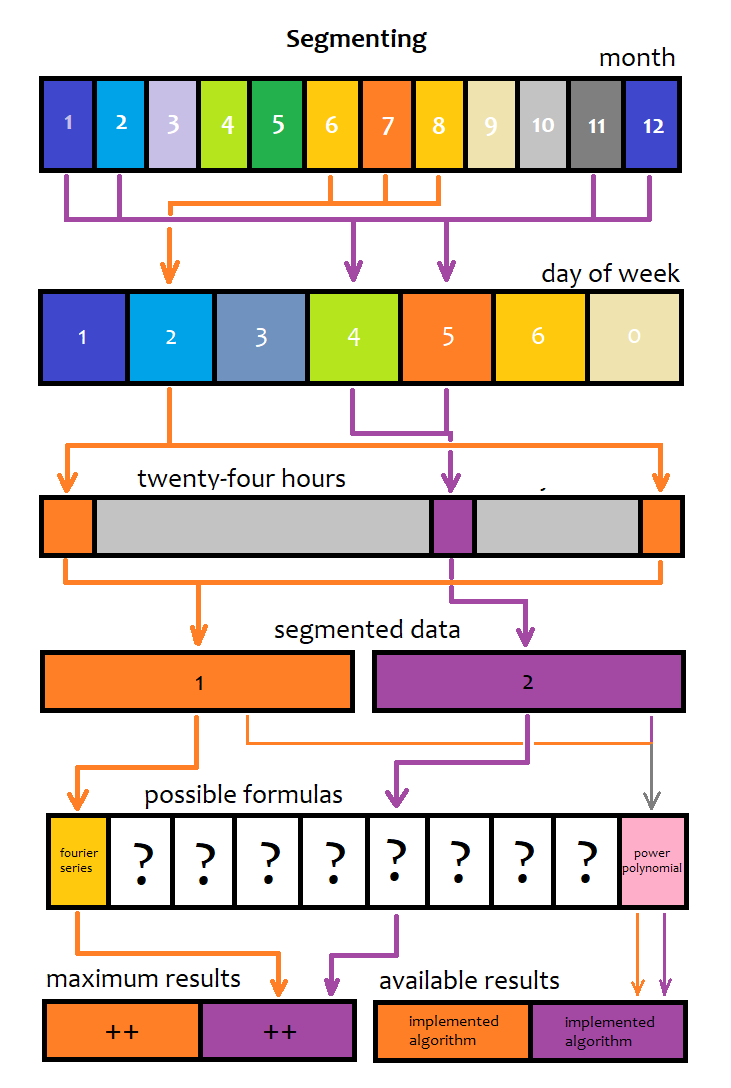
I have displayed two arbitrary options for original sample segmentation. Below is what would happen if the brute-force lasts indefinitely long. The first case is when we implement all possible mathematical patterns for description, and the second case shows what we get from the only implemented brute force method (multidimensional Taylor polynomial). There will always be the most predictable sample and the most unpredictable one. Also, an optimal segmented section exists for each polynomial type. Such segments can be countless, but we can detect them with a minute precision. I do not consider seconds, as we analyze bars.
So, for each combination of segmentation parameters we can create a function for each trading parameter which we can obtain at the output of the full development cycle. For example, the expected payoff and profit factor:
- Ma=Ma(M,D,Ts,Te)
- PrF=PrF(M,D,Ts,Te)
- M - month of the year
- D - day of the week
- Ts - corridor start time
- Te - corridor end time (can be a transition through 0:00, i.e. next day)
The functions are discrete. So, arguments can take strictly fixed values. By fixing the variables associated with months and days of the week, we can roughly imagine how these two functions will look like. The maximum number of changes is three, that is why an informative graph can be created with only two free variables. I use "Ts" and "Te":
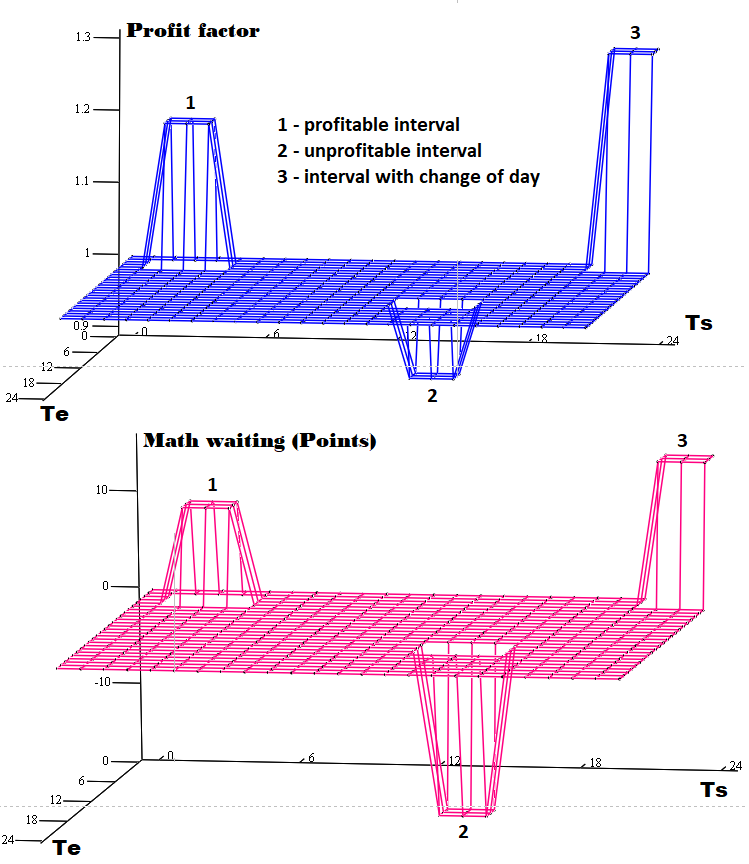
Each formula or algorithm with which we will try to predict the future will have such unique graphs for all the quantitative characteristics of the future trading system. I have shown only two of them to demonstrate that where there is a maximum profit factor, there will not necessarily be a maximum expected payoff. In most cases, you will have to balance between expected payoff and profit factor, because there are spreads, commissions and swaps. The number of these extrema and their values are different for each formula. We cannot perform a multi-dimensional extremum search manually, but it can be done by using our program.
I would like to mention one thing. While researching the market using my software, I noticed an interesting section, in which many currency pairs have overestimated predictability values. It is an interval approximately between 23:30 and 0:30. This is definitely related to the change of date point. However, the profitability of the strategies, which showed excellent profit factors in MetaTrader 4, was not confirmed when tested in MetaTrader 5. The reason is in spread. Always check twice the patterns that fall inside the spread. Most of the patterns found will be inside the spread.
Final modifications of the search algorithm
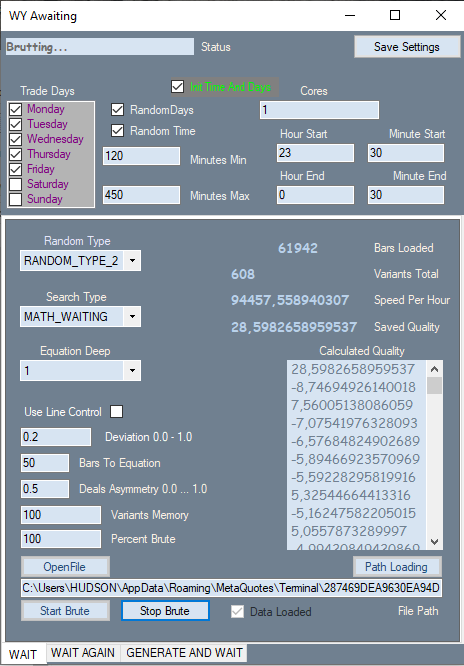
The purpose of the final modifications was to speed up the program operation, as well as to maximize search variability and efficiency. List of changes:
- Added ability to search for patterns in a fixed time interval
- Added ability to trade on selected days only
- Added ability to generate random sets of days for each new variant, based on the selected days
- Added ability to generate random server time windows by specifying possible minimal and maximal window duration in minutes
- Ability to combine any of these settings
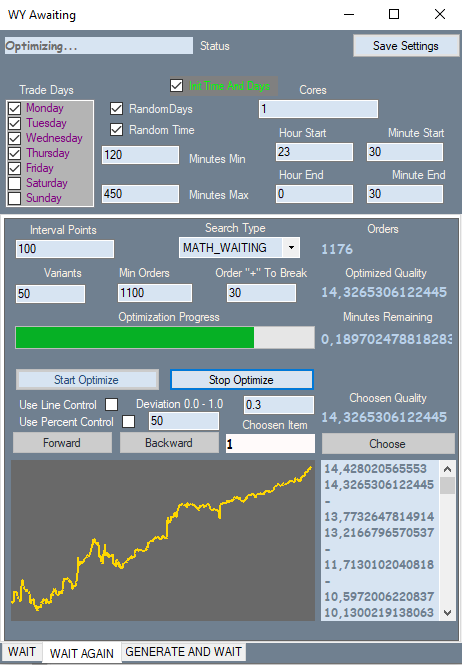
- The second optimization tab can now work in multi-threaded mode
- The optimization mode has been optimized
The updated window looks as follows:
The second tab has not changed:
Below is the third tab:
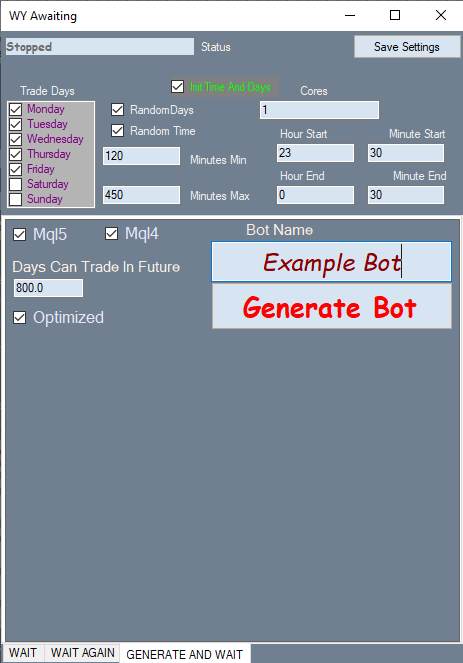
The interface is still very raw, so that settings hardly fit into the form. I will completely revise the interface in the next program version, which will be presented in the next article. I will also record a video with the entire process of creating an Expert Advisor using my program. You will see how easy and fast it is. You will only need to understand the interface settings and to have a little practice.
Optimization of templates and auxiliary Expert Advisor
To implement the new task, I also had to modify Expert Advisor templates. The robots generate a quote in the desired format which can be conveniently read by the program. The code of the EA generating a quote for MetaTrader 5 is now the following:
string FileNameString;
uint Handle0x;
datetime Time0=0;

double Open[];
double Close[];
double High[];
double Low[];
datetime Time[];


void WriteEnd()
   {
   FileWriteString(Handle0x,"EndBars"+"\r\n");
   MqlDateTime T;
   TimeToStruct(Time[1],T);
   FileWriteString(Handle0x,IntegerToString(int(T.year))+"\r\n");
   FileWriteString(Handle0x,IntegerToString(int(T.mon))+"\r\n");
   FileWriteString(Handle0x,IntegerToString(int(T.day)));
   }

void OpenAndWriteStart()
   {
   FileDelete(FileNameString);
   Handle0x=FileOpen(FileNameString,FILE_WRITE|FILE_TXT|FILE_COMMON|FILE_ANSI,'\t',CP_UTF8);
   FileSeek(Handle0x,0,SEEK_SET);
   FileWriteString(Handle0x,"DataXXX"+" "+Symbol()+" "+IntegerToString(Period())+"\r\n");
   FileWriteString(Handle0x,DoubleToString(_Point,8)+"\r\n");
   MqlDateTime T;
   TimeToStruct(Time[1],T);
   FileWriteString(Handle0x,IntegerToString(int(T.year))+"\r\n");
   FileWriteString(Handle0x,IntegerToString(int(T.mon))+"\r\n");
   FileWriteString(Handle0x,IntegerToString(int(T.day))+"\r\n");
   }

void WriteBar()
   {
   FileWriteString(Handle0x,"\r\n");
   FileWriteString(Handle0x,DoubleToString(Close[1],8)+"\r\n");
   FileWriteString(Handle0x,DoubleToString(Open[1],8)+"\r\n");
   FileWriteString(Handle0x,DoubleToString(High[1],8)+"\r\n");
   FileWriteString(Handle0x,DoubleToString(Low[1],8)+"\r\n");
   FileWriteString(Handle0x,IntegerToString(int(Time[1]))+"\r\n");
   MqlDateTime T;
   TimeToStruct(Time[1],T);
   FileWriteString(Handle0x,IntegerToString(int(T.hour))+"\r\n");
   FileWriteString(Handle0x,IntegerToString(int(T.min))+"\r\n");
   FileWriteString(Handle0x,IntegerToString(int(T.day_of_week))+"\r\n");
   //FileClose(Handle0x);
   }

void CloseFile()
   {
   FileClose(Handle0x);
   }

bool bNewBar()
   {
   ArraySetAsSeries(Close,false);
   ArraySetAsSeries(Open,false);
   ArraySetAsSeries(High,false);
   ArraySetAsSeries(Low,false);
   CopyOpen(_Symbol,_Period,0,2,Open);
   CopyClose(_Symbol,_Period,0,2,Close);
   CopyHigh(_Symbol,_Period,0,2,High);
   CopyLow(_Symbol,_Period,0,2,Low);
   ArraySetAsSeries(Close,true);
   ArraySetAsSeries(Open,true);
   ArraySetAsSeries(High,true);
   ArraySetAsSeries(Low,true);
   if ( Time0 < Time[1] )
      {
      if (Time0 != 0)
         {
         Time0=Time[1];
         return true;
         }
      else
         {
         Time0=Time[1];
         return false;
         }
      }
   else return false;
   }

//+------------------------------------------------------------------+
//| Expert initialization function                                   |
//+------------------------------------------------------------------+
int OnInit()
  {
  ArrayResize(Close,2,0);
  ArrayResize(Open,2,0);
  ArrayResize(Time,2,0);
  ArrayResize(High,2,0);
  ArrayResize(Low,2,0);
  FileNameString="DataHistory"+" "+Symbol()+" "+IntegerToString(Period());
  OpenAndWriteStart();
   return(INIT_SUCCEEDED);
  }

void OnDeinit(const int reason)
  {
  WriteEnd();
  CloseFile();
  }

void OnTick()
  {
  ArraySetAsSeries(Time,false);
  CopyTime(_Symbol,_Period,0,2,Time);
  ArraySetAsSeries(Time,true);
  if ( bNewBar()) WriteBar();
  }
It has only a few simple functions. Some functions write something at the beginning of the test, others add some information about the quote at the end, and the main function simply writes information about a bar when it appears. The EA does not have input parameters. Run it on historical data, and it will generate the quote file in the appropriate format, which can be read by the program. Well, this is not a very good solution. Perhaps, in the future I will be able to implement direct quote reading from the terminal. The above solution is quite convenient so far. At least it is convenient for me.
Instead of using temporary functions which convert datetime to the days of the week, hours and minutes, I wrote them into the quote as additional bar information. All of them are integer values, except ENUM_DAY_OF_WEEK. All I had to do was to implement such a numbered list inside C# code, and provide in my templates that the data would be returned in the same form. Avoiding time functions allows you to avoid unnecessary calculations on the C# code side. It also avoids time inconsistencies. Such things are dangerous, so you should better avoid them.
Resulting quote filecan be opened in any text editor. You will see the following simple and clear structure:
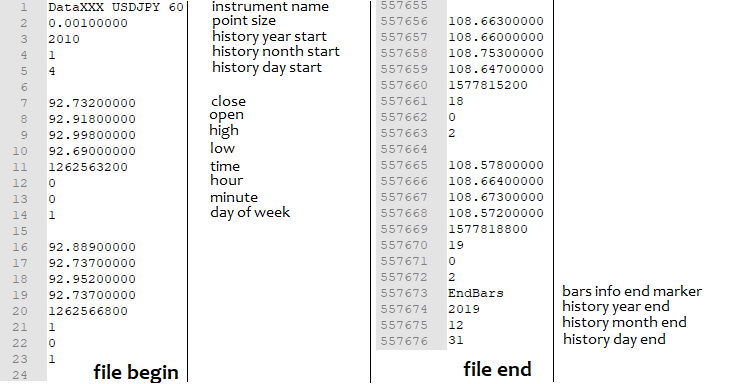
The header of the template, where the variables are registered, previously contained fields for auto-filling at the time of generation. Now variables for trading time and trading days have been added to their list.
Input presetnow looks like this:
double C1[] = { %%%CVALUES%%% };//Brutted Values
int CNum=%%%CNUMVALUE%%%;//Bars To Equation
int DeepBruteX=%%%DEEPVALUE%%%;//Max Pow Of Polynomial
int DatetimeStart=%%%DATETIMESTART%%%;//Help Datetime
input bool bInvert=%%%INVERT%%%;//Invert Trade(or sign of values as the same)
input int DaysToFuture=%%%DAYSFUTURE%%%;//Days To Future
int DaysToTrade[]={ %%%DAYS%%% };//Days To Trade
input double ValueOpenE=%%%OPTVALUE%%%;//Open Signal
input bool bUseTimeCorridorE=%%%TIMECORRIDORVALUE%%%;//Use Time Corridor
input int TradeHour=%%%HOURSTARTVALUE%%%;//Start Trading Hour
input int TradeMinute=%%%MINUTESTARTVALUE%%%;//Start Trading Minute
input int TradeHourEnd=%%%HOURENDVALUE%%%;//End Trading Hour
input int TradeMinuteEnd=%%%MINUTEENDVALUE%%%;//End Trading Minute
All values here are filled in by the program, at the robot creation time, so that the robot can immediately work with default settings and can compile at the terminal start moment without the need to open MetaEditor. All settings and arrays are embedded in the Expert Advisor. I find it convenient. Imagine that you have a lot of Expert Advisors and you have different set files. The brute force software prototype for MetaTrader 4 has shown that I sometimes confuse settings. This may reduce possible functionality, as compared to text files, but this method is more reliable.
The main functionhas also been changed:
bool bDay()//Day check
   {
   MqlDateTime T;
   TimeToStruct(Time[0],T);
   for ( int i=0; i<ArraySize(DaysToTrade); i++ )
      {
      if ( T.day_of_week == DaysToTrade[i] ) return true;
      }
   return false;
   }

void Trade()//Trade Function
   {
   double Value;
   Value=PolinomTrade();
   MqlTick LastTick;
   SymbolInfoTick(Symbol(),LastTick);
   MqlDateTime tm;
   TimeToStruct(LastTick.time,tm);
   int MinuteEquivalent=tm.hour*60+tm.min;
   int BorderMinuteStartTrade=HourCorrect(TradeHour)*60+MinuteCorrect(TradeMinute);
   int BorderMinuteEndTrade=HourCorrect(TradeHourEnd)*60+MinuteCorrect(TradeMinuteEnd);

   if ( Value > ValueCloseE)
      {
      if ( !bInvert ) CloseBuyF();
      else CloseSellF();
      }

   if ( Value < -ValueCloseE)
      {
      if ( !bInvert ) CloseSellF();
      else CloseBuyF();
      }

   if ( !bUseTimeCorridorE )
      {
      if ( double(TimeCurrent()-DatetimeStart)/86400.0 <= DaysToFuture && Value > ValueOpenE && Value <= ValueOpenEMax )
         {
         if ( !bInvert ) SellF();
         else BuyF();
         }

      if ( double(TimeCurrent()-DatetimeStart)/86400.0 <= DaysToFuture && Value < -ValueOpenE && Value >= -ValueOpenEMax )
         {
         if ( !bInvert ) BuyF();
         else SellF();
         }
      }
   else
      {
      if ( BorderMinuteStartTrade > BorderMinuteEndTrade && bDay() )
         {
         if ( !(MinuteEquivalent>=BorderMinuteEndTrade && MinuteEquivalent<= BorderMinuteStartTrade) )
            {
            if ( double(TimeCurrent()-DatetimeStart)/86400.0 <= DaysToFuture && Value > ValueOpenE && Value <= ValueOpenEMax )
               {
               if ( !bInvert ) SellF();
               else BuyF();
               }

            if ( double(TimeCurrent()-DatetimeStart)/86400.0 <= DaysToFuture && Value < -ValueOpenE && Value >= -ValueOpenEMax )
               {
               if ( !bInvert ) BuyF();
               else SellF();
               }
            }
         }
      if ( BorderMinuteStartTrade <= BorderMinuteEndTrade && bDay() )
         {
         if ( MinuteEquivalent>=BorderMinuteStartTrade && MinuteEquivalent<= BorderMinuteEndTrade )
            {
            if ( double(TimeCurrent()-DatetimeStart)/86400.0 <= DaysToFuture && Value > ValueOpenE && Value <= ValueOpenEMax )
               {
               if ( !bInvert ) SellF();
               else BuyF();
               }

            if ( double(TimeCurrent()-DatetimeStart)/86400.0 <= DaysToFuture && Value < -ValueOpenE && Value >= -ValueOpenEMax )
               {
               if ( !bInvert ) BuyF();
               else SellF();
               }
            }
         }
      }

   if ( bPrintValue ) Print("Value="+DoubleToString(Value));
   }
We have added here only the logic for controlling the days of the week and the time interval within the day, while the rest remained unchanged. By the way, the time interval does not have to be between 0-24 hours. It can start on one day and end on another. So, it can include the swap charging point. According to the original idea, positions can be placed in specified corridors and can be closed at any time. Perhaps, a better solution would be to add forced position closing by time as a separate operation. So far, it seems to me that current approach should generate more stable robots, because we make the boundaries of the time corridor vague. This is done to reduce the probability of obtaining a random result though a confirmation that the found corridor and its formula does not abruptly stop performance but gradually attenuates.
Analyzing Global patterns
All results presented here were obtained based on the training in the interval 2010.01.01-2020.01.01, as in the previous article. This is done intentionally to leave the current year as a forward period to check the results. The forward period is 2020.01-2020.12.01.
The quality of results has increased significantly. Although the number of deals has decreased, the forward period result has become better. As I assumed in the last article, an increase in the quality of the initial test leads to an increase in the pattern lifetime in the forward period. The proof will be provided below.
Let us start with the EURCHF H1 pair. The previous analysis showed good predictability of this symbol, so I decided to start with it. I have created 3 Expert Advisors based on optimization results. I will additionally provide a couple of tests from MetaTrader 4, to show how much the performance of found patterns has improved. Take a look at the first option:
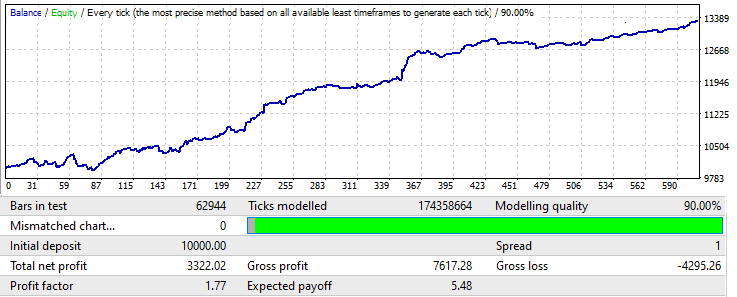
Testing lot was set to 0.1. If we compare the resulting Expected Payoff with that in the previous program version, it has increased to USD 54 from the previous USD 8. The profit factor has also increased significantly, at least by 0.5 (maybe even more). The same parameter in the last article was around 1.14. This was the highest profit factor which I managed to get. You can see, how structuring of a sample by days of the week and operation time has influenced the results.
However, this is not the best possible result. Tests were conducted for a very limited time, due to the task specifics. The time frame was very tight. In total, all tests took about 2-3 days. Tests were performed on 2 cores, and each variant took about 5-6 hours.
Also, during the testing process, I found some errors in the program algorithm, which often generated false results. I have already fixed them, but this reduced the number of found patterns. Nevertheless, this time was enough to find acceptable options. Now, let us the test in MetaTrader 5:
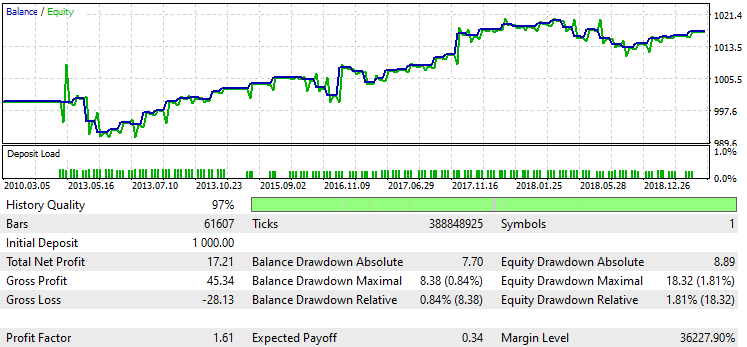
This test had less deals, because I limited the testing spread in order to obtain a stable test while trying to achieve higher profitability. However, as practice shown, this is not necessary. I will explain at the end of the article why. Despite the very small number of trades, this data can still be considered reliable, as they are based on a very long sample (it was obtained while brute forcing the formula coefficients on the first tab). In fact, on the first tab, we calculate all the bars that are in the loaded segment, so this is an ideal base for optimization. When we take a part of results of a large sample into a smaller sample, then the more data is contained in the first sample (orders), the stronger the smaller pattern.
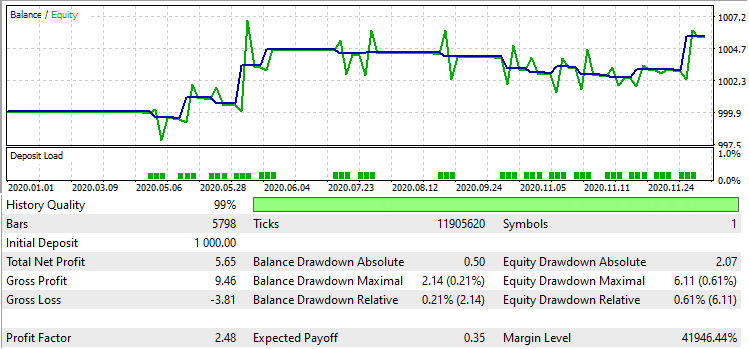
Here is the forward period test:
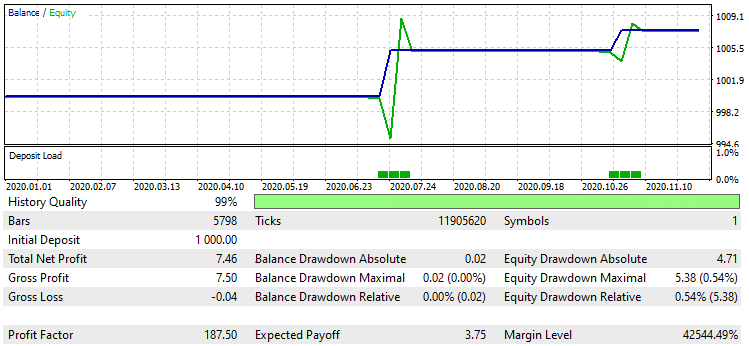
There are only 2 trades in 1 year, but the result is positive.
Here is another result for the same interval:
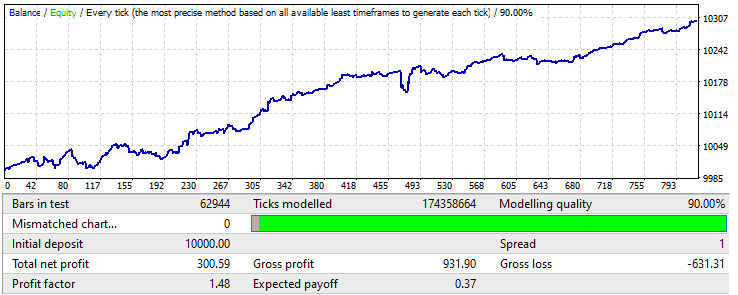
Without spread requirements, this formula is loss-making in MetaTrader 5. But if we limit the spread, based on the obtained expected payoff, there will be good signals, although the graph does not look good:
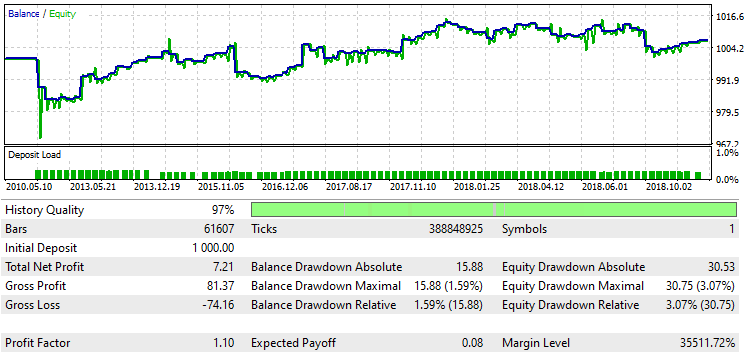
The graph is really bad, so how can we benefit from it in the future? Well, the graph is based on a huge underlying sample which empowers all further samples, do there is nothing bad in such a graph. Anyway, it shows some profit. Let us check the future:
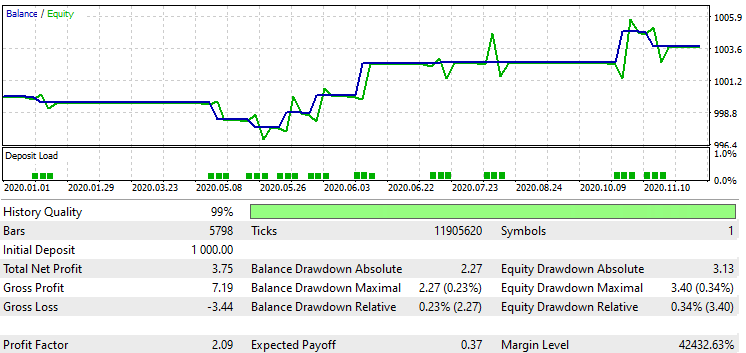
As you can see, the result is very good, although there are not so many deals. Actually, testing results are better in recent years, because brokers are constantly reducing spreads while using new technologies. Now, a conclusion regarding forecasts and their possible performance is quite good. However, there are not enough data to draw final conclusions. So, I performed a few more test on different currency pairs - they will be shown later. Now, let us view the third robot on the same currency pair.
There will be no more tests from MetaTrader 4. I think two full variants are enough for comparison. So, here is the third variant:
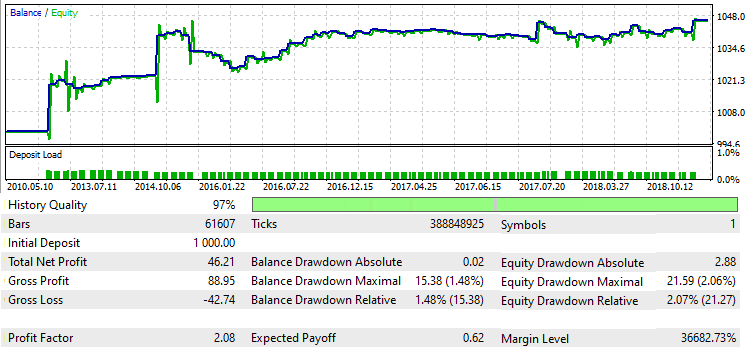
The graph is not that bad. Now, let us check the future:
The same picture. All forward periods have shown positive results. One may say that the results are similar because all the three robots were trained on the same data interval of the same currency pair and thus they describe the same pattern.
Or that the currency pair is so good, that the robots are positive. Even if it is so, we can benefit from it. But the reasons are more general. To prove that the reason is not only in the currency pair or in the interval, let us check another currency pair on a different timeframe.
Testing EURUSD H4
I do not provide tests from MetaTrader 4 here, but graphs for this currency pair look as smooth and beautiful as previous tests. I found two different bots on this timeframe. The first one:
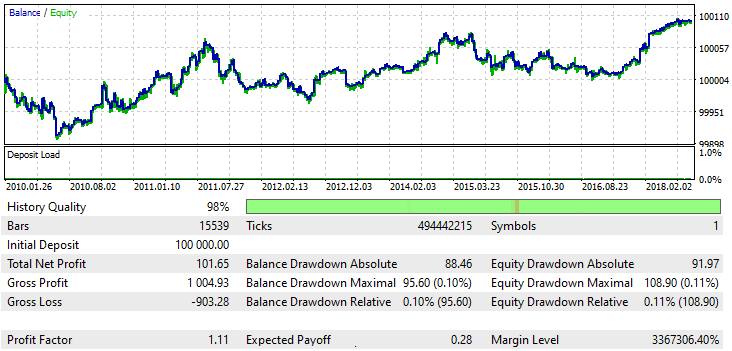
The graph is ugly, but according to our previous assumptions, this should not upset us as this is only a part of a very big sample. Check the future:
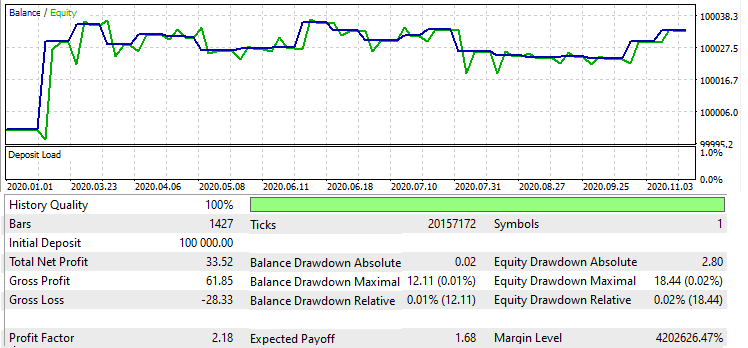
Again, the pattern works the whole year. Even if we do not take into account the first order, which was the largest one, the rest part is also positive.
Now, let us check the second EA:
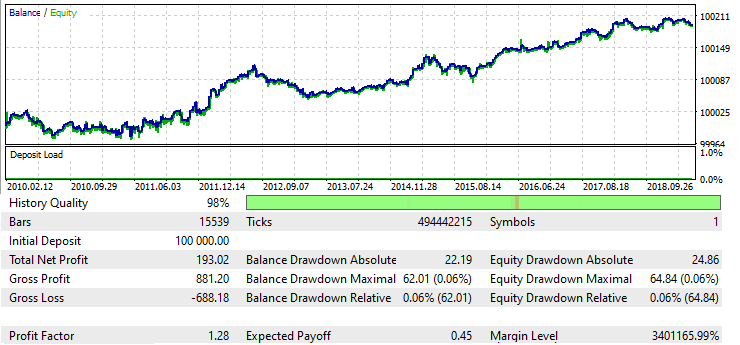
This is the smoothest graph of all. Here is the forward:
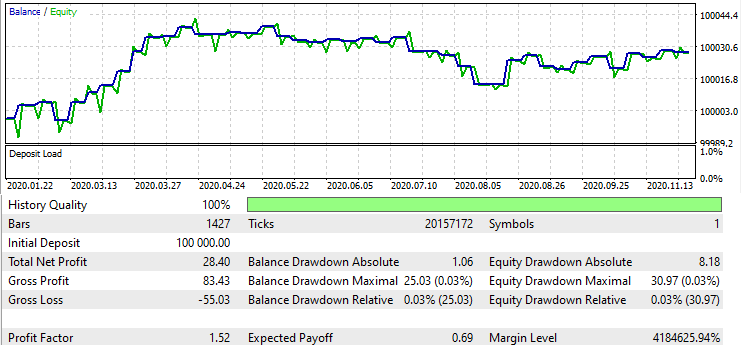
Everything works as expected. The graph even resembles a straight line, despite the big hill at the beginning. We have tested five Expert Advisors on two different currency pairs, and all forward tests have been positive. This is good statistics. However, I need more data. So, I decided to check an absolutely different pair and a different timeframe.
Testing EURJPY M5.
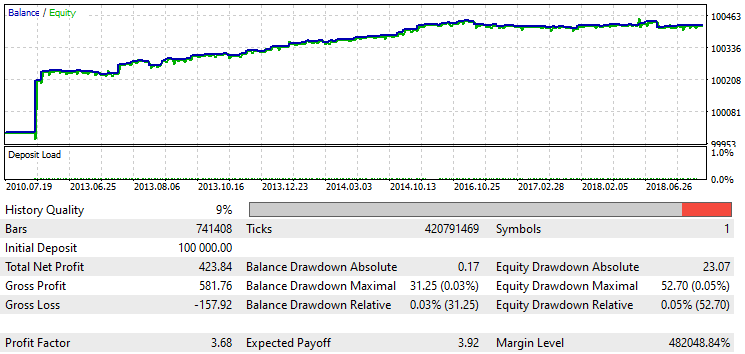
The training interval looks strange, there is a pronounced reversal in 2015, but the general result looks good. Here is the forward period:
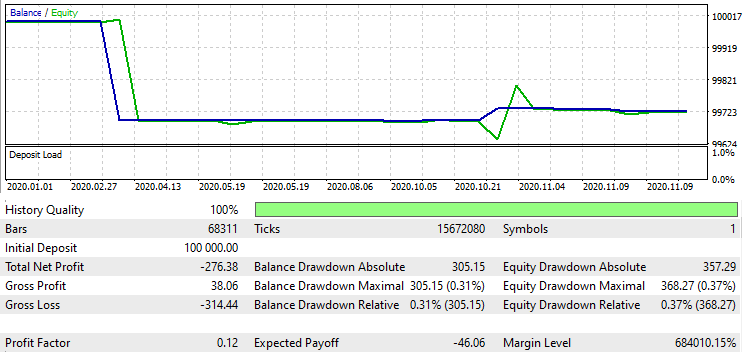
It is difficult to draw conclusions, but it is clear that this is the first negative forward test. Nevertheless, I do not think that this result is a refutation of the assumption about the stability of all our algorithms. This is because there was a clear reversal in 2015 in the backtest. I am not trying to fit the results to my vision of the market, but I see the reason in that reversal. On the contrary, we deal with the continuation of that reversal which happened in 2015.
To avoid such influences of external results, the pattern search algorithm needs some modifications. This algorithm modification will be implemented in the next version.
Drawing conclusions
I believe that the above tests are enough to draw several important conclusions regarding the search and testing of working Expert Advisors in the MetaTrader 4 and MetaTrader 5 terminals. Testers in these two terminals work slightly differently. Quotes in MetaTrader 4 store history without spread data, thereby allowing the user to set spread to "1", which is almost equal to "0". The spread does not matter at all for most Expert Advisors, while we can detect not very obvious patterns and develop them. This is not possible in MetaTrader 5. But MetaTrader 5 quotes include spread information, which allows to assess the real profitability of the system.
According to my experience, if a system originally written for MetaTrader 4 was not properly converted for the fifth terminal, such a system has very little chance of showing profit, because most of the patterns that we can find lie within the spread, so they are useless. It might be possible in some cases to find signals with the minimum spread among all the signals. But this is not always possible.
Very often, by decreasing the required spread we worsen signals. In this case, I manually selected spreads for MetaTrader 5 tests, in order to get acceptable tests, but this takes a very long time. This can be done automatically by modifying the program. The following figure shows the current pattern search process, up to the last stage, and a possible automation of the spread selection process:
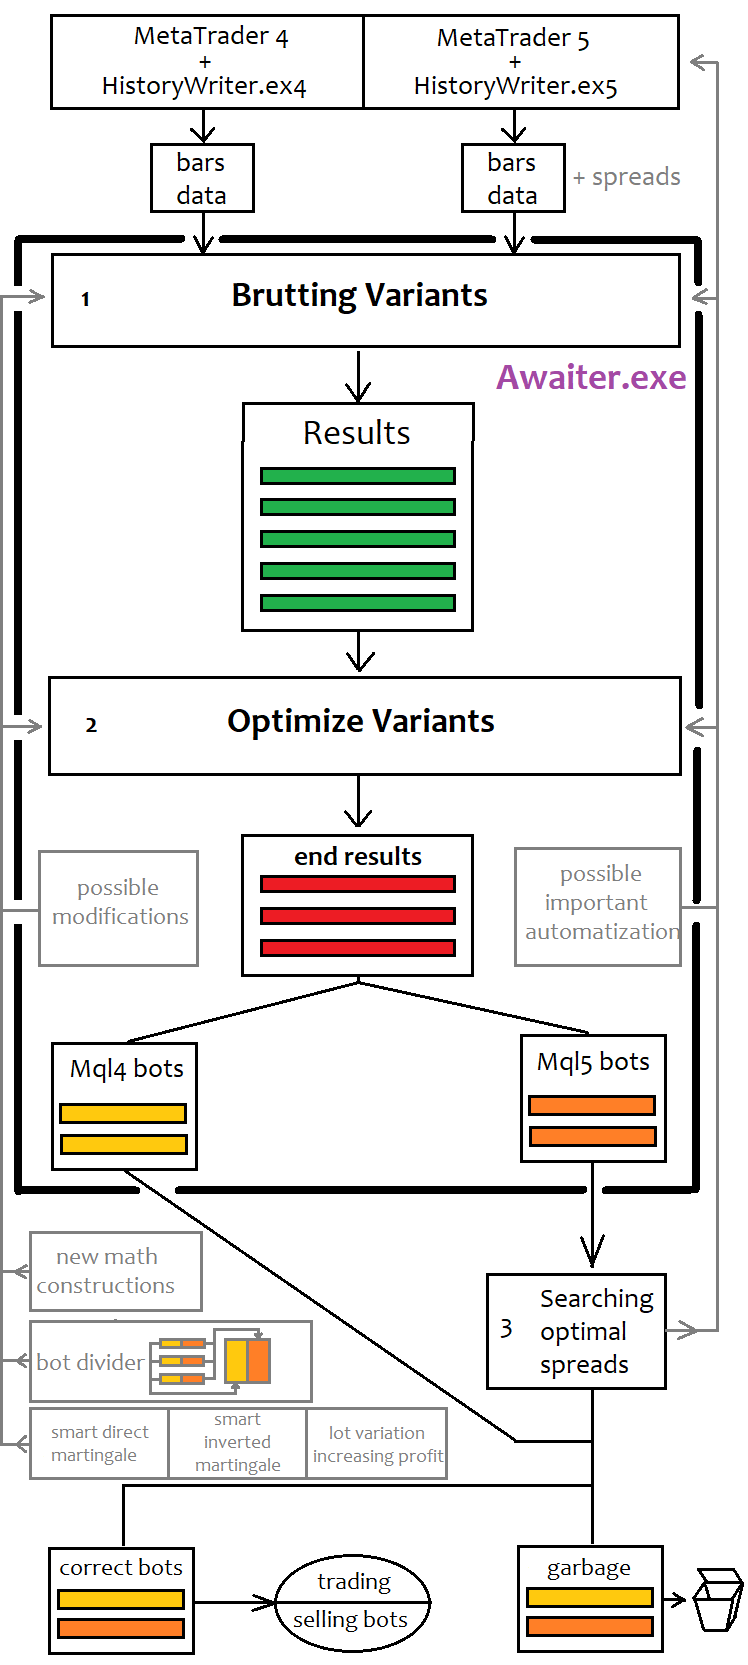
The diagram shows the entire new EA development cycle, from the very beginning to the end. The current implemented state of this cycle is shown in black. Gray is used for possible modifications. Further possible improvements are divided into 6 categories:
- Using the simplest mathematical functions to process bar data
- Adding lot variation mechanisms that increase the profit factor for Expert Advisors that implement global patterns
- Adding martingale and reverse martingale mechanisms for working on ultra-short periods
- Adding a mechanism for combining good EA into one bot with the highest possible frequency of trades
- Adding spreads to the quote and avoiding manual spread selection (full automation of the entire development cycle)
- Correction of detected optimizer errors
I would like to highlight points 1, 5 and 6. The variability of brute force formulas will enable us to create more different variants of Expert Advisors from one brute-optimization cycle and to increase the average quality of the results. In comments to previous articles, users suggested using Fourier series to describe periodic market processes. I wanted to leave this task for later modifications. But the method is not so difficult. We do not need to convert any functions to a series, but we only need to find the coefficients of the terms, similar to Taylor series which I use. In addition, the variability of this method will be much higher than that of the Taylor series. My algorithm used only the first degree, because as the degrees increase, the quality decreases due to a disproportionate increase in the complexity of the calculation. Spreads are also very important. Why filter signals manually when you can do it automatically? There were also bar time mismatches, but these errors were fixed. Such mismatches were due to the difference in the functionality of the templates and the functionality of the software.
Well, the ultimate purpose of this software is to automate the whole process, including development, testing and optimization of Expert Advisors for both platforms. Those actions which I still perform manually can also be automated. Moreover, the machine can find the appropriate variants much faster. To be honest, this is due to my laziness that I do not want to manually configure such elementary things as spread size. This process significantly increases the trading system development cycle. What is important is the quantity and quality of obtained results per time unit, as this directly affects further profits. Furthermore, if you spend too much time configuring the system, it can become irrelevant. Most of found Expert Advisors will work for a very limited time, so everything should be done very fast. Or you can use an optimizer every month, but this is a bad solution.
If I see the potential in the further development of the idea, I will continue to develop it. If the idea is successful, I will create a similar program for gradient boosting, or will add a new mode in the form of the third stage of data analysis. Because the method itself is very good as a predictor search engine for gradient boosting. So, we can simply use predictors found by this method instead of inventing and testing new ones. However, this requires a much more serious and deep modification. So, I will not do it right now. But a couple of modifications that I have mentioned above have already been implemented, and now I am testing them and collecting data for the next article. So, "TO BE CONTINUED".
All earlier articles were mainly focused on MetaTrader 4, but as practice has shown, automation allows switching to MetaTrader 5. This approach will be fully implemented in the next article.
MetaTrader 5 is a much more progressive platform, which provides real tick history and spread data, which makes it possible to assess the real profitability of any trading system, so it is better to focus on this platform.
During the testing process, I found a very important factor that reduces the quality of generated Expert Advisors and the percentage of the EAs that can further pass selection after testing on real tick data in MetaTrader 5. This factor is very important not only for machine learning-based systems, but also for any other Expert Advisors that were originally created in MetaTrader 4. It is connected with the spread and how it affects the final data sample for training. Many users ignore the spread, or only take it into account when trading. But it contains one invisible but very important component that has a very negative effect on the machine learning process. I will provide the details of it in the next article.
Conclusion
The most important conclusion from this article is that if you want to increase the chances of your program's real performance, your trading robots must be implemented in MQL5. MQL5 programs can be tested in conditions very close to real ones. The in-depth analysis has shown, that without tests in MetaTrader 5 you cannot receive truly reliable results.
As the article shows, even limited computational power can generate a result if we use very simple mathematical formulas, such as linear polynomials and polynomials of higher degrees. The program provides basis for further use of simple mathematical functions. The results show that a linear and power combination of the simplest function can provide an excellent signal for trading.
The results show that any set of logical conditions can be reduced to a single quantitative metric in the form of a function. In fact, the formula builds an indicator that generates symmetric positive and negative values that can be used as buy or sell signals. The indicator formula is always different and this ensures the variability of the method. I think many traders dream of an indicator which can tell exactly when to buy and when to sell. This method implements this opportunity to the maximum extent allowed by the market. The next article will provide much better results. I will try to consolidate all the conclusions that have been made throughout the entire series of these articles. I will also provide some details, which will be useful both for manual creation of trading systems and for machine learning processes.
References
Translated from Russian by MetaQuotes Ltd.
Original article: https://www.mql5.com/ru/articles/8661
Warning: All rights to these materials are reserved by MetaQuotes Ltd. Copying or reprinting of these materials in whole or in part is prohibited.
This article was written by a user of the site and reflects their personal views. MetaQuotes Ltd is not responsible for the accuracy of the information presented, nor for any consequences resulting from the use of the solutions, strategies or recommendations described.
 Developing a self-adapting algorithm (Part II): Improving efficiency
 Finding seasonal patterns in the forex market using the CatBoost algorithm
 Neural networks made easy (Part 10): Multi-Head Attention
 The market and the physics of its global patterns
- Free trading apps
- Over 8,000 signals for copying
- Economic news for exploring financial markets
You agree to website policy and terms of use
The more free variables the better "nailing the story" :-)
see about the elephant https://ru.wikipedia.org/wiki/Слон_фон_Неймана
By the way that's what I was going to say roughly but you did it better )
Pero donde está el programa para la búsqueda de patrones que no encuentro?
El programa será, pero solo después del cuarto artículo, se está preparando el artículo. También lo hará el producto. Es en el producto donde el programa estará disponible como adicional software. The actual version is desactualised after much longer. In this moment, the programme has mejorado mucho. cuanto voy a mostrar en el articulo
An amazing idea. I take my hat off to you, you are so incredibly original and creative!!!!