Articles on the MQL5 programming and use of technical indicators
Technical indicators constitute an important part of trading, and every trader tries to find something new. The authors of these articles talk about econometrics and machine learning, automatic marking of Elliott Waves and digital filters - everything from the classical methods of analysis to the modern interpretation of classical ideas.
The category features articles that will teach you how to develop a custom indicator and contains unique collections of ready-to-use mathematically explained William Blau's trading ideas.
Add a new article

You are missing trading opportunities:
- Free trading apps
- Over 8,000 signals for copying
- Economic news for exploring financial markets
Registration
Log in
You agree to website policy and terms of use
If you do not have an account, please register

Creating Custom Indicators in MQL5 (Part 2): Building a Gauge-Style RSI Display with Canvas and Needle Mechanics
In this article, we develop a gauge-style RSI indicator in MQL5 that visualizes Relative Strength Index values on a circular scale with a dynamic needle, color-coded ranges for overbought and oversold levels, and customizable legends. We utilize the Canvas class to draw elements like arcs, ticks, and pies, ensuring smooth updates on new RSI data.

Larry Williams Market Secrets (Part 1): Building a Swing Structure Indicator in MQL5
A practical guide to building a Larry Williams–style market structure indicator in MQL5, covering buffer setup, swing-point detection, plot configuration, and how traders can apply the indicator in technical market analysis.
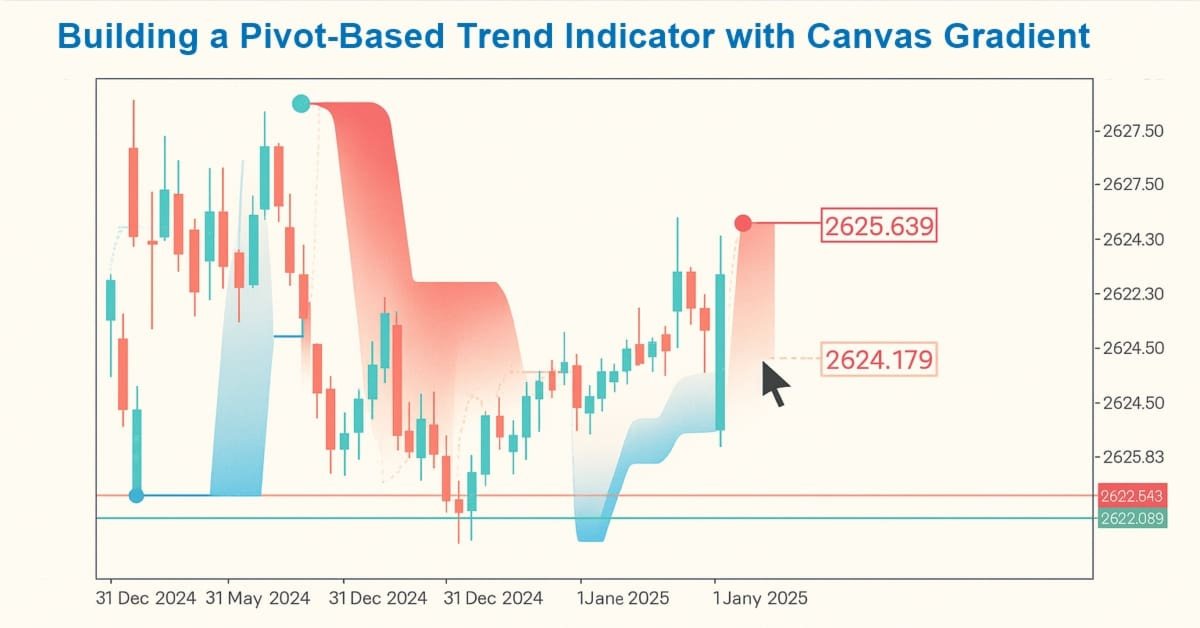
Creating Custom Indicators in MQL5 (Part 1): Building a Pivot-Based Trend Indicator with Canvas Gradient
In this article, we create a Pivot-Based Trend Indicator in MQL5 that calculates fast and slow pivot lines over user-defined periods, detects trend directions based on price relative to these lines, and signals trend starts with arrows while optionally extending lines beyond the current bar. The indicator supports dynamic visualization with separate up/down lines in customizable colors, dotted fast lines that change color on trend shifts, and optional gradient filling between lines, using a canvas object for enhanced trend-area highlighting.

Introduction to MQL5 (Part 32): Mastering API and WebRequest Function in MQL5 (VI)
This article will show you how to visualize candle data obtained via the WebRequest function and API in candle format. We'll use MQL5 to read the candle data from a CSV file and display it as custom candles on the chart, since indicators cannot directly use the WebRequest function.

Codex Pipelines, from Python to MQL5, for Indicator Selection: A Multi-Quarter Analysis of the XLF ETF with Machine Learning
We continue our look at how the selection of indicators can be pipelined when facing a ‘none-typical’ MetaTrader asset. MetaTrader 5 is primarily used to trade forex, and that is good given the liquidity on offer, however the case for trading outside of this ‘comfort-zone’, is growing bolder with not just the overnight rise of platforms like Robinhood, but also the relentless pursuit of an edge for most traders. We consider the XLF ETF for this article and also cap our revamped pipeline with a simple MLP.
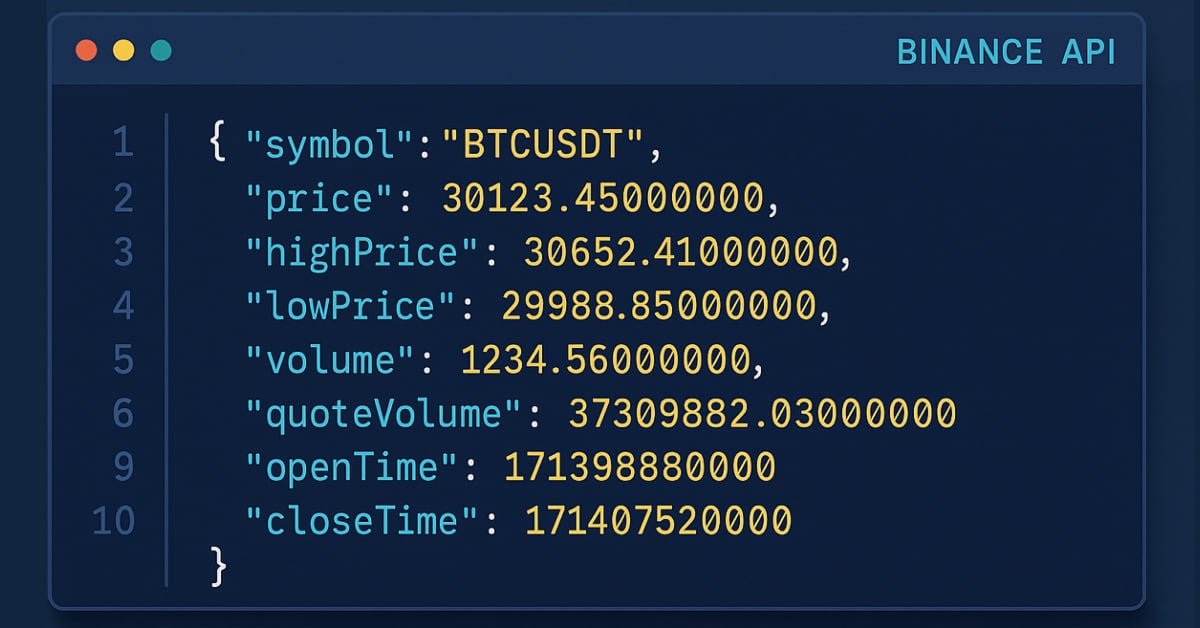
Introduction to MQL5 (Part 31): Mastering API and WebRequest Function in MQL5 (V)
Learn how to use WebRequest and external API calls to retrieve recent candle data, convert each value into a usable type, and save the information neatly in a table format. This step lays the groundwork for building an indicator that visualizes the data in candle format.
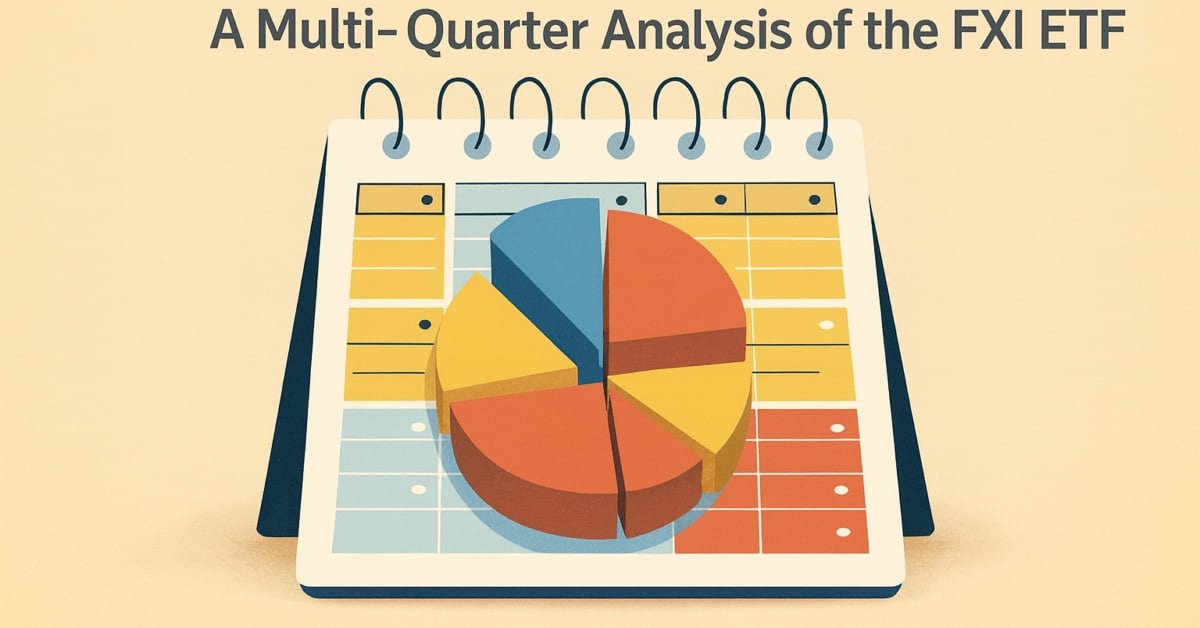
Codex Pipelines: From Python to MQL5 for Indicator Selection — A Multi-Quarter Analysis of the FXI ETF
We continue our look at how MetaTrader can be used outside its forex trading ‘comfort-zone’ by looking at another tradable asset in the form of the FXI ETF. Unlike in the last article where we tried to do ‘too-much’ by delving into not just indicator selection, but also considering indicator pattern combinations, for this article we will swim slightly upstream by focusing more on indicator selection. Our end product for this is intended as a form of pipeline that can help recommend indicators for various assets, provided we have a reasonable amount of their price history.

Developing a Trading Strategy: Using a Volume-Bound Approach
In the world of technical analysis, price often takes center stage. Traders meticulously map out support, resistance, and patterns, yet frequently ignore the critical force that drives these movements: volume. This article delves into a novel approach to volume analysis: the Volume Boundary indicator. This transformation, utilizing sophisticated smoothing functions like the butterfly and triple sine curves, allows for clearer interpretation and the development of systematic trading strategies.

Price Action Analysis Toolkit Development (Part 53): Pattern Density Heatmap for Support and Resistance Zone Discovery
This article introduces the Pattern Density Heatmap, a price‑action mapping tool that transforms repeated candlestick pattern detections into statistically significant support and resistance zones. Rather than treating each signal in isolation, the EA aggregates detections into fixed price bins, scores their density with optional recency weighting, and confirms levels against higher‑timeframe data. The resulting heatmap reveals where the market has historically reacted—levels that can be used proactively for trade timing, risk management, and strategy confidence across any trading style.

Market Positioning Codex for VGT with Kendall's Tau and Distance Correlation
In this article, we look to explore how a complimentary indicator pairing can be used to analyze the recent 5-year history of Vanguard Information Technology Index Fund ETF. By considering two options of algorithms, Kendall’s Tau and Distance-Correlation, we look to select not just an ideal indicator pair for trading the VGT, but also suitable signal-pattern pairings of these two indicators.

Price Action Analysis Toolkit Development (Part 52): Master Market Structure with Multi-Timeframe Visual Analysis
This article presents the Multi‑Timeframe Visual Analyzer, an MQL5 Expert Advisor that reconstructs and overlays higher‑timeframe candles directly onto your active chart. It explains the implementation, key inputs, and practical outcomes, supported by an animated demo and chart examples showing instant toggling, multi‑timeframe confirmation, and configurable alerts. Read on to see how this tool can make chart analysis faster, clearer, and more efficient.

Mastering Kagi Charts in MQL5 (Part I): Creating the Indicator
Learn how to build a complete Kagi Chart engine in MQL5—constructing price reversals, generating dynamic line segments, and updating Kagi structures in real time. This first part teaches you how to render Kagi charts directly on MetaTrader 5, giving traders a clear view of trend shifts and market strength while preparing for automated Kagi-based trading logic in Part 2.

Developing a Trading Strategy: The Flower Volatility Index Trend-Following Approach
The relentless quest to decode market rhythms has led traders and quantitative analysts to develop countless mathematical models. This article has introduced the Flower Volatility Index (FVI), a novel approach that transforms the mathematical elegance of Rose Curves into a functional trading tool. Through this work, we have shown how mathematical models can be adapted into practical trading mechanisms capable of supporting both analysis and decision-making in real market conditions.

Price Action Analysis Toolkit Development (Part 51): Revolutionary Chart Search Technology for Candlestick Pattern Discovery
This article is intended for algorithmic traders, quantitative analysts, and MQL5 developers interested in enhancing their understanding of candlestick pattern recognition through practical implementation. It provides an in‑depth exploration of the CandlePatternSearch.mq5 Expert Advisor—a complete framework for detecting, visualizing, and monitoring classical candlestick formations in MetaTrader 5. Beyond a line‑by‑line review of the code, the article discusses architectural design, pattern detection logic, GUI integration, and alert mechanisms, illustrating how traditional price‑action analysis can be automated efficiently.

Markets Positioning Codex in MQL5 (Part 2): Bitwise Learning, with Multi-Patterns for Nvidia
We continue our new series on Market-Positioning, where we study particular assets, with specific trade directions over manageable test windows. We started this by considering Nvidia Corp stock in the last article, where we covered 5 signal patterns from the complimentary pairing of the RSI and DeMarker oscillators. For this article, we cover the remaining 5 patterns and also delve into multi-pattern options that not only feature untethered combinations of all ten, but also specialized combinations of just a pair.

Developing Trading Strategy: Pseudo Pearson Correlation Approach
Generating new indicators from existing ones offers a powerful way to enhance trading analysis. By defining a mathematical function that integrates the outputs of existing indicators, traders can create hybrid indicators that consolidate multiple signals into a single, efficient tool. This article introduces a new indicator built from three oscillators using a modified version of the Pearson correlation function, which we call the Pseudo Pearson Correlation (PPC). The PPC indicator aims to quantify the dynamic relationship between oscillators and apply it within a practical trading strategy.

Markets Positioning Codex in MQL5 (Part 1): Bitwise Learning for Nvidia
We commence a new article series that builds upon our earlier efforts laid out in the MQL5 Wizard series, by taking them further as we step up our approach to systematic trading and strategy testing. Within these new series, we’ll concentrate our focus on Expert Advisors that are coded to hold only a single type of position - primarily longs. Focusing on just one market trend can simplify analysis, lessen strategy complexity and expose some key insights, especially when dealing in assets beyond forex. Our series, therefore, will investigate if this is effective in equities and other non-forex assets, where long only systems usually correlate well with smart money or institution strategies.

Developing a Trading Strategy: The Triple Sine Mean Reversion Method
This article introduces the Triple Sine Mean Reversion Method, a trading strategy built upon a new mathematical indicator — the Triple Sine Oscillator (TSO). The TSO is derived from the sine cube function, which oscillates between –1 and +1, making it suitable for identifying overbought and oversold market conditions. Overall, the study demonstrates how mathematical functions can be transformed into practical trading tools.

How can century-old functions update your trading strategies?
This article considers the Rademacher and Walsh functions. We will explore ways to apply these functions to financial time series analysis and also consider various applications for them in trading.

Price Action Analysis Toolkit Development (Part 49): Integrating Trend, Momentum, and Volatility Indicators into One MQL5 System
Simplify your MetaTrader 5 charts with the Multi Indicator Handler EA. This interactive dashboard merges trend, momentum, and volatility indicators into one real‑time panel. Switch instantly between profiles to focus on the analysis you need most. Declutter with one‑click Hide/Show controls and stay focused on price action. Read on to learn step‑by‑step how to build and customize it yourself in MQL5.

Developing a Trading Strategy: The Butterfly Oscillator Method
In this article, we demonstrated how the fascinating mathematical concept of the Butterfly Curve can be transformed into a practical trading tool. We constructed the Butterfly Oscillator and built a foundational trading strategy around it. The strategy effectively combines the oscillator's unique cyclical signals with traditional trend confirmation from moving averages, creating a systematic approach for identifying potential market entries.
Price Action Analysis Toolkit Development (Part 47): Tracking Forex Sessions and Breakouts in MetaTrader 5
Global market sessions shape the rhythm of the trading day, and understanding their overlap is vital to timing entries and exits. In this article, we’ll build an interactive trading sessions EA that brings those global hours to life directly on your chart. The EA automatically plots color‑coded rectangles for the Asia, Tokyo, London, and New York sessions, updating in real time as each market opens or closes. It features on‑chart toggle buttons, a dynamic information panel, and a scrolling ticker headline that streams live status and breakout messages. Tested on different brokers, this EA combines precision with style—helping traders see volatility transitions, identify cross‑session breakouts, and stay visually connected to the global market’s pulse.

From Novice to Expert: Parameter Control Utility
Imagine transforming the traditional EA or indicator input properties into a real-time, on-chart control interface. This discussion builds upon our foundational work in the Market Periods Synchronizer indicator, marking a significant evolution in how we visualize and manage higher-timeframe (HTF) market structures. Here, we turn that concept into a fully interactive utility—a dashboard that brings dynamic control and enhanced multi-period price action visualization directly onto the chart. Join us as we explore how this innovation reshapes the way traders interact with their tools.

Mastering Quick Trades: Overcoming Execution Paralysis
The UT BOT ATR Trailing Indicator is a personal and customizable indicator that is very effective for traders who like to make quick decisions and make money from differences in price referred to as short-term trading (scalpers) and also proves to be vital and very effective for long-term traders (positional traders).

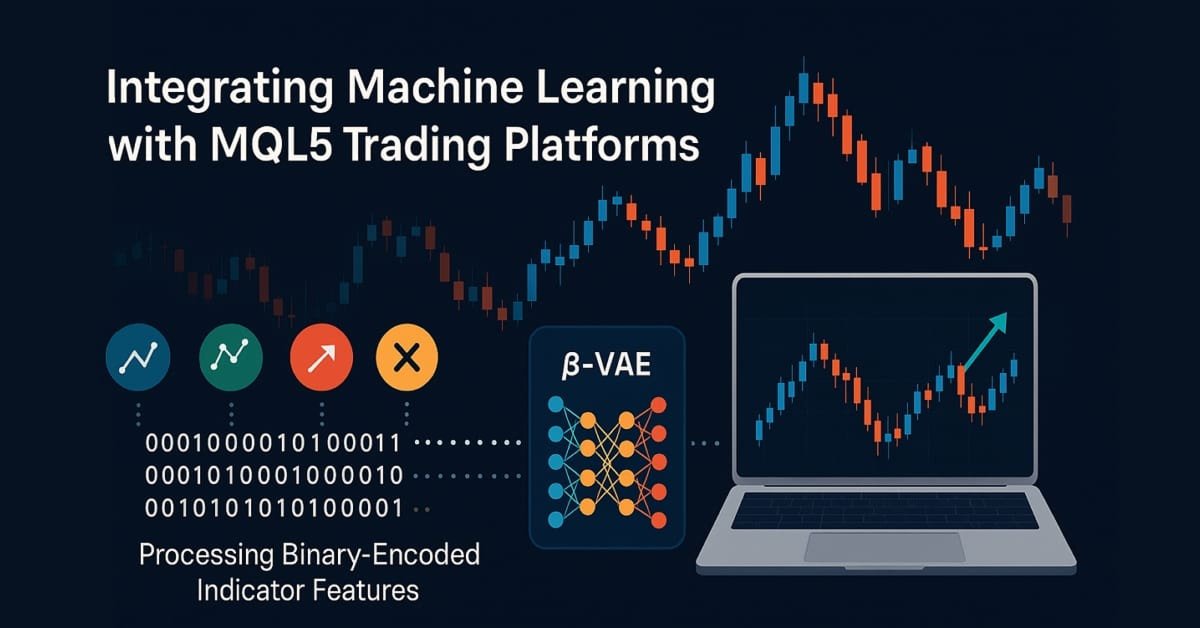
MQL5 Wizard Techniques you should know (Part 85): Using Patterns of Stochastic-Oscillator and the FrAMA with Beta VAE Inference Learning
This piece follows up ‘Part-84’, where we introduced the pairing of Stochastic and the Fractal Adaptive Moving Average. We now shift focus to Inference Learning, where we look to see if laggard patterns in the last article could have their fortunes turned around. The Stochastic and FrAMA are a momentum-trend complimentary pairing. For our inference learning, we are revisiting the Beta algorithm of a Variational Auto Encoder. We also, as always, do the implementation of a custom signal class designed for integration with the MQL5 Wizard.

Price Action Analysis Toolkit Development (Part 46): Designing an Interactive Fibonacci Retracement EA with Smart Visualization in MQL5
Fibonacci tools are among the most popular instruments used by technical analysts. In this article, we’ll build an Interactive Fibonacci EA that draws retracement and extension levels that react dynamically to price movement, delivering real‑time alerts, stylish lines, and a scrolling news‑style headline. Another key advantage of this EA is flexibility; you can manually type the high (A) and low (B) swing values directly on the chart, giving you exact control over the market range you want to analyze.

Introduction to MQL5 (Part 24): Building an EA that Trades with Chart Objects
This article teaches you how to create an Expert Advisor that detects support and resistance zones drawn on the chart and executes trades automatically based on them.

MQL5 Wizard Techniques you should know (Part 84): Using Patterns of Stochastic Oscillator and the FrAMA - Conclusion
The Stochastic Oscillator and the Fractal Adaptive Moving Average are an indicator pairing that could be used for their ability to compliment each other within an MQL5 Expert Advisor. We introduced this pairing in the last article, and now look to wrap up by considering its 5 last signal patterns. In exploring this, as always, we use the MQL5 wizard to build and test out their potential.

MQL5 Wizard Techniques you should know (Part 83): Using Patterns of Stochastic Oscillator and the FrAMA — Behavioral Archetypes
The Stochastic Oscillator and the Fractal Adaptive Moving Average are another indicator pairing that could be used for their ability to compliment each other within an MQL5 Expert Advisor. We look at the Stochastic for its ability to pinpoint momentum shifts, while the FrAMA is used to provide confirmation of the prevailing trends. In exploring this indicator pairing, as always, we use the MQL5 wizard to build and test out their potential.

Introduction to MQL5 (Part 22): Building an Expert Advisor for the 5-0 Harmonic Pattern
This article explains how to detect and trade the 5-0 harmonic pattern in MQL5, validate it using Fibonacci levels, and display it on the chart.

MQL5 Wizard Techniques you should know (Part 82): Using Patterns of TRIX and the WPR with DQN Reinforcement Learning
In the last article, we examined the pairing of Ichimoku and the ADX under an Inference Learning framework. For this piece we revisit, Reinforcement Learning when used with an indicator pairing we considered last in ‘Part 68’. The TRIX and Williams Percent Range. Our algorithm for this review will be the Quantile Regression DQN. As usual, we present this as a custom signal class designed for implementation with the MQL5 Wizard.
MQL5 Wizard Techniques you should know (Part 81): Using Patterns of Ichimoku and the ADX-Wilder with Beta VAE Inference Learning
This piece follows up ‘Part-80’, where we examined the pairing of Ichimoku and the ADX under a Reinforcement Learning framework. We now shift focus to Inference Learning. Ichimoku and ADX are complimentary as already covered, however we are going to revisit the conclusions of the last article related to pipeline use. For our inference learning, we are using the Beta algorithm of a Variational Auto Encoder. We also stick with the implementation of a custom signal class designed for integration with the MQL5 Wizard.

Developing Advanced ICT Trading Systems: Implementing Signals in the Order Blocks Indicator
In this article, you will learn how to develop an Order Blocks indicator based on order book volume (market depth) and optimize it using buffers to improve accuracy. This concludes the current stage of the project and prepares for the next phase, which will include the implementation of a risk management class and a trading bot that uses signals generated by the indicator.
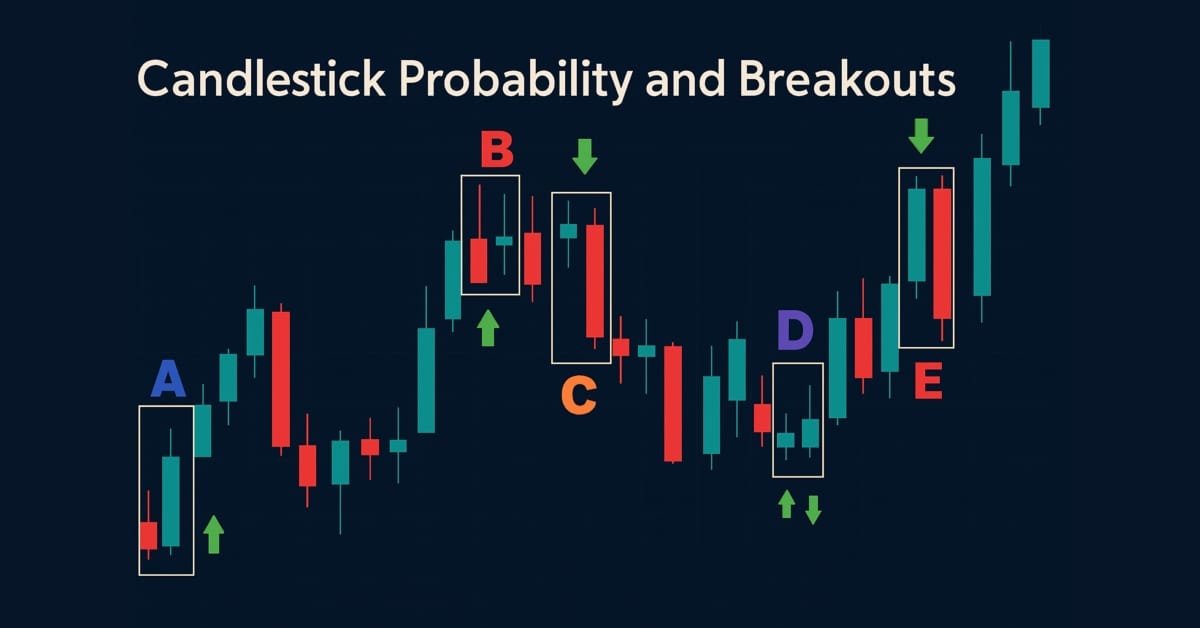
Price Action Analysis Toolkit Development (Part 43): Candlestick Probability and Breakouts
Enhance your market analysis with the MQL5-native Candlestick Probability EA, a lightweight tool that transforms raw price bars into real-time, instrument-specific probability insights. It classifies Pinbars, Engulfing, and Doji patterns at bar close, uses ATR-aware filtering, and optional breakout confirmation. The EA calculates raw and volume-weighted follow-through percentages, helping you understand each pattern's typical outcome on specific symbols and timeframes. On-chart markers, a compact dashboard, and interactive toggles allow easy validation and focus. Export detailed CSV logs for offline testing. Use it to develop probability profiles, optimize strategies, and turn pattern recognition into a measurable edge.

Building a Professional Trading System with Heikin Ashi (Part 2): Developing an EA
This article explains how to develop a professional Heikin Ashi-based Expert Advisor (EA) in MQL5. You will learn how to set up input parameters, enumerations, indicators, global variables, and implement the core trading logic. You will also be able to run a backtest on gold to validate your work.
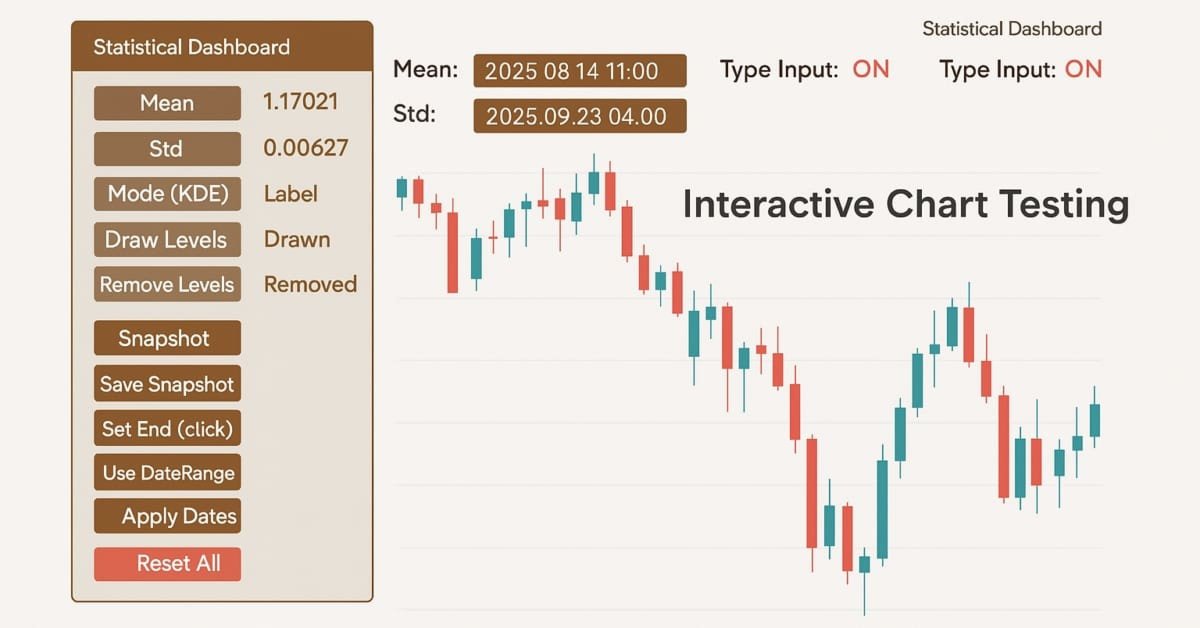
Price Action Analysis Toolkit Development (Part 42): Interactive Chart Testing with Button Logic and Statistical Levels
In a world where speed and precision matter, analysis tools need to be as smart as the markets we trade. This article presents an EA built on button logic—an interactive system that instantly transforms raw price data into meaningful statistical levels. With a single click, it calculates and displays mean, deviation, percentiles, and more, turning advanced analytics into clear on-chart signals. It highlights the zones where price is most likely to bounce, retrace, or break, making analysis both faster and more practical.

How to build and optimize a cycle-based trading system (Detrended Price Oscillator - DPO)
This article explains how to design and optimise a trading system using the Detrended Price Oscillator (DPO) in MQL5. It outlines the indicator's core logic, demonstrating how it identifies short-term cycles by filtering out long-term trends. Through a series of step-by-step examples and simple strategies, readers will learn how to code it, define entry and exit signals, and conduct backtesting. Finally, the article presents practical optimization methods to enhance performance and adapt the system to changing market conditions.

Automating The Market Sentiment Indicator
In this article, we automate a custom market sentiment indicator that classifies market conditions into bullish, bearish, risk-on, risk-off, and neutral. The Expert Advisor delivers real-time insights into prevailing sentiment while streamlining the analysis process for current market trends or direction.
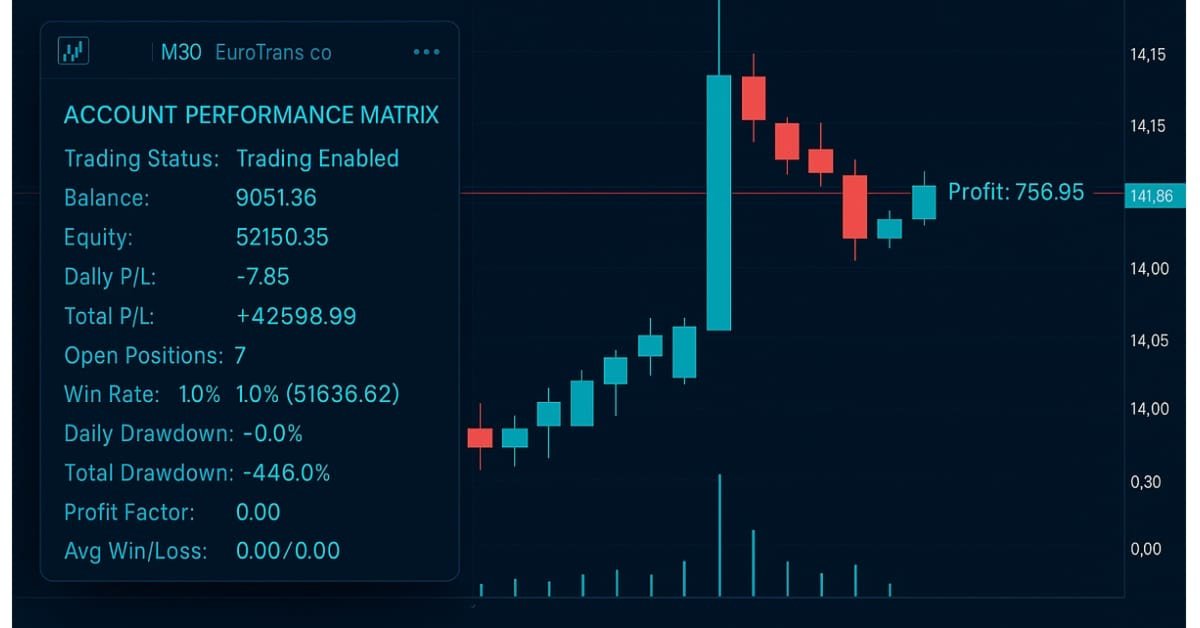
Developing A Custom Account Performance Matrix Indicator
This indicator acts as a discipline enforcer by tracking account equity, profit/loss, and drawdown in real-time while displaying a performance dashboard. It can help traders stay consistent, avoid overtrading, and comply with prop-firm challenge rules.

The Parafrac V2 Oscillator: Integrating Parabolic SAR with Average True Range
The Parafrac V2 Oscillator is an advanced technical analysis tool that integrates the Parabolic SAR with the Average True Range (ATR) to overcome limitations of its predecessor, which relied on fractals and was prone to signal spikes overshadowing previous and current signals. By leveraging ATR’s volatility measure, the version 2 offers a smoother, more reliable method for detecting trends, reversals, and divergences, helping traders reduce chart congestion and analysis paralysis.