Learn how to design a trading system by Fibonacci

Introduction
In this new article from our series about learning how to design a trading system based on the most popular technical analysis tools and indicators, we will learn how to create a trading system based on the Fibonacci Retracement technical tool which is one of the most popular and widely used in trading. After that, we can use this trading system on our MetaTrader 5 trading terminal. We will use the MQL5 (MetaQuotes Language 5) which is the built-in IDE with the MetaTrader 5 and if you want to learn how to download and use the MetaTrader 5 and MQL5 IDE, you can read this topic Writing MQL5 code in MetaEditor from a previous article.
To cover that, the Topics will be the same as the following:
- Fibonacci definition
- Fibonacci strategy
- Fibonacci strategy blueprint
- Fibonacci trading system
- Conclusion
It is good to mention that it will be better to use this Fibonacci accompanied by other technical tools like trend analysis, support, resistance,..etc. as it will give better insights and results. You must also test any learned strategy or tool from this article or anywhere before using it in the real world to make sure that it will be useful and profitable for your trading. It will be better for you as a programming skills developer to apply and try to code what you read by yourself as this step is very beneficial for you.
Fibonacci definition
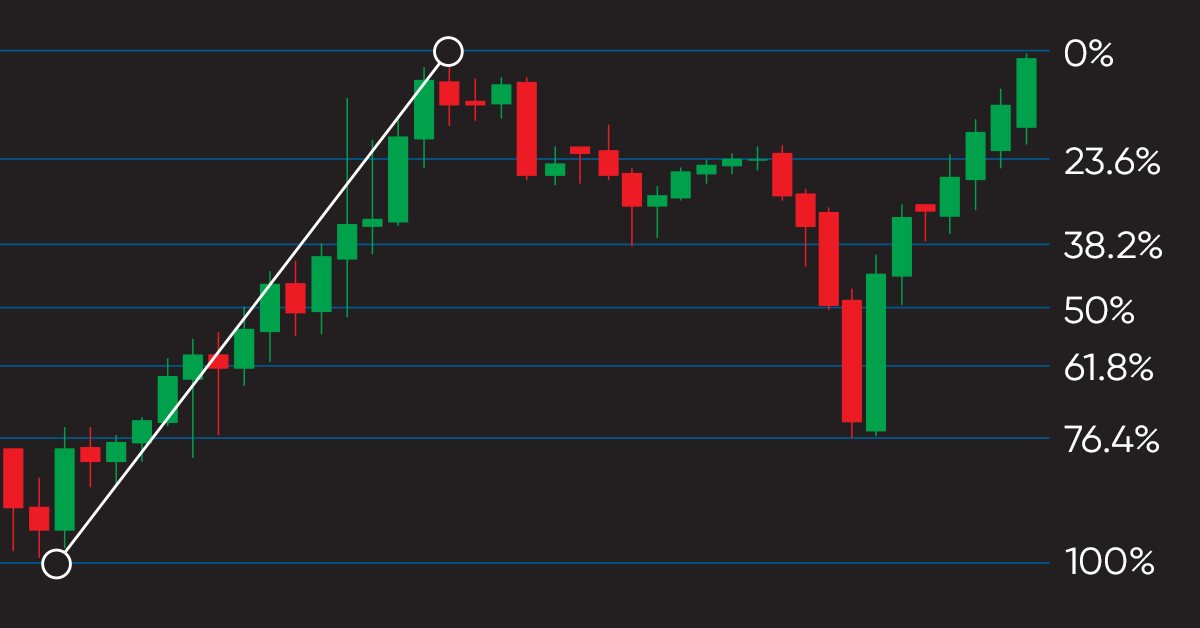
In this section, we will identify the Fibonacci Retracement tool and we will learn how we can use it on our chart. The Fibo is a technical tool that can be used to find areas of support or resistance on the chart and we expect a bounce from these areas. It is based on the Fibonacci sequence which is a mathematical series of numbers. each number of this series is the summation of the two previous numbers. we can find it on the chart drawn as horizontal lines at specific levels like 23.6%, 38.2%, 50%, and 61.8% and these levels are the most popular ones.
If you ask yourself how you can find it on the chart the answer will be that all you need to do is to insert it from the available technical tools in the MetaTrader 5 and the following is for steps of that:
While opening the MetaTrader 5 navigate the Insert tab --> Objects --> Fibonacci Retracement

After that, if we have a retracement after the uptrend we draw it from low to high and vice versa, if we have a retracement after the downtrend we draw it from high to low the same as the following examples.
FIBO after uptrend:

FIBO after downtrend:

As we can see in previous examples we have a trendline is drawn between two points the highest and lowest values in addition to horizontal lines with specific levels 23.6, 38.2, 50, and 61.8 and these levels are the most popular ones. Around these levels and after an uptrend or downtrend, we experience corrections or retracements and we may expect a rebound from these levels after the correction. So, FIBO levels may act as support or resistance levels.
We can also control these levels through the window of this tool by right-clicking on the drawing tool or right-clicking on the chart after that selecting Object List from the menu then selecting the Fibo object and the window will open the same as the following:

We can control from the previous common tab the name of the object and its style of it like color, line types, and thickness.

As we can see in the previous picture, we can control and determine desired levels settings, and style also.

As we can see in the parameters tab we can determine the date, time, and value that we want to start from in addition to the date, time, and value to end with for the Fibonacci object.
Fibonacci strategy
In this part, we will learn how to use Fibonacci retracement through simple strategies based on two different approaches. One of them is to determine the FIBO levels based on the daily last candle and the second one is to determine the number of candles in any time frame and determine the FIBO levels based on them. Then we will use another strategy to get a specific buy or sell signal based on a specific predetermined FIBO level for each approach and the following are more details about these strategies.
The first approach: Using Daily Data:
Simple FIBO System:
Based on this strategy we need to get FIBO retracement price levels based on the daily candle data and status. if the last daily candle is bullish we need to get bullish FIBO from the low to high of the candle and price levels of each level. if the last daily candle is bearish we need to get a red bearish FIBO from the high to the low of this candle and the price levels of this FIBO.
Simply,
Last day close > open ==> bullish candle
Getting green FIBO levels and prices of these levels.
Last day close < open ==> bearish candle
Getting a red FIBO levels and prices of these levels.
FIBO Signals:
Based on this strategy we need to get buy and sell entries based on what we determine as a bullish or bearish FIBO level. If we have determined a level of 38.2 of bullish FIBO, we need to get the price level of this level as a buy entry and if we determine the same level of bearish FIBO, we need to get the price of this level as a sell entry.
The second approach: Using array of specific candles:
Simple FIBO System 2:
Based on this strategy we need to get FIBO price levels based on an array of candles, if we have a bullish FIBO based on the direction of the array we need to get FIBO price levels, and if we have a bearish FIBO based on the direction of the array we need to get its price FIBO levels.
Simply,
If the open of the first candle in the array < the close of the last candle of the same array ==> bullish FIBO, we need to get the price levels of this bullish FIBO.
If open of the first candle in the array > the close of the last candle of the same array ==> bearish FIBO, we need to get price levels of this bearish FIBO.
FIBO Signals 2:
Based on this strategy we need to get the buy or sell entries based on the user input of the desired FIBO level to be entry-level. If we have a bullish FIBO based on what we described before based on this approach, we need to get a buy entry level of a specific FIBO level. If we have a bearish FIBO, we need to get a sell entry level of a specific FIBO level.
Fibonacci strategy blueprint
In this part, we will see blueprints of every mentioned strategy of the two mentioned approaches to understand what we need to do in a visual method.
The First approach: Using Daily Data:
As we mentioned here we will use the daily last candle and determine its open, close, high, and low. By comparing the open and the close we can detect if we have a bullish or bearish candle. Based on the movement type of this last daily candle, we will draw the Fibonacci object and get desired signals.
Simple FIBO System:

FIBO Signals:

The second approach: Using Array of specific candles:
As we mentioned here we will use a specific number of candles in an array and determine the opening value of the first candle, the closing value of the last candle, the highest value, and the lowest value. By comparing the open and the close we can detect if we have a bullish or bearish candle. Based on the movement type of this array, we will draw the Fibonacci object and get desired signals.
Simple FIBO System 2:

FIBO Signals 2:

Fibonacci trading system
In this part, we will learn how to create a trading system based on mentioned before. We will create a program that can return Fibonacci levels on the chart as a comment. We will use two approaches the first one is to use the last daily data to draw our Fibonacci levels based on it and the other approach is to use a predetermined number of candles to use it as an array for that. We will also learn how to use these two approaches to return signals of buy and sell based on Fibonacci, let us see that in detail.
The first approach: Using Daily Data:
Simple FIBO System:
According to this strategy, we will use daily data to be used for the Fibonacci system and the following are steps to do that:
Defining the needed object name by using the Macro substitution (#define) to preprocess the source code before compiling.
#define FIB_OBJ "Fibonacci Retracement"
Creating an integer variable for barsTotal.
int barsTotal; After that in the onTick, we will create an integer variable for bars with the assignment of the iBar function to return the number of available historical bars of the symbol. Its parameters are:
- symbol: to determine the desired symbol, we will use _Symbol for the current one.
- timeframe: to determine the period, we will use D1 for the daily chart.
int bars = iBars(_Symbol, PERIOD_D1);
Issuing a condition to detect the daily candle that we need to use it for our Fibonacci as we need barsTotal to be not equal to bars by using the (!=) operator and at the same time we need the current time will be greater than ending time of this daily candle. so, we will use the TimeCurrent function and StringToTime function to transform a string containing time into a datetime-type number.
if(barsTotal != bars && TimeCurrent() > StringToTime("00:05"))
Once this condition is true, we need the program to do the following:
Assign the bars to barsTotal.
barsTotal=bars;
Delete any FIB_OBJ on the chart by using the ObjectDelete function and its parameters are:
- chart_id: to determine the chart identifier, we will use (0) which means the current chart.
- name: to determine the object name which is (FIB_OBJ).
ObjectDelete(0,FIB_OBJ);
Create four variables of prices (open, close, high, and low) by using iOpen, iClose, iHigh, and iLow functions to return the price of the daily bar. their parameters are:
- symbol: to determine the desired symbol, we will use _Symbol to be used for the current symbol.
- timeframe: to determine the desired time frame, we will use (PERIOD_D1) to be used for the daily time frame.
- shift: to determine the index of received value from the timeseries, we will not use it here.
      double open = iOpen(_Symbol,PERIOD_D1,1);
      double close = iClose(_Symbol,PERIOD_D1,1);
      double high = iHigh(_Symbol,PERIOD_D1,1);
      double low = iLow(_Symbol,PERIOD_D1,1);
Determine the starting time and the ending time to be used later for drawing our Fibonacci object. We will use the iTime function which returns the opening time of the bar. Its parameters are:
- symbol: to determine the desired symbol, we will use _Symbol to be used for the current symbol.
- timeframe: to determine the desired time frame, we will use (PERIOD_D1) to be used for the daily time frame.
- shift: to determine the index of received value from the timeseries, we will use 1 for the starting time and 0 for the ending time.
For the ending time, we will subtract 1 from the return value as it will be during the new day which will be the current daily bar at the time of this calculation, so, we do that to detect the previous meaning bar.
      datetime startingTime = iTime(_Symbol,PERIOD_D1,1);
      datetime endingTime = iTime(_Symbol,PERIOD_D1,0)-1;
After that, we will set two conditions by using the if-else conditional operator to draw the Fibonacci object:
In case of close is greater than the open, so, it is a bullish candle and the following will occur.
Create the object by using the ObjectCreate function to draw the object with specified characters. Its parameters are:
- chart_id: to determine the chart, we will use 0 for the current one.
- name: to determine the name of the desired object, we will use FIB_OBJ.
- type: to determine the object type, we will use OBJ_FIBO for the Fibonacci retracement.
- nwin: to determine the window index, we will use 0 for the main window
- time1: to determine the time of the first point, we will use the starting time.
- price1: to determine the price of the first point, we will use the low.
- timeN=0: to determine the time of the last point, we will use the ending time.
- priceN=0: to determine the price of the last point, we will use the high.
Updating the color of the object to fit the direction of the bar by using the ObjectSetInteger and for loop operator. Parameters of ObjectSetInteger are:
- chart_id: to determine the chart, we will use 0 for the current one.
- name: to determine the name of the object, we will use FIB_OBJ.
- prop_id: to determine the property id (color), we will use OBJPROP_COLOR.
- prop_value: to determine the property value, we will use clrGreen.
- Using the for loop to continuously update the object color.
      if(close>open)
        {
         ObjectCreate(0,FIB_OBJ,OBJ_FIBO,0,startingTime,low,endingTime,high);
         ObjectSetInteger(0,FIB_OBJ,OBJPROP_COLOR,clrGreen);
         for(int i = 0; i < ObjectGetInteger(0,FIB_OBJ,OBJPROP_LEVELS); i++)
           {
            ObjectSetInteger(0,FIB_OBJ,OBJPROP_LEVELCOLOR,i,clrGreen);
           }
         double fibRetracLvl1 = NormalizeDouble(high - (high-low) * 23.6 / 100,_Digits);
         double fibRetracLvl2 = NormalizeDouble(high - (high-low) * 38.2 / 100,_Digits);
         double fibRetracLvl3 = NormalizeDouble(high - (high-low) * 50 / 100,_Digits);
         double fibRetracLvl4 = NormalizeDouble(high - (high-low) * 61.8 / 100,_Digits);
         double fibRetracLvl5 = NormalizeDouble(high - (high-low) * 100 / 100,_Digits);
         Comment("Last Day Open = ",open,"\n",
                 "Last Day Close = ",close,"\n",
                 "Fib lvl 0% = ",high,"\n",
                 "Fib lvl 23.6% = ",fibRetracLvl1,"\n",
                 "Fib lvl 38.2% = ",fibRetracLvl2,"\n",
                 "Fib lvl 50% = ",fibRetracLvl3,"\n",
                 "Fib lvl 61.8% = ",fibRetracLvl4,"\n",
                 "Fib lvl 100% = ",fibRetracLvl5);
        }
In the case of a bearish day the same will occur but the difference will be the same as the following:
- Creating the object and starting from the high to the low.
- The color of the object will be red.
      else
        {
         ObjectCreate(0,FIB_OBJ,OBJ_FIBO,0,startingTime,high,endingTime,low);
         ObjectSetInteger(0,FIB_OBJ,OBJPROP_COLOR,clrRed);
         for(int i = 0; i < ObjectGetInteger(0,FIB_OBJ,OBJPROP_LEVELS); i++)
           {
            ObjectSetInteger(0,FIB_OBJ,OBJPROP_LEVELCOLOR,i,clrRed);
           }
         double fibRetracLvl1 = NormalizeDouble(low + (high-low) * 23.6 / 100,_Digits);
         double fibRetracLvl2 = NormalizeDouble(low + (high-low) * 38.2 / 100,_Digits);
         double fibRetracLvl3 = NormalizeDouble(low + (high-low) * 50 / 100,_Digits);
         double fibRetracLvl4 = NormalizeDouble(low + (high-low) * 61.8 / 100,_Digits);
         double fibRetracLvl5 = NormalizeDouble(low + (high-low) * 100 / 100,_Digits);
         Comment("Last Day Open = ",open,"\n",
                 "Last Day Close = ",close,"\n",
                 "Fib lvl 0% = ",low,"\n",
                 "Fib lvl 23.6% = ",fibRetracLvl1,"\n",
                 "Fib lvl 38.2% = ",fibRetracLvl2,"\n",
                 "Fib lvl 50% = ",fibRetracLvl3,"\n",
                 "Fib lvl 61.8% = ",fibRetracLvl4,"\n",
                 "Fib lvl 100% = ",fibRetracLvl5);
        }
The following is the full code of this strategy:
//+------------------------------------------------------------------+
//|                                         Simple Fibo System#2.mq5 |
//|                                  Copyright 2023, MetaQuotes Ltd. |
//|                                             https://www.mql5.com |
//+------------------------------------------------------------------+
#property copyright "Copyright 2023, MetaQuotes Ltd."
#property link      "https://www.mql5.com"
#property version   "1.00"
#define FIB_OBJ "Fibonacci Retracement"
#property script_show_inputs
input double fibRetracLvl = 38.2;
int barsTotal;
//+------------------------------------------------------------------+
void OnTick()
  {

   int bars = iBars(_Symbol, PERIOD_D1);
   if(barsTotal != bars  && TimeCurrent() > StringToTime("00:05"))
     {
      barsTotal=bars;
      ObjectDelete(0,FIB_OBJ);
      double open = iOpen(_Symbol,PERIOD_D1,1);
      double close = iClose(_Symbol,PERIOD_D1,1);
      double closeCandle = iClose(_Symbol,_Period,1);
      double high = iHigh(_Symbol,PERIOD_D1,1);
      double low = iLow(_Symbol,PERIOD_D1,1);
      datetime startingTime = iTime(_Symbol,PERIOD_D1,1);
      datetime endingTime = iTime(_Symbol,PERIOD_D1,0)-1;
      if(close>open)
        {
         ObjectCreate(0,FIB_OBJ,OBJ_FIBO,0,startingTime,low,endingTime,high);
         ObjectSetInteger(0,FIB_OBJ,OBJPROP_COLOR,clrGreen);
         for(int i = 0; i < ObjectGetInteger(0,FIB_OBJ,OBJPROP_LEVELS); i++)
           {
            ObjectSetInteger(0,FIB_OBJ,OBJPROP_LEVELCOLOR,i,clrGreen);
           }
         double fibRetracLvl1 = NormalizeDouble(high - (high-low) * 23.6 / 100,_Digits);
         double fibRetracLvl2 = NormalizeDouble(high - (high-low) * 38.2 / 100,_Digits);
         double fibRetracLvl3 = NormalizeDouble(high - (high-low) * 50 / 100,_Digits);
         double fibRetracLvl4 = NormalizeDouble(high - (high-low) * 61.8 / 100,_Digits);
         double fibRetracLvl5 = NormalizeDouble(high - (high-low) * 100 / 100,_Digits);
         double entryLvl = NormalizeDouble(high - (high-low) * fibRetracLvl /100,_Digits);
         Comment("Last Day Open = ",open,"\n",
                 "Last Day Close = ",close,"\n",
                 "Buy Entry Price: ",entryLvl,"\n",
                 "Close: ",closeCandle,"\n");
        }
      else
        {
         ObjectCreate(0,FIB_OBJ,OBJ_FIBO,0,startingTime,high,endingTime,low);
         ObjectSetInteger(0,FIB_OBJ,OBJPROP_COLOR,clrRed);
         for(int i = 0; i < ObjectGetInteger(0,FIB_OBJ,OBJPROP_LEVELS); i++)
           {
            ObjectSetInteger(0,FIB_OBJ,OBJPROP_LEVELCOLOR,i,clrRed);
           }
         double fibRetracLvl1 = NormalizeDouble(low + (high-low) * 23.6 / 100,_Digits);
         double fibRetracLvl2 = NormalizeDouble(low + (high-low) * 38.2 / 100,_Digits);
         double fibRetracLvl3 = NormalizeDouble(low + (high-low) * 50 / 100,_Digits);
         double fibRetracLvl4 = NormalizeDouble(low + (high-low) * 61.8 / 100,_Digits);
         double fibRetracLvl5 = NormalizeDouble(low + (high-low) * 100 / 100,_Digits);
         double entryLvl = NormalizeDouble(low + (high-low) * fibRetracLvl /100,_Digits);
           {
            Comment("Last Day Open = ",open,"\n",
                    "Last Day Close = ",close,"\n",
                    "Sell Entry Price: ",entryLvl,"\n",
                    "Close: ",closeCandle);
           }
        }
     }
  }
//+------------------------------------------------------------------+
The following is the full code of this trading system:
//+------------------------------------------------------------------+
//|                                         Simple Fibo System#1.mq5 |
//|                                  Copyright 2023, MetaQuotes Ltd. |
//|                                             https://www.mql5.com |
//+------------------------------------------------------------------+
#property copyright "Copyright 2023, MetaQuotes Ltd."
#property link      "https://www.mql5.com"
#property version   "1.00"
#define FIB_OBJ "Fibonacci Retracement"
int barsTotal;
//+------------------------------------------------------------------+
void OnTick()
  {
   int bars = iBars(_Symbol, PERIOD_D1);
   if(barsTotal != bars  && TimeCurrent() > StringToTime("00:05"))
     {
      barsTotal=bars;
      ObjectDelete(0,FIB_OBJ);
      double open = iOpen(_Symbol,PERIOD_D1,1);
      double close = iClose(_Symbol,PERIOD_D1,1);
      double high = iHigh(_Symbol,PERIOD_D1,1);
      double low = iLow(_Symbol,PERIOD_D1,1);
      datetime startingTime = iTime(_Symbol,PERIOD_D1,1);
      datetime endingTime = iTime(_Symbol,PERIOD_D1,0)-1;
      if(close>open)
        {
         ObjectCreate(0,FIB_OBJ,OBJ_FIBO,0,startingTime,low,endingTime,high);
         ObjectSetInteger(0,FIB_OBJ,OBJPROP_COLOR,clrGreen);
         for(int i = 0; i < ObjectGetInteger(0,FIB_OBJ,OBJPROP_LEVELS); i++)
           {
            ObjectSetInteger(0,FIB_OBJ,OBJPROP_LEVELCOLOR,i,clrGreen);
           }
         double fibRetracLvl1 = NormalizeDouble(high - (high-low) * 23.6 / 100,_Digits);
         double fibRetracLvl2 = NormalizeDouble(high - (high-low) * 38.2 / 100,_Digits);
         double fibRetracLvl3 = NormalizeDouble(high - (high-low) * 50 / 100,_Digits);
         double fibRetracLvl4 = NormalizeDouble(high - (high-low) * 61.8 / 100,_Digits);
         double fibRetracLvl5 = NormalizeDouble(high - (high-low) * 100 / 100,_Digits);
         Comment("Last Day Open = ",open,"\n",
                 "Last Day Close = ",close,"\n",
                 "Fib lvl 0% = ",high,"\n",
                 "Fib lvl 23.6% = ",fibRetracLvl1,"\n",
                 "Fib lvl 38.2% = ",fibRetracLvl2,"\n",
                 "Fib lvl 50% = ",fibRetracLvl3,"\n",
                 "Fib lvl 61.8% = ",fibRetracLvl4,"\n",
                 "Fib lvl 100% = ",fibRetracLvl5);
        }
      else
        {
         ObjectCreate(0,FIB_OBJ,OBJ_FIBO,0,startingTime,high,endingTime,low);
         ObjectSetInteger(0,FIB_OBJ,OBJPROP_COLOR,clrRed);
         for(int i = 0; i < ObjectGetInteger(0,FIB_OBJ,OBJPROP_LEVELS); i++)
           {
            ObjectSetInteger(0,FIB_OBJ,OBJPROP_LEVELCOLOR,i,clrRed);
           }
         double fibRetracLvl1 = NormalizeDouble(low + (high-low) * 23.6 / 100,_Digits);
         double fibRetracLvl2 = NormalizeDouble(low + (high-low) * 38.2 / 100,_Digits);
         double fibRetracLvl3 = NormalizeDouble(low + (high-low) * 50 / 100,_Digits);
         double fibRetracLvl4 = NormalizeDouble(low + (high-low) * 61.8 / 100,_Digits);
         double fibRetracLvl5 = NormalizeDouble(low + (high-low) * 100 / 100,_Digits);
         Comment("Last Day Open = ",open,"\n",
                 "Last Day Close = ",close,"\n",
                 "Fib lvl 0% = ",low,"\n",
                 "Fib lvl 23.6% = ",fibRetracLvl1,"\n",
                 "Fib lvl 38.2% = ",fibRetracLvl2,"\n",
                 "Fib lvl 50% = ",fibRetracLvl3,"\n",
                 "Fib lvl 61.8% = ",fibRetracLvl4,"\n",
                 "Fib lvl 100% = ",fibRetracLvl5);
        }
     }
  }
//+------------------------------------------------------------------+
After compiling this code without errors and executing it, we can find its signals the same as the following examples from testing for bullish and bearish cases.
The daily candle is bullish:

So, we are supposed to find the FIBO is drawn from low to high, its color is green, and FIBO levels and the day open and close the same as we found on the daily. The following picture is for that.

As we can see in the previous picture and according to the daily bullish bar, the FIBO is drawn from low to high and its color is green in addition to that we need a comment on the chart with the following values:
- Last day open ==> is the same as in the daily chart data window.
- Last day close ==> it is the same as the daily chart.
- Five Fibonacci retracement price levels.
The daily candle is bearish:

So, we are supposed to find the FIBO is drawn from high to low, its color is red, and FIBO levels and the day open and close the same as we found on the daily. The following picture is for that.

As we can see in the previous picture and according to the daily bearish bar, the FIBO is drawn from high to low and its color is red in addition to that we have a comment on the chart with the following values:
- The last day open ==> is the same as in the daily chart data window.
- The last day close ==> is the same as the daily chart.
- Five Fibonacci retracement price levels.
FIBO Signals:
According to this approach, we need to create a trading system that can return buying and selling signals based on the user input of entry-level based on the FIBO levels. The following is the full code to do that:
//+------------------------------------------------------------------+
//|                                         Simple Fibo System#2.mq5 |
//|                                  Copyright 2023, MetaQuotes Ltd. |
//|                                             https://www.mql5.com |
//+------------------------------------------------------------------+
#property copyright "Copyright 2023, MetaQuotes Ltd."
#property link      "https://www.mql5.com"
#property version   "1.00"
#define FIB_OBJ "Fibonacci Retracement"
#property script_show_inputs
input double fibRetracLvl = 38.2;
int barsTotal;
//+------------------------------------------------------------------+
void OnTick()
  {

   int bars = iBars(_Symbol, PERIOD_D1);
   if(barsTotal != bars  && TimeCurrent() > StringToTime("00:05"))
     {
      barsTotal=bars;
      ObjectDelete(0,FIB_OBJ);
      double open = iOpen(_Symbol,PERIOD_D1,1);
      double close = iClose(_Symbol,PERIOD_D1,1);
      double closeCandle = iClose(_Symbol,_Period,1);
      double high = iHigh(_Symbol,PERIOD_D1,1);
      double low = iLow(_Symbol,PERIOD_D1,1);
      datetime startingTime = iTime(_Symbol,PERIOD_D1,1);
      datetime endingTime = iTime(_Symbol,PERIOD_D1,0)-1;
      if(close>open)
        {
         ObjectCreate(0,FIB_OBJ,OBJ_FIBO,0,startingTime,low,endingTime,high);
         ObjectSetInteger(0,FIB_OBJ,OBJPROP_COLOR,clrGreen);
         for(int i = 0; i < ObjectGetInteger(0,FIB_OBJ,OBJPROP_LEVELS); i++)
           {
            ObjectSetInteger(0,FIB_OBJ,OBJPROP_LEVELCOLOR,i,clrGreen);
           }
         double fibRetracLvl1 = NormalizeDouble(high - (high-low) * 23.6 / 100,_Digits);
         double fibRetracLvl2 = NormalizeDouble(high - (high-low) * 38.2 / 100,_Digits);
         double fibRetracLvl3 = NormalizeDouble(high - (high-low) * 50 / 100,_Digits);
         double fibRetracLvl4 = NormalizeDouble(high - (high-low) * 61.8 / 100,_Digits);
         double fibRetracLvl5 = NormalizeDouble(high - (high-low) * 100 / 100,_Digits);
         double entryLvl = NormalizeDouble(high - (high-low) * fibRetracLvl /100,_Digits);
         Comment("Last Day Open = ",open,"\n",
                 "Last Day Close = ",close,"\n",
                 "Buy Entry Price: ",entryLvl);
        }
      else
        {
         ObjectCreate(0,FIB_OBJ,OBJ_FIBO,0,startingTime,high,endingTime,low);
         ObjectSetInteger(0,FIB_OBJ,OBJPROP_COLOR,clrRed);
         for(int i = 0; i < ObjectGetInteger(0,FIB_OBJ,OBJPROP_LEVELS); i++)
           {
            ObjectSetInteger(0,FIB_OBJ,OBJPROP_LEVELCOLOR,i,clrRed);
           }
         double fibRetracLvl1 = NormalizeDouble(low + (high-low) * 23.6 / 100,_Digits);
         double fibRetracLvl2 = NormalizeDouble(low + (high-low) * 38.2 / 100,_Digits);
         double fibRetracLvl3 = NormalizeDouble(low + (high-low) * 50 / 100,_Digits);
         double fibRetracLvl4 = NormalizeDouble(low + (high-low) * 61.8 / 100,_Digits);
         double fibRetracLvl5 = NormalizeDouble(low + (high-low) * 100 / 100,_Digits);
         double entryLvl = NormalizeDouble(low + (high-low) * fibRetracLvl /100,_Digits);
           {
            Comment("Last Day Open = ",open,"\n",
                    "Last Day Close = ",close,"\n",
                    "Sell Entry Price: ",entryLvl);
           }
        }
     }
  }
//+------------------------------------------------------------------+
Differences in this code:
Adding a property to show the user input window by using #property script_show_inputs that displays a window with the properties.
#property script_show_inputs
Using input variable to create a double data type for fibRetracLvl with a default value of 38.2.
input double fibRetracLvl = 38.2;
Defining the entry level based on the user input in the case of bullish.
double entryLvl = NormalizeDouble(high - (high-low) * fibRetracLvl /100,_Digits);
Defining the entry level based on the user input in the case of bearish.
double entryLvl = NormalizeDouble(low + (high-low) * fibRetracLvl /100,_Digits);
Comment on the chart in the case bullish.
         Comment("Last Day Open = ",open,"\n",
                 "Last Day Close = ",close,"\n",
                 "Buy Entry Price: ",entryLvl,"\n",
                 "Close: ",closeCandle,"\n");
Comment on the chart in the case of bearish.
            Comment("Last Day Open = ",open,"\n",
                    "Last Day Close = ",close,"\n",
                    "Sell Entry Price: ",entryLvl,"\n",
                    "Close: ",closeCandle);
After compiling this code and executing it, we will be ready to receive signals and we will see examples from testing for the bullish and bearish cases.
The daily candle is bullish:

So, we are supposed to see the drawn green FIBO starting from low to high in 15 min, the last day open and close are the same as the daily chart, and the entry level is the same price level next to the 38.2. The following for the 15 min chart:

As we can see in the previous 15 min chart we have the following values the same as we determined:
- Last day open ==> is the same as the daily chart.
- Last day close ==> is the same also.
- Buy entry price ==> is the same price level next to the 38.2 FIBO level.
The daily candle is bearish:

So, Now we will check out the 15 min chart to get our signal based on the trading strategy, it is supposed to show a sell entry level based on the FIBO level 38.2. Let us check that through the following picture:

As we can see we have the following values as a signal on the 15 min chart:
- Last day open ==> is the same as the daily chart.
- Last day close ==> is the same also.
- sell entry price ==> is the same level next to the 38.2 FIBO level.
The second approach: Using array of specific candles:
Simple FIBO System 2:
According to this approach, we will use a predetermined number of candles to be used for Fibonacci creation, the following is for steps to do that differently:
Defining the FIB_OBJ by using the #define.
#define FIB_OBJ "Fibonacci Retracement"
Creating two integer variables for the highest and lowest candles.
int highestCandle, lowestCandle; Creating two arrays for high and low.
double high[],low[]; Sorting data in high and low arrays by using the "ArraySetAsSeries" function. Its parameters:
- array[]: to determine the created arrays high and low.
- flag: Array indexing direction, which will be true.
ArraySetAsSeries(high,true);
ArraySetAsSeries(low,true);
Getting the historical data of the highest and lowest by using CopyHigh and CopyLow. CopyHigh parameters are:
- symbol_name: we will (_Symbol) for the current symbol.
- timeframe: we will use (_Period) for the current one.
- start_pos: to determine the starting position, we will use 0 for the current candle.
- count: to determine the data count to copy, we will use 100.
- high_array[]: to determine the target array, we will use created high array.
For the CopyLow parameters will be the same but the target array will be created low array.
CopyHigh(_Symbol,_Period,0,100,high);
CopyLow(_Symbol,_Period,0,100,low);
Defining the opening price of the first candle in the array, and the closing price of the last candle in the array by using the iOpen and iClose functions.
double openCandle = iOpen(_Symbol,_Period,100);
double closeCandle = iClose(_Symbol,_Period,1);
Defining the highest and lowest value in created high and low arrays by using ArrayMaximum and ArrayMinimum candles. Parameters are:
- array[]: we will use high for maximum value and low minimum value.
- start=0: to determine the index to start checking with, we will use 0.
- count: to determine the number of elements to check, we will use 100 or we can use also WHOLE_ARRAY.
highestCandle=ArrayMaximum(high,0,100);
lowestCandle=ArrayMinimum(low,0,100);
Creating an array for the price by using the MqlRates function to store information about prices and sorting data in this array by using the ArraySetAsSeries function.
MqlRates pArray[];
ArraySetAsSeries(pArray,true);
Getting historical data from MqlRates by the function of CopyRates and its parameters are:
- symbol_name: to determine the symbol name, we'll use (_Symbol) to be applied for the current symbol.
- timeframe: to determine the timeframe ad we will use the (_Period) to be applied for the current time frame.
- start_pos: to determine the starting point or position, we'll use (0) to start from the current position.
- count: to determine the count to copy, we'll use (Bars).
- rates_array[]: to determine the target of the array to copy, we'll use (pArray).
int pData=CopyRates(_Symbol,_Period,0,Bars(_Symbol,_Period),pArray);
Defining dateTime and the price of the zero level and the 100 levels by using the ObjectGetInteger and ObjectGetDouble
datetime dTlvl0 = ObjectGetInteger(0,"Fibonacci Retracement",OBJPROP_TIME,0);
double PriceFibLvl00 = ObjectGetDouble(0,"Fibonacci Retracement",OBJPROP_PRICE,0);
datetime dTlvl1 = ObjectGetInteger(0,"Fibonacci Retracement",OBJPROP_TIME,1);
double PriceFibLvl0 = ObjectGetDouble(0,"Fibonacci Retracement",OBJPROP_PRICE,1);
Setting conditions of bullish and bearish cases by using the if-else operator.
In the case of bullish (CloseCandle is greater than openCandle), we need the following steps to occur:
- Delete the previously drawn FIBO object by using ObjectDelete.
- Creating a new FIBO object starting from the low to the high of the array by using ObjectCreate.
- Updating the color of the FIBO object to green color by using ObjectSetInteger and for loop for continuation updating as per the case.
- Defining price range by getting the difference between high and low.
- Defining FIBO levels, 23.6 - 38.2 - 50 - 61.8.
- Comment on the chart with Array Open, Array Close, and FIBO levels.
   if(closeCandle>openCandle)
     {
      ObjectDelete(_Symbol, "Fibonacci Retracement");
      ObjectCreate(_Symbol, "Fibonacci Retracement",OBJ_FIBO,0,pArray[100].time,
                   pArray[lowestCandle].low,pArray[0].time,pArray[highestCandle].high);
      ObjectSetInteger(0,FIB_OBJ,OBJPROP_COLOR,clrGreen);
      for(int i = 0; i < ObjectGetInteger(0,FIB_OBJ,OBJPROP_LEVELS); i++)
        {
         ObjectSetInteger(0,FIB_OBJ,OBJPROP_LEVELCOLOR,i,clrGreen);
        }
      double pRange =  PriceFibLvl0 - PriceFibLvl00;
      double PriceFibLvl1 = NormalizeDouble (PriceFibLvl0 - pRange * 23.6/100,_Digits);
      double PriceFibLvl2 = NormalizeDouble (PriceFibLvl0 - pRange * 38.2/100,_Digits);
      double PriceFibLvl3 = NormalizeDouble (PriceFibLvl0 - pRange * 50/100,_Digits);
      double PriceFibLvl4 = NormalizeDouble(PriceFibLvl0 - pRange * 61.8/100,_Digits);
      Comment("Array Open: ",openCandle,"\n",
              "Array Close: ",closeCandle,"\n",
              "Fib lvl 0% = ",PriceFibLvl0,"\n",
              "Fib lvl 23.6% = ",PriceFibLvl1,"\n",
              "Fib lvl 38.2% = ",PriceFibLvl2,"\n",
              "Fib lvl 50% = ",PriceFibLvl3,"\n",
              "Fib lvl 61.8% = ",PriceFibLvl4,"\n",
              "Fib lvl 100% = ",PriceFibLvl00);
     }
In the case of bearish (CloseCandle is lower than openCandle), we need the following steps to occur:
- Delete the previously drawn FIBO object by using ObjectDelete.
- Creating a new FIBO object starting from the high to the low of the array by using ObjectCreate.
- Updating the color of the FIBO object to red color by using ObjectSetInteger and for loop for continuation updating as per the case.
- Defining price range by getting the difference between low and high.
- Defining FIBO levels, 23.6 - 38.2 - 50 - 61.8.
- Comment on the chart with Array Open, Array Close, and FIBO levels.
   else
     {
      ObjectDelete(_Symbol, "Fibonacci Retracement");
      ObjectCreate(_Symbol, "Fibonacci Retracement",OBJ_FIBO,0,pArray[100].time,
                   pArray[highestCandle].high,pArray[0].time,pArray[lowestCandle].low);
      ObjectSetInteger(0,FIB_OBJ,OBJPROP_COLOR,clrRed);
      for(int i = 0; i < ObjectGetInteger(0,FIB_OBJ,OBJPROP_LEVELS); i++)
        {
         ObjectSetInteger(0,FIB_OBJ,OBJPROP_LEVELCOLOR,i,clrRed);
        }
      double pRange =  PriceFibLvl00 - PriceFibLvl0;
      double PriceFibLvl1 = NormalizeDouble (PriceFibLvl0 + pRange * 23.6/100,_Digits);
      double PriceFibLvl2 = NormalizeDouble (PriceFibLvl0 + pRange * 38.2/100,_Digits);
      double PriceFibLvl3 = NormalizeDouble(PriceFibLvl0 + pRange * 50/100,_Digits);
      double PriceFibLvl4 = NormalizeDouble (PriceFibLvl0 + pRange * 61.8/100,_Digits);
      Comment("Array Open: ",openCandle,"\n",
              "Array Close: ",closeCandle,"\n",
              "Fib lvl 0% = ",PriceFibLvl0,"\n",
              "Fib lvl 23.6% = ",PriceFibLvl1,"\n",
              "Fib lvl 38.2% = ",PriceFibLvl2,"\n",
              "Fib lvl 50% = ",PriceFibLvl3,"\n",
              "Fib lvl 61.8% = ",PriceFibLvl4,"\n",
              "Fib lvl 100% = ",PriceFibLvl00);
     }
The following is for the full code:
//+------------------------------------------------------------------+
//|                                         Simple Fibo System 2.mq5 |
//|                                  Copyright 2023, MetaQuotes Ltd. |
//|                                             https://www.mql5.com |
//+------------------------------------------------------------------+
#property copyright "Copyright 2023, MetaQuotes Ltd."
#property link      "https://www.mql5.com"
#property version   "1.00"
#define FIB_OBJ "Fibonacci Retracement"
//+------------------------------------------------------------------+
void OnTick()
  {
   int highestCandle, lowestCandle;
   double high[],low[];
   ArraySetAsSeries(high,true);
   ArraySetAsSeries(low,true);
   CopyHigh(_Symbol,_Period,0,100,high);
   CopyLow(_Symbol,_Period,0,100,low);
   double openCandle = iOpen(_Symbol,_Period,100);
   double closeCandle = iClose(_Symbol,_Period,1);
   highestCandle=ArrayMaximum(high,0,100);
   lowestCandle=ArrayMinimum(low,0,100);
   MqlRates pArray[];
   ArraySetAsSeries(pArray,true);
   int pData=CopyRates(_Symbol,_Period,0,Bars(_Symbol,_Period),pArray);
   datetime dTlvl0 = ObjectGetInteger(0,"Fibonacci Retracement",OBJPROP_TIME,0);
   double PriceFibLvl00 = ObjectGetDouble(0,"Fibonacci Retracement",OBJPROP_PRICE,0);
   datetime dTlvl1 = ObjectGetInteger(0,"Fibonacci Retracement",OBJPROP_TIME,1);
   double PriceFibLvl0 = ObjectGetDouble(0,"Fibonacci Retracement",OBJPROP_PRICE,1);
   if(closeCandle>openCandle)
     {
      ObjectDelete(_Symbol, "Fibonacci Retracement");
      ObjectCreate(_Symbol, "Fibonacci Retracement",OBJ_FIBO,0,pArray[100].time,
                   pArray[lowestCandle].low,pArray[0].time,pArray[highestCandle].high);
      ObjectSetInteger(0,FIB_OBJ,OBJPROP_COLOR,clrGreen);
      for(int i = 0; i < ObjectGetInteger(0,FIB_OBJ,OBJPROP_LEVELS); i++)
        {
         ObjectSetInteger(0,FIB_OBJ,OBJPROP_LEVELCOLOR,i,clrGreen);
        }
      double pRange =  PriceFibLvl0 - PriceFibLvl00;
      double PriceFibLvl1 = NormalizeDouble (PriceFibLvl0 - pRange * 23.6/100,_Digits);
      double PriceFibLvl2 = NormalizeDouble (PriceFibLvl0 - pRange * 38.2/100,_Digits);
      double PriceFibLvl3 = NormalizeDouble (PriceFibLvl0 - pRange * 50/100,_Digits);
      double PriceFibLvl4 = NormalizeDouble(PriceFibLvl0 - pRange * 61.8/100,_Digits);
      Comment("Array Open: ",openCandle,"\n",
              "Array Close: ",closeCandle,"\n",
              "Fib lvl 0% = ",PriceFibLvl0,"\n",
              "Fib lvl 23.6% = ",PriceFibLvl1,"\n",
              "Fib lvl 38.2% = ",PriceFibLvl2,"\n",
              "Fib lvl 50% = ",PriceFibLvl3,"\n",
              "Fib lvl 61.8% = ",PriceFibLvl4,"\n",
              "Fib lvl 100% = ",PriceFibLvl00);
     }
   else
     {
      ObjectDelete(_Symbol, "Fibonacci Retracement");
      ObjectCreate(_Symbol, "Fibonacci Retracement",OBJ_FIBO,0,pArray[100].time,
                   pArray[highestCandle].high,pArray[0].time,pArray[lowestCandle].low);
      ObjectSetInteger(0,FIB_OBJ,OBJPROP_COLOR,clrRed);
      for(int i = 0; i < ObjectGetInteger(0,FIB_OBJ,OBJPROP_LEVELS); i++)
        {
         ObjectSetInteger(0,FIB_OBJ,OBJPROP_LEVELCOLOR,i,clrRed);
        }
      double pRange =  PriceFibLvl00 - PriceFibLvl0;
      double PriceFibLvl1 = NormalizeDouble (PriceFibLvl0 + pRange * 23.6/100,_Digits);
      double PriceFibLvl2 = NormalizeDouble (PriceFibLvl0 + pRange * 38.2/100,_Digits);
      double PriceFibLvl3 = NormalizeDouble(PriceFibLvl0 + pRange * 50/100,_Digits);
      double PriceFibLvl4 = NormalizeDouble (PriceFibLvl0 + pRange * 61.8/100,_Digits);
      Comment("Array Open: ",openCandle,"\n",
              "Array Close: ",closeCandle,"\n",
              "Fib lvl 0% = ",PriceFibLvl0,"\n",
              "Fib lvl 23.6% = ",PriceFibLvl1,"\n",
              "Fib lvl 38.2% = ",PriceFibLvl2,"\n",
              "Fib lvl 50% = ",PriceFibLvl3,"\n",
              "Fib lvl 61.8% = ",PriceFibLvl4,"\n",
              "Fib lvl 100% = ",PriceFibLvl00);
     }
  }
//+------------------------------------------------------------------+
After compiling and executing this code we can find the following signals as per EA. The following are examples of signals from testing.
In case of the array is bullish:

As we can see that we have a green FIBO object on the chart and comment on the top left of the chart with the following values as per this EA:
- Array open ==> for the open price of the first candle of the array.
- Array close ==> for the close price of the last candle of the array.
- FIBO levels 0, 23.6, 38.2, 50, 61.8, 100.
In case of the array is bearish:

As we can see that we have a red FIBO object on the chart and comment on the top left of the chart with the following values as per this EA:
- Array open ==> for the open price of the first candle of the array.
- Array close ==> for the close price of the last candle of the array.
- FIBO levels 0, 23.6, 38.2, 50, 61.8, 100.
FIBO Signals 2:
Now, we will create based on the second approach a trading system to return buy and sell signals based on the user input FIBO level. The following is the full code to create this trading system:
//+------------------------------------------------------------------+
//|                                               Fibo Signals 2.mq5 |
//|                                  Copyright 2023, MetaQuotes Ltd. |
//|                                             https://www.mql5.com |
//+------------------------------------------------------------------+
#property copyright "Copyright 2023, MetaQuotes Ltd."
#property link      "https://www.mql5.com"
#property version   "1.00"
#define FIB_OBJ "Fibonacci Retracement"
#property script_show_inputs
input double fibRetracLvl = 38.2;
//+------------------------------------------------------------------+
void OnTick()
  {
   int highestCandle, lowestCandle;
   double high[],low[];
   ArraySetAsSeries(high,true);
   ArraySetAsSeries(low,true);
   CopyHigh(_Symbol,_Period,0,100,high);
   CopyLow(_Symbol,_Period,0,100,low);
   double openCandle = iOpen(_Symbol,_Period,100);
   double closeCandle = iClose(_Symbol,_Period,1);
   highestCandle=ArrayMaximum(high,0,100);
   lowestCandle=ArrayMinimum(low,0,100);
   MqlRates pArray[];
   ArraySetAsSeries(pArray,true);
   int pData=CopyRates(_Symbol,_Period,0,Bars(_Symbol,_Period),pArray);
   datetime dTlvl0 = ObjectGetInteger(0,"Fibonacci Retracement",OBJPROP_TIME,0);
   double PriceFibLvl00 = ObjectGetDouble(0,"Fibonacci Retracement",OBJPROP_PRICE,0);
   datetime dTlvl1 = ObjectGetInteger(0,"Fibonacci Retracement",OBJPROP_TIME,1);
   double PriceFibLvl0 = ObjectGetDouble(0,"Fibonacci Retracement",OBJPROP_PRICE,1);
   if
   (closeCandle>openCandle)
     {
      ObjectDelete(_Symbol, "Fibonacci Retracement");
      ObjectCreate(_Symbol, "Fibonacci Retracement",OBJ_FIBO,0,pArray[100].time,
                   pArray[lowestCandle].low,pArray[0].time,pArray[highestCandle].high);
      ObjectSetInteger(0,FIB_OBJ,OBJPROP_COLOR,clrGreen);
      for(int i = 0; i < ObjectGetInteger(0,FIB_OBJ,OBJPROP_LEVELS); i++)
        {
         ObjectSetInteger(0,FIB_OBJ,OBJPROP_LEVELCOLOR,i,clrGreen);
        }
      double pRange =  PriceFibLvl0 - PriceFibLvl00;
      double PriceFibLvl1 = NormalizeDouble(PriceFibLvl0 - pRange * 23.6/100,_Digits);
      double PriceFibLvl2 = NormalizeDouble(PriceFibLvl0 - pRange * 38.2/100,_Digits);
      double PriceFibLvl3 = NormalizeDouble(PriceFibLvl0 - pRange * 50/100,_Digits);
      double PriceFibLvl4 = NormalizeDouble(PriceFibLvl0 - pRange * 61.8/100,_Digits);
      double entryLvl = NormalizeDouble(PriceFibLvl0 - pRange * fibRetracLvl/100,_Digits);
      Comment("Array Open: ",openCandle,"\n",
              "Array Close: ",closeCandle,"\n",
              "Buy Entry Price: ",entryLvl);
     }
   else
     {
      ObjectDelete(_Symbol, "Fibonacci Retracement");
      ObjectCreate(_Symbol, "Fibonacci Retracement",OBJ_FIBO,0,pArray[100].time,
                   pArray[highestCandle].high,pArray[0].time,pArray[lowestCandle].low);
      ObjectSetInteger(0,FIB_OBJ,OBJPROP_COLOR,clrRed);
      for(int i = 0; i < ObjectGetInteger(0,FIB_OBJ,OBJPROP_LEVELS); i++)
        {
         ObjectSetInteger(0,FIB_OBJ,OBJPROP_LEVELCOLOR,i,clrRed);
        }
      double pRange =  PriceFibLvl00 - PriceFibLvl0;
      double PriceFibLvl1 = NormalizeDouble(PriceFibLvl0 + pRange * 23.6/100,_Digits);
      double PriceFibLvl2 = NormalizeDouble(PriceFibLvl0 + pRange * 38.2/100,_Digits);
      double PriceFibLvl3 = NormalizeDouble(PriceFibLvl0 + pRange * 50/100,_Digits);
      double PriceFibLvl4 = NormalizeDouble(PriceFibLvl0 + pRange * 61.8/100,_Digits);
      double entryLvl = NormalizeDouble(PriceFibLvl0 + pRange * fibRetracLvl/100,_Digits);
      Comment("Array Open: ",openCandle,"\n",
              "Array Close: ",closeCandle,"\n",
              "Sell Entry Price: ",entryLvl);
     }
  }
//+------------------------------------------------------------------+
Differences in this code:
Adding a property by using #property script_show_inputs that displays a window with the properties and using an input variable to create a double data type for fibRetracLvl with a default value of 38.2 for example.
#property script_show_inputs
input double fibRetracLvl = 38.2;
Defining entry level based on the user input in the case of bullish.
double entryLvl = NormalizeDouble(PriceFibLvl0 - pRange * fibRetracLvl/100,_Digits);
Defining entry level based on the user input in the case of bearish.
double entryLvl = NormalizeDouble(PriceFibLvl0 + pRange * fibRetracLvl/100,_Digits);
Comment based on the bullish case.
      Comment("Array Open: ",openCandle,"\n",
              "Array Close: ",closeCandle,"\n",
              "Buy Entry Price: ",entryLvl);
Comment based on the bearish case.
      Comment("Array Open: ",openCandle,"\n",
              "Array Close: ",closeCandle,"\n",
              "Sell Entry Price: ",entryLvl);
After compiling and executing this code we can get our signals the same as the following examples of bullish and bearish arrays from testing.
The array is bullish:

As we can see that we have a green FIBO object drawn from the lowest value to the highest value of the array and the following values as a comment on the chart:
- Array open ==> is the same value as the open price of the first candle of the array.
- Array close ==> is the same value as the closing price of the last candle in the array.
- Buy entry price ==> is the same value as the 38.2 FIBO level.
The array is bearish:

As we can see that we have a red FIBO object drawn from the highest value to the lowest value of the array and the following values as a comment on the chart:
- Array open ==> is the same value as the open price of the first candle of the array.
- Array close ==> is the same value as the closing price of the last candle in the array.
- Sell entry price ==> is the same value as the 38.2 FIBO level.
Conclusion
Now, it is supposed that you learned how to create a simple Fibonacci trading system by MQL5 to use for the MetaTrader 5 trading terminal after you learned the Fibonacci technical tool in detail through the topic of Fibonacci definition and you learned how we can use it after inserting it into the MetaTrader 5.
Also, we shared here two approaches to create the Fibonacci, one of them by using the daily data and the other by using an array of specific candles in any timeframe to return the Fibonacci levels and get buy or sell entry levels based on these levels. I confirm again to combine this tool with other technical tools to get better results and you must test mentioned strategies or concepts before using them on your real account to make sure that they will be profitable for your trading and there is nothing is suitable for everyone in addition to that the main objective here is educational only and you can find some refinement or optimization for mentioned strategies.
I hope that you find this article useful and insightful for you by learning something new or opening your eyes to new ideas that can improve your trading results. If you need to read more similar articles about designing trading systems based on the most popular technical indicators and tools, you can read my other articles in this series as we share most of the popular ones like Moving averages, MACD, Bollinger Bands, Stochastic...etc. and I hope you will find them useful as well.
Warning: All rights to these materials are reserved by MetaQuotes Ltd. Copying or reprinting of these materials in whole or in part is prohibited.
This article was written by a user of the site and reflects their personal views. MetaQuotes Ltd is not responsible for the accuracy of the information presented, nor for any consequences resulting from the use of the solutions, strategies or recommendations described.

- Free trading apps
- Over 8,000 signals for copying
- Economic news for exploring financial markets
You agree to website policy and terms of use
You're the best, thanks for sharing this🙏🙏
Thanks for your kind comment.
You may watch at : https://youtu.be/QmxlptpUdNE?si=bWiOXuJQjcUFr5QT