SOMFX1
- Indikatoren
-
Stanislav Korotky
 Trading is just my hobby. I'm working in IT industry. So developement of experts, indicators, and script is not a problem at all to me. Wide range of technologies are used: MQL4, MQL5, system and applied programming, web-services, neural networks and more.
New: - Version: 1.1
- Aktualisiert: 20 November 2021
- Aktivierungen: 5
Wenn Sie gerne nach Kerzenmustern handeln und diesen Ansatz durch moderne Technologien verstärken möchten, sind dieser Indikator und andere damit verbundene Tools genau das Richtige für Sie. Dieser Indikator ist Teil einer Toolbox, die eine neuronale Netzwerk-Engine enthält, die eine selbstorganisierende Karte (SOM) für die Erkennung und Vorhersage von Kerzenmustern implementiert und Ihnen die Möglichkeit bietet, Eingabe- und Ergebnisdaten zu untersuchen. Die Toolbox enthält:
- SOMFX1Builder - ein Skript für das Training neuronaler Netze; es erstellt eine Datei mit verallgemeinerten Daten über die meisten charakteristischen Preisfiguren, die für die Vorhersage der nächsten Takte entweder in einem eingebauten Unterfenster (mit diesem SOMFX1-Indikator) oder direkt auf dem Chart mit SOMFX1Predictor verwendet werden können;
- SOMFX1 - dieser Indikator für die Vorhersage von Preismustern und die visuelle Analyse eines trainierten neuronalen Netzwerks, der Eingabe- und Ergebnisdaten (in einem separaten Unterfenster);
- SOMFX1Predictor - ein weiterer Indikator für die Vorhersage von Kursmustern nur im Hauptfenster;
Kurz gesagt, der gesamte Prozess der Preisanalyse, des Netzwerktrainings, der Mustererkennung und der Vorhersage geht von den folgenden Schritten aus:
- Aufbau eines neuronalen Netzes mit SOMFX1Builder;
- Analysieren Sie die Leistung des resultierenden neuronalen Netzes mit Hilfe von SOMFX1; wenn Sie nicht zufrieden sind, wiederholen Sie Schritt 1 mit neuen Einstellungen; Sie können diesen Schritt auch überspringen;
- Verwenden Sie das endgültige neuronale Netz für die Vorhersage von Kursmustern mit SOMFX1Predictor.
Alle diese Schritte werden im Folgenden ausführlich beschrieben.
Einführung
Was sind Kerzenmuster? Es handelt sich um charakteristische Figuren, die von aufeinanderfolgenden Balken gebildet werden, die vor vielen Jahren von der Händlergemeinschaft "entdeckt" wurden und lustige Namen erhielten. Es gibt keine stichhaltigen Beweise dafür, dass die Muster wie erwartet funktionieren - wenn auch nicht immer, so doch zumindest in der statistisch signifikanten Mehrheit der Fälle. Es ist auch nicht garantiert, dass alle genannten Muster alle Regelmäßigkeiten des modernen Marktes abdecken, insbesondere wenn man bedenkt, dass die meisten von ihnen in der Ära der alten, guten und bequemen Märkte entstanden sind. Wenn zum Beispiel ein Chart um eine halbe Balkenperiode verschoben wird (z.B. H4 um 2 Stunden), verschwinden die bestehenden Muster und es bilden sich völlig neue Muster auf anderen Balken. Bedeutet dies nicht, dass jedes herkömmliche Muster mehrere verschiedene Darstellungen haben sollte? Aber halt, dann würde der "Hammer" nicht wie ein Hammer aussehen und der "Stern" nicht wie ein Stern? Dies scheint die ganze künstliche Schönheit des Kerzenmusters zu zerstören, aber das ist nur fair.
Muster sind lediglich eine leicht zu erfassende visuelle Darstellung von Preisänderungen, in der Regel Deltas zwischen den Schlusskursen von Balken. Es handelt sich nicht nur um Kerzenmuster, sondern ganz allgemein um Kursmuster.
Und heute brauchen wir, und vor allem haben wir die Möglichkeit, einen neuen wissenschaftlichen Ansatz für die Erkennung von Kursmustern.
Dieser Indikator stellt Ihnen die Technologie der neuronalen Netze zur Verfügung, insbesondere die Self-Orgranizing Map (SOM). Wie jedes andere neuronale Netz besteht auch SOM aus Neuronen - elementaren Recheneinheiten. In SOM kann jedes Neuron eine Information über ein einzelnes Kursmuster enthalten. Der Grund, warum es SOM genannt wird, ist, dass das Netz automatisch verschiedene Preismuster vergleicht und sie auf einer 2-dimensionalen Karte platziert, wobei benachbarte Einheiten (Muster) einander ähnlich sind und weiter entfernte Einheiten weniger ähnlich sind. Jede Preisänderung kann dann einer am besten übereinstimmenden Einheit (BMU, siehe unten) zugeordnet werden, so dass es möglich ist, aus dem Anfangsteil eines Musters das Ende der Einheit zu ermitteln.
Wie es funktioniert
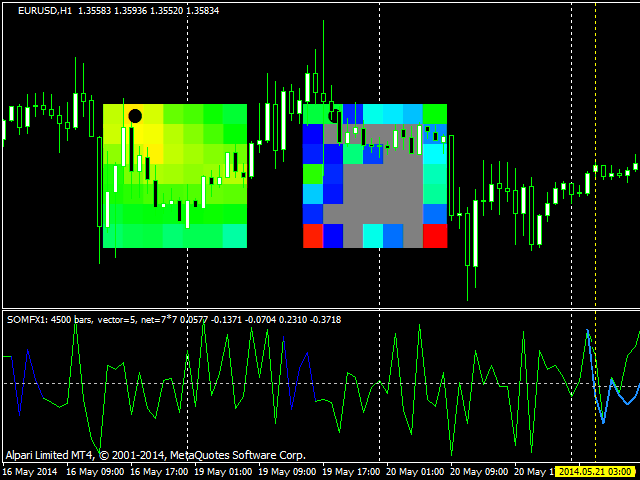
Die Oberfläche des Indikators besteht aus zwei Teilen. Im Hauptchart werden die Karte selbst und die Hilfssteuerungen angezeigt. In den Unterfenstern werden Preisbeispiele und Vorhersagen angezeigt. Die Stichproben und Vorhersagen sind normalisierte (auf den Bereich [-1, +1]) Delta-Werte zwischen den Preisen in aufeinanderfolgenden Balken. Die Stichproben bilden eine grüne Linie. Die Vorhersage wird durch eine hellblaue dicke Linie dargestellt (sie hat die Länge der PredictionBars-Balken und kann in der Zukunft fortgesetzt werden). Auf der rechten Seite der Muster (d.h. irgendwo in der Zukunft) sehen Sie eine Reihe von Linien der Länge von PatternSize Bars. Sie zeigen die Struktur der aktuell ausgewählten, am besten passenden Einheit (Details siehe unten).
Sie müssen das Netz für einen bestimmten Zeitraum in der Vergangenheit trainieren (mit SOMFX1Builder). Dies ist ein langwieriger Prozess, der aber - wahrscheinlich (warum wahrscheinlich? - siehe unten) - nur einmal durchgeführt werden kann. Nach dem Training erhalten Sie das trainierte Netzwerk, das neue Kursbewegungen analysieren und vorhersagen kann. Weitere Einzelheiten zum Netzwerktraining finden Sie in der SOMFX1Builder-Dokumentation.
Wenn das Training beendet ist, erhalten Sie eine Datei mit der Erweiterung candlemap (SOMFX1Builder erstellt solche Dateien im Unterverzeichnis Files Ihres MQL4-Ordners). Sie sollten den Namen der Datei in den Indikatoreinstellungen angeben, und der Indikator wird 2 quadratische Karten auf dem Hauptchart anzeigen. Das linke Quadrat zeigt die aktuelle Aktivität jedes Neurons an: Neuronen mit hoher Erregung sind rot dargestellt, Neuronen mit hoher Hemmung sind blau dargestellt. Mit anderen Worten: Je röter die Zelle auf der Karte ist, desto besser passt sie zum aktuellen Kursmuster. Die aktuelle Kursstichprobe ist ein Fragment von Delta-Werten aus PatternSize-Balken links von der vertikalen gestrichelten gelben Linie mit der Bezeichnung "FromPastToFuture". Sie können die Linie an eine beliebige Position ziehen, und der Indikator wird das aktuelle Sample an dieser Position lesen und SOM gegen dieses Sample laufen lassen, so dass Sie eine neue Aktivierung der Karte und der Vorhersage sehen werden.
Bitte beachten Sie, dass die Vorhersage beim aktuellen Bar beginnt, d.h. der aktuelle Bar wird auch vorhergesagt. Dies geschieht, weil der aktuelle Balken in der Regel unvollendet ist und ebenfalls eine Vorhersage erfordert. Außerdem würde die Berücksichtigung eines noch nicht abgeschlossenen Balkens die Vorhersage inkonsistent machen (instabil während der Lebensdauer des aktuellen Balkens). Da der aktuelle Balken vorhergesagt wird, beginnt die hellblaue dicke Linie mit der Vorhersage 1 Balken links von der vertikalen Linie "FromPastToFuture" - sie zeigt, wie sich der Preis auf dem aktuellen Balken ändern sollte.
Die zweite - rechte - quadratische Karte zeigt die "Bevölkerungsdichte" jeder Einheit an, d.h. ihre Farbe bezeichnet die Anzahl der in den Trainingsdaten vorkommenden Samples, die in der entsprechenden Zelle gelandet sind und das entsprechende Preismuster gebildet haben. Wiederum bedeutet die rote Farbe eine relativ hohe Bevölkerungsdichte und die blaue eine relativ geringe. Graue Zellen haben keine entsprechenden Muster in den Trainingsdaten.
Wenn Sie die Linie "VonVergangenheitZukunft" von Balken zu Balken verschieben, wählt die Karte eine Einheit aus, die am besten zu dem Preisbeispiel passt, und markiert die siegreiche Einheit mit einem runden Punkt. Diese Einheit wird als beste übereinstimmende Einheit bezeichnet. Ihre Gewichte werden als rote Linie im rechten Teil des Unterfensters angezeigt. Es handelt sich um ein bestimmtes Preismuster, das vom Netz automatisch entdeckt und verallgemeinert wurde. Wenn der Einheit einige Stichproben zugeordnet sind, werden die durchschnittlichen Preisänderungen für alle diese Stichproben als orangefarbene Linie und die Varianz in zwei grauen Linien darüber und darunter angezeigt.
Dies ist genau die Information, die eine Vorhersage möglich macht: wenn ein neuer Preis sich ändert, passt der Anfang eines Musters (z.B. 4 Balken eines 5-Balken-Musters), das Ende des Musters gibt die wahrscheinlichste Fortsetzung (der 5. Balken im Beispiel).
Wenn die Linie "FromPastToFuture" verschoben wird, werden nicht nur die Vorhersage und die am besten passende Einheitsstruktur angezeigt. Darüber hinaus hebt der Indikator die an die BMU gebundenen Preismuster in Blau hervor. Dies sieht aus wie blaue Fragmente, die teilweise die grüne Kurve mit den Preisdeltas überlagern. Bitte beachten Sie, dass sich die Muster gegenseitig überlappen können. Wenn zum Beispiel die Länge des Musters 4 beträgt und ein Muster bei Balken Nummer 10 und ein anderes bei Balken Nummer 12 beginnt, haben sie 2 gemeinsame Balken. In diesem Fall werden 6 aufeinanderfolgende Takte in einer Reihe hervorgehoben, und die Muster sind visuell nicht voneinander zu trennen.
Es ist möglich, eine Zelle auf der rechten Seite der quadratischen Karte an eine andere Stelle zu ziehen. Wenn dies geschieht, zeigt der Indikator das Kursmuster und die Durchschnittswerte für diese spezifische Zelle an. (Die Zelle selbst wird im nächsten Moment automatisch wieder in die Karte verschoben). Diese Funktion ermöglicht es Ihnen, Muster in der Karte zu untersuchen.
Parameter
- LearnStart - Nummer eines Balkens in der Historie oder ein genaues Datum und eine genaue Uhrzeit des Balkens (im Format "JJJJ.MM.DD HH:MM"), an dem die Trainingsdaten begannen; dieser Parameter ist eine Zeichenkette, die es Ihnen erlaubt, entweder eine Zahl oder ein Datum einzugeben; dieser Parameter wird hier nicht für das Training, sondern für die Erstellung tatsächlicher Preisbeispiele (entsprechend dem Netzwerk) verwendet, was wichtig ist, wenn der Parameter UseAverage wahr ist (siehe unten), sowie für die Visualisierung der "Population" der Karte; Standardwert - 5001; wenn Sie einen automatisch generierten Dateinamen im Parameter NetFileName (siehe unten) eingeben, analysiert der Indikator den Namen und überschreibt diesen Parameter mit einem Wert aus dem Namen; mit anderen Worten, dieser Parameter hat keine Wirkung, wenn ein automatisch generierter Dateiname im Parameter NetFileName angegeben ist;
- LearnStop - Nummer eines Balkens in der Historie, oder ein genaues Datum und eine genaue Uhrzeit des Balkens (im Format "YYYY.MM.DD HH:MM"), an dem die Trainingsdaten endeten; dieser Parameter ist ebenfalls eine Zeichenkette; Standardwert - 1; dieser Parameter wird hier nicht für das Training, sondern für die Erstellung von tatsächlichen Preisbeispielen (entsprechend dem Netzwerk) verwendet, was wichtig ist, wenn der Parameter UseAverage wahr ist, und für die Visualisierung der Karte "Population"; dieser Parameter hat keine Auswirkung, wenn ein automatisch generierter Dateiname im Parameter NetFileName angegeben ist;
- PatternSize - Anzahl der Balken in einem einzelnen Muster; Standardwert - 5; dieser Parameter hat keine Auswirkung, wenn ein automatisch generierter Dateiname im Parameter NetFileName angegeben ist;
- GridSize - Abmessungen der Karte; dies ist eine Anzahl von Zellen/Einheiten auf der X- und Y-Achse; erlaubte Werte: 3 - 50; Standardwert - 7; dieser Parameter hat keine Auswirkung, wenn ein automatisch generierter Dateiname im Parameter NetFileName angegeben ist;
- PredictionBars - Anzahl der vorherzusagenden Balken; Standardwert - 10; bitte beachten Sie, dass jeder nächste Balken mit geringerer Genauigkeit vorhergesagt wird als der vorherige, da unvermeidbare Fehler bei jedem Balken kumuliert werden;
- UseAverage - dies ist ein spezieller Modusschalter; wenn er deaktiviert ist (false, Standardwert), werden die Vorhersagen unter Verwendung der Gewichte der Gewinnerneuronen gemacht, d.h. sie sind das Produkt der Karte; wenn er aktiviert ist (true), basieren die Vorhersagen auf den Durchschnittswerten aller Preisproben, die dem Gewinnerneuron zugeordnet sind; dies erfordert nicht nur die Karte, sondern auch die Trainingsdaten, wie sie für das Training des Netzwerks verwendet wurden, weshalb es wichtig ist, das genaue Datum und die Uhrzeit anzugeben, zu der die Proben während des Trainings genommen wurden; Sie können mit diesem Parameter "spielen", um bessere Ergebnisse zu erzielen: Die Verwendung von Gewichtungsvektoren ist der herkömmliche Ansatz, aber die Verwendung von Durchschnittswerten erhöht das Datenbewusstsein - so können Sie beispielsweise einen Varianzwert für die Schätzung der Vorhersagegenauigkeit berücksichtigen;
- PriceType - Preistyp, der für die Stichprobenziehung verwendet werden soll; Standardwert - close; dieser Parameter hat keine Auswirkungen, wenn im Parameter NetFileName ein automatisch generierter Dateiname angegeben ist;
- AddInvertedPrice - aktiviert/deaktiviert einen Modus, in dem invertierte Preisbewegungen zu den Stichproben hinzugefügt werden; Voreinstellung - true;
- NetFileName - ein Dateiname des trainierten neuronalen Netzes, der durch das Skript SOMFX1Builder generiert wurde; wenn der Name automatisch generiert wurde, enthält er mehrere notwendige Komponenten, um die meisten der oben genannten Parameter wiederherzustellen, so dass der Benutzer nur diesen einen Parameter ausfüllen muss; die Struktur des Dateinamens ist die folgende: SOM-V-D-SYMBOL-TF-YYYYMMDDHHMM-YYYYMMDDHHMM-P.candlemap, wobei V - PatternSize, D - GridSize, SYMBOL - aktuelles Arbeitssymbol, TF - aktueller Zeitrahmen, YYYYMMDDHHMM - LearnStart bzw. LearnStop; P - PriceType;
- CellSize - Größe einer einzelnen Einheit, die auf dem Diagramm visualisiert wird; Standardwert - 20, was für Karten mit einer Größe von bis zu 10 in Ordnung ist; für größere Karten wählen Sie eine kleinere Zellengröße, da sich sonst die beiden Kartenansichten überlappen;
- PrintData - aktiviert/deaktiviert die Debug-Protokollierung; Voreinstellung - false;
Wenn einige der Parameter nicht korrekt sind, gibt der Indikator eine Fehlermeldung in das Protokoll aus. Zum Beispiel können Sie eine Karte nur auf einen Chart mit demselben Symbol und Zeitrahmen laden, der beim Training verwendet wurde.