Master 360 Circle Chart With Arrows
- Indikatoren
-
Francesco Rubeo
 Minerva Management is a company composed by software engineers, especially in MQL4 by 6 years, and 6 years experienced traders.
 - Version: 1.2
- Aktualisiert: 4 Mai 2019
- Aktivierungen: 20
| Handeln Sie mit Gann an Ihrer Seite!! |
|---|
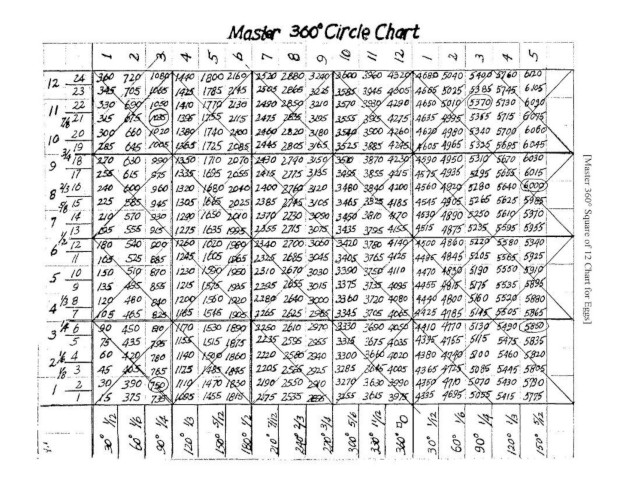
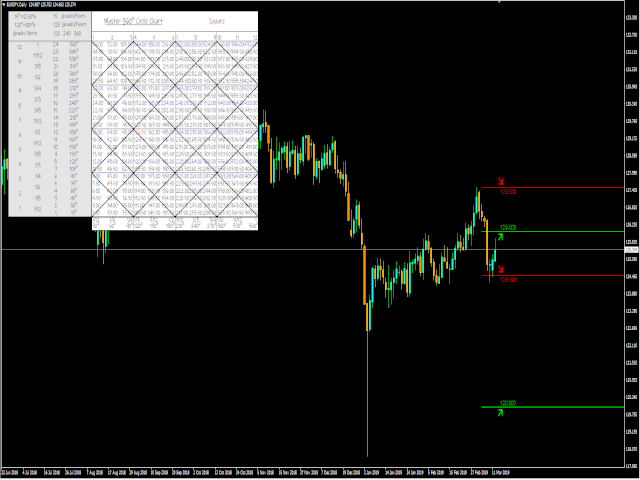
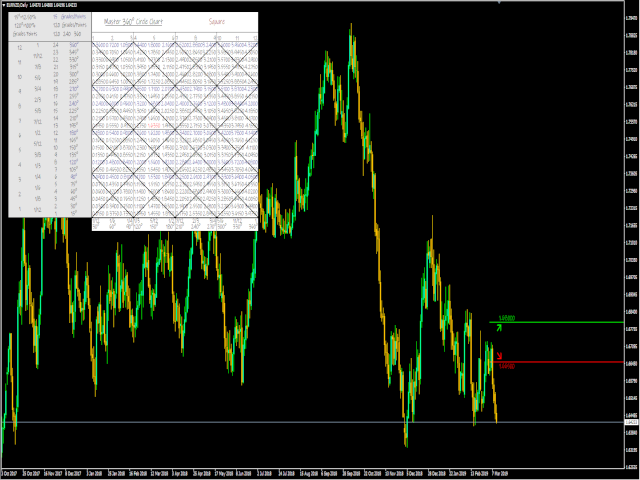
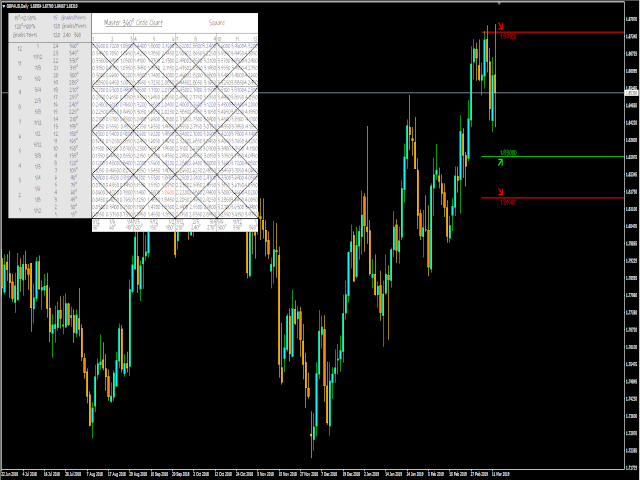
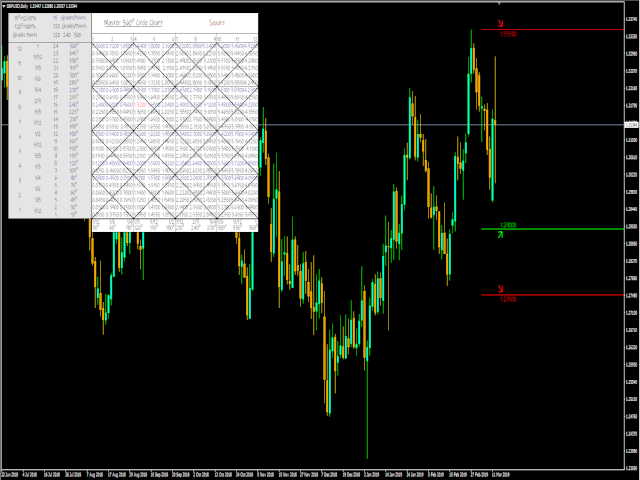
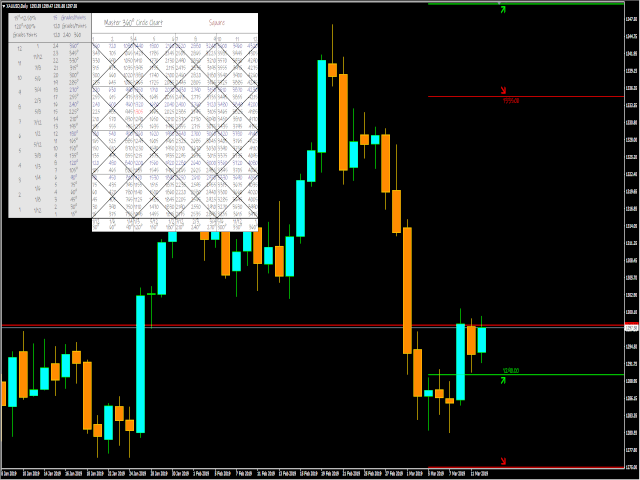
MASTER CIRCLE 360° CIRCLE CHART, ursprünglich von Gann erstellt, der zugab, dass dies "Die Mutter aller Charts" ist. Es ist eine der letzten Studien, die dieser große Trader uns hinterlassen hat.
DieZahlentabelle ist, wie alle Tabellen, offensichtlich recht einfach und basiert auf quadratischen Zahlen, der QUADRATSZAHL VON 12 und ist durch die Evolution eine der wichtigsten quadratischen Zahlen.
Hier finden wir ZYKLUS, PREIS und ZEIT dank der Winkel und Grade, um vergangene und zukünftige Unterstützungen und Widerstände aufzuzeigen.
Die Studie beginnt damit, dass ein ganzer kreisförmiger Raum, der 360 entspricht, durch 12 geteilt wird. Das Ergebnis ist 30, wenn man es durch 2 teilt, erhält man 15, die Basis, mit der wir unsere Studie beginnen.
Die Tabelle beginnt mit 15 und endet mit der Zahl 4320. Diese Grundtabelle wurde von Gann zur Untersuchung des Eiermarktes verwendet.
Wir können die Tabelle an die aktuellen Preise und an alle Arten von Märkten anpassen, indem wir die Zahlen durch 10, 100, 1000 usw. teilen.
Eine andere Möglichkeit, die wir hinzugefügt haben, ist die Verwendung der ADR (Average Daily Range)
Eingabe-Parameter:
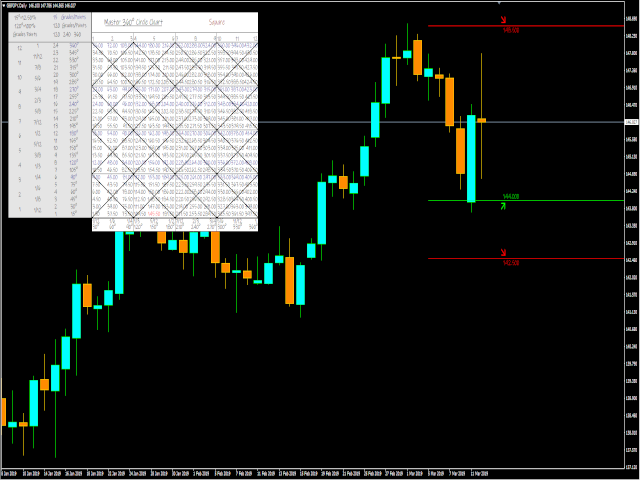
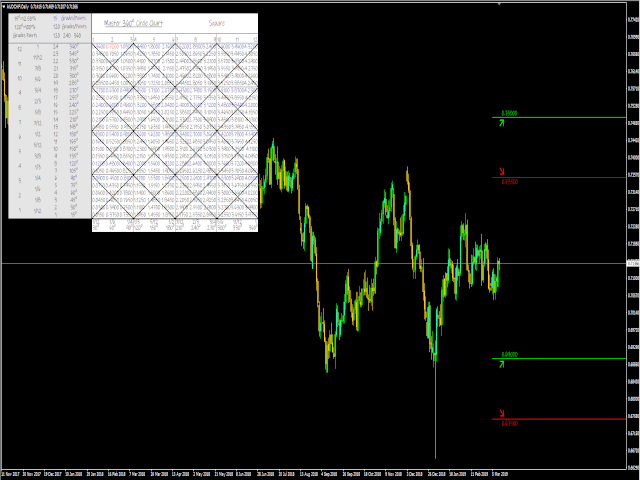
- Art der Unterstützung/Widerstand: Wählen Sie, ob Sie Square oder Classic Support/Resistance verwenden möchten.
- An den aktuellen Preis anpassen: Wenn ja, wird der Indikator die Tabellenwerte an den aktuellen Preis anpassen.
- ADR verwenden: Wenn wahr, passt der Indikator die Tabellenwerte an die ADR-Werte an.
- Schriftart: Wählen Sie Ihre bevorzugte Schriftart.
- Schriftgröße: Wählen Sie Ihre bevorzugte Schriftgröße.
Einstellungen für Benachrichtigungen
- Benachrichtigungen: Wenn dies der Fall ist, sendet Ihnen der Indikator Benachrichtigungen.
- @Mails senden: Wenn ja, sendet Ihnen der Indikator E-Mails.
- Push-Benachrichtigungen senden: Wenn ja, sendet der Indikator Push-Benachrichtigungen.


thank you