Blahtech Market Profile
- Indikatoren
-
Blahtech Limited
 Professional IT developer with over 20 years of experience working with top tier investment banks (Barclays Capital, Credit Suisse, Merrill Lynch, ABN Amro, Mizuho Bank) - LinkedIn profile available on request
 - Version: 4.1
- Aktualisiert: 2 Juli 2024
- Aktivierungen: 10
War: $249 Jetzt: $99
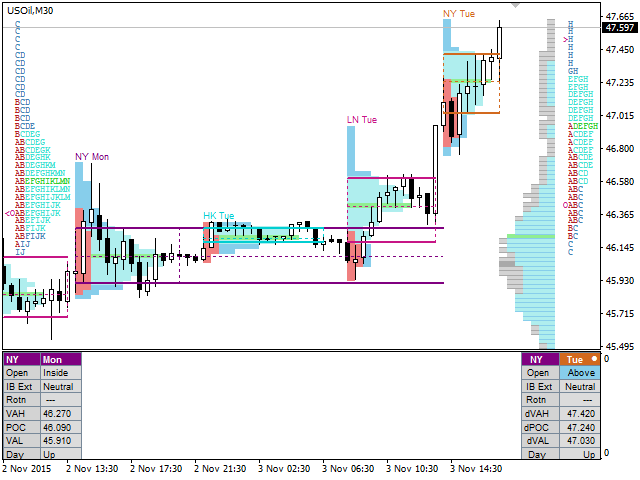
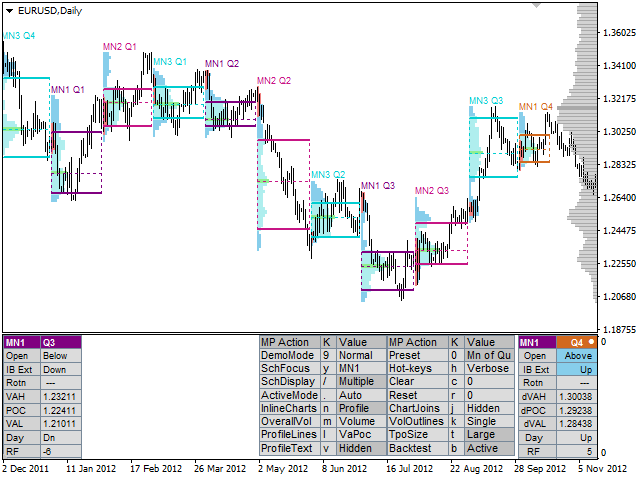
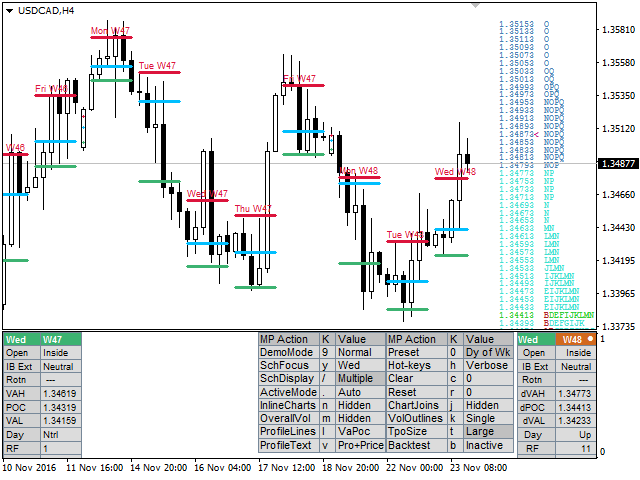
Das Marktprofil definiert eine Reihe von Tagestypen, die dem Händler helfen können, das Marktverhalten zu bestimmen. Ein Schlüsselmerkmal ist der Value-Bereich, der den Bereich der Kursbewegung darstellt, in dem 70 % des Handels stattfand. Das Verständnis des Value-Bereichs kann Händlern einen wertvollen Einblick in die Marktrichtung geben und den Handel mit höheren Gewinnchancen festlegen. Es ist eine hervorragende Ergänzung zu jedem System, das Sie verwenden.
Blahtech Limited präsentiert seinen Marktprofil-Indikator für die MetaTrader-Community. Inspiriert von Jim Daltons Buch "Mind Over Markets", wurde dieser Indikator entwickelt, um den Bedürfnissen aller Profilhändler gerecht zu werden. Er bietet Funktionen, die normalerweise nur auf Futures-Plattformen verfügbar sind, und fügt Innovationen wie die automatische Umschaltung des Fokus und den Backtest-Modus hinzu.
Links [ Dokumentation |Installation | Update | Training| Alle Produkte ]
Funktions-Highlights
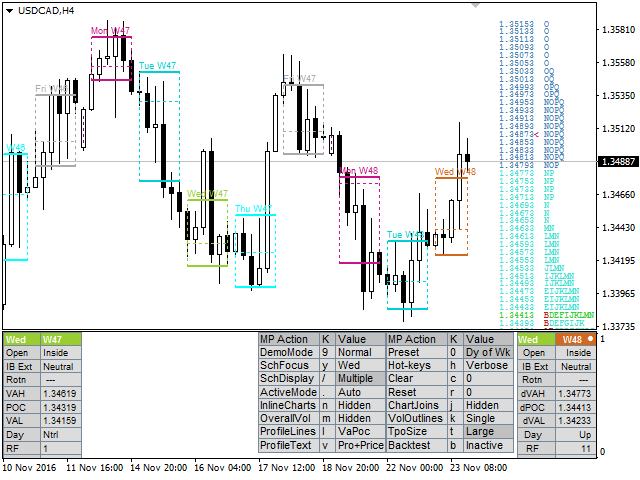
- Konfigurationsvorgaben für Zeitpläne auf höheren Zeitskalen
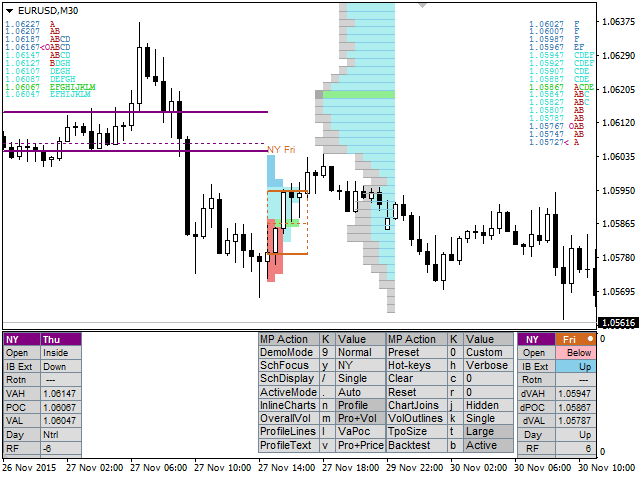
- Automatisches Umschalten des Fokus auf die nächste aktive Sitzung
- Hervorhebung von Geschäftsregeln - Open, IB Extension und Rotation Rules
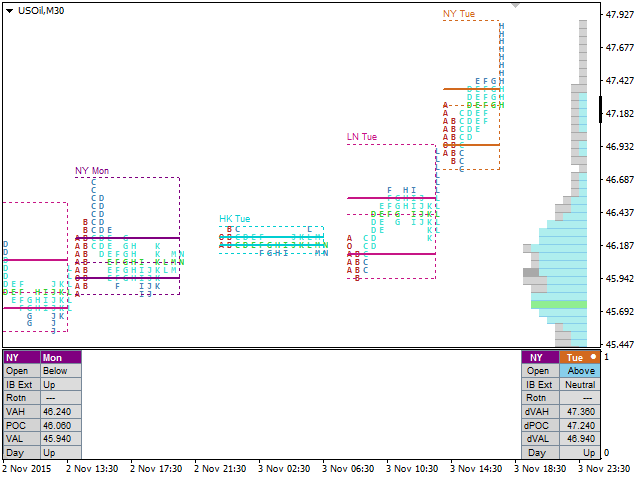
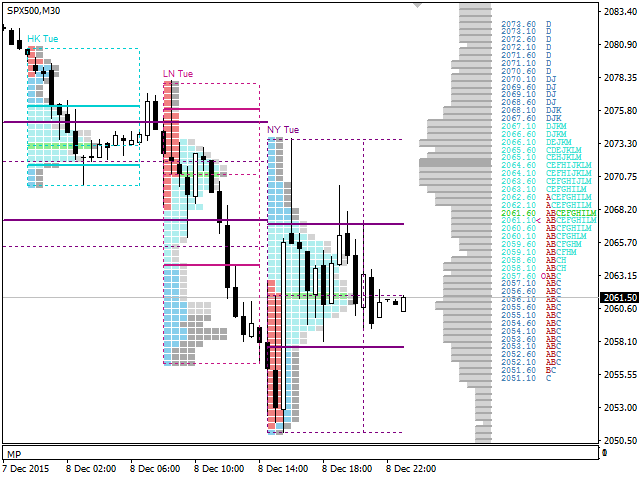
- Multi-Session-Anzeige
- Backtesting direkt auf dem Chart
- Benutzerdefinierte Session-Zeiten
- Benutzerdefinierte Intervalle und Zeitrahmenperioden
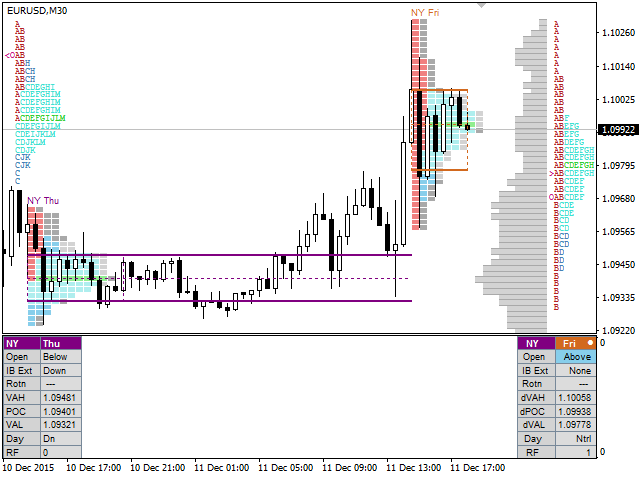
- Markt- und Volumenprofile
- Gesamtmarkt- und Volumenprofile
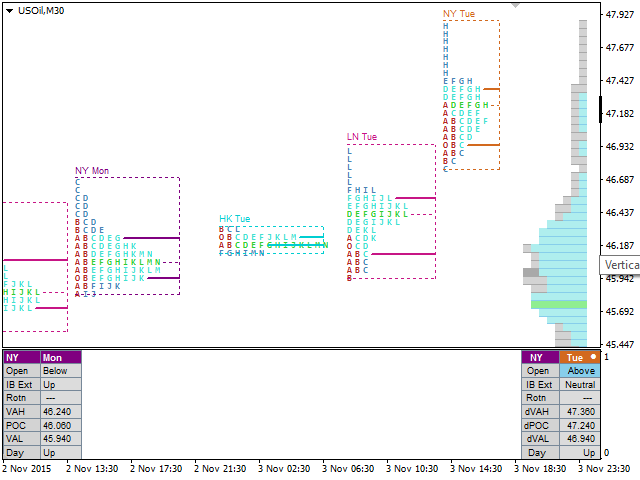
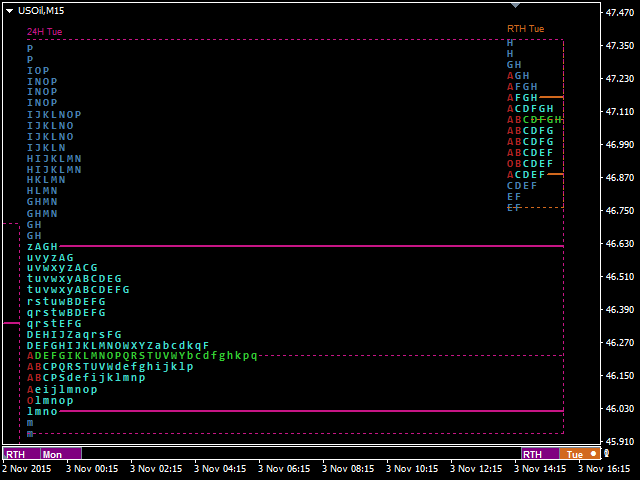
- Textbasierte TPO-Profile
- Konfigurierbarer TPO-Startbrief
- Wertbereich, Volumenwertbereich
- Anfangsbestand, Kontrollpunkt
- Schnellzugriffs-Hotkeys
Puffer für Entwickler
Sieben Puffer, siehe vollständige Dokumentation für Details
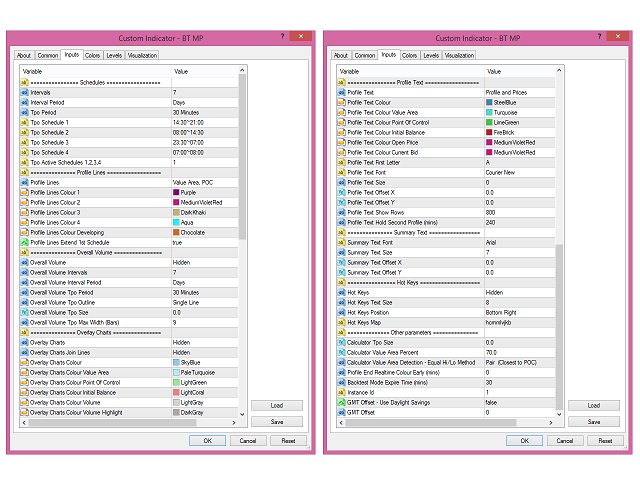
Eingabe-Parameter
Voreinstellungen
- Konfiguration Voreinstellung - Wählen Sie benutzerdefinierte oder vordefinierte Zeitpläne. Tastenkombination "0"
Zeitpläne
- Intervalle - Anzahl der anzuzeigenden Intervallperioden
- Intervallzeitraum - Zeitrahmen der Intervalle (Tage)
- TPO-Periode - Zeitrahmen für jede TPO-Zeile (30 Min.)
- TPO-Größe
- TPO-Zeitplan 1-7
- TPO-Zeitplan-Namen
- TPO Zeitplan Anzeige - Einzel / Multi. Hotkey "/"
- TPO Zeitplan Aktiver Modus - Auto/Man. Tastenkombination "."
- TPO Aktive Zeitpläne - z.B. 2,1,3
Profil-Linien
- Profillinien - Wählen Sie, welche Linien im Diagramm angezeigt werden sollen. Hot-Key "L"
- Profillinien Farbe 1-7, Stile, Schriftarten
- Breite der Profillinien Horizontal
- Profillinien Breite Vertikal - (0 zum Entfernen)
- Profillinien Titel - Wählen Sie die Titel, die auf dem Diagramm angezeigt werden sollen
- Profillinien Aktiven Zeitplan verlängern - Verlängert die vorherigen aktiven Zeitplanlinien bis zum nächsten Intervall
Gesamtvolumen
- Gesamtvolumen - Anzeige des grafischen Profils. Hot-Key "M"
- Gesamtvolumen Intervallzeitraum - Zeitrahmen der Intervalle (Tage)
- Gesamtvolumen TPO-Periode - Zeitrahmen für jede TPO-Zeile (30 Min.)
- Gesamtvolumen TPO Größe
- Gesamtvolumen TPO Gliederung - Gliederungsstil (einzeilig). Hot-Key "K"
- Gesamtvolumen TPO Größe
- Gesamtvolumen TPO Offset (Balken)
- Gesamtvolumen maximale Breite (Balken)
- Gesamtvolumen Wertbereich hervorheben
- Gesamtvolumen Benutzerdefinierter Zeitplan
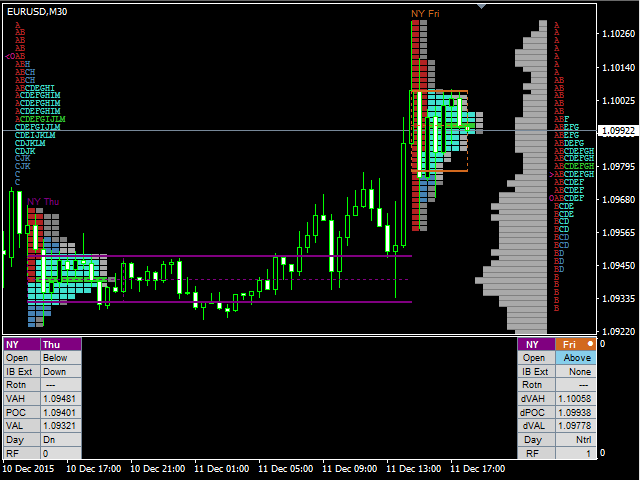
Überlagerungsdiagramme
- Überlagerungsdiagramme - Grafisches Profil anzeigen. Hot-Key "N"
- Überlagerungsdiagramme Verbindungslinien - Trennlinien zwischen den einzelnen TPO. Schnelltaste "J"
- Überlagerungsdiagramme Farben x7
Profil Text
- Profiltext - Anzeige des Textprofils an den Seiten des Diagramms. Hot-Key "V"
- Profiltext Farben x6
- Profile Text Show Rows - Legen Sie eine Grenze für die maximale Anzahl der anzuzeigenden TPO Zeilen fest
- Profiltext erster Buchstabe - Startzeichen für TPO-Buchstaben (A)
Zusammenfassungstext
- Zusammenfassungstext Schriftart, Größe, Positionen
- Zusammenfassungstext Composite Day Text
Hot Keys
- Tastenkombinationen - Dialogfeld Tastenkombinationen anzeigen. Tastenkürzel "H"
- Tastenkombinationen Textgröße, Positionen
- Hot-Key-Map - Tastatur-Hot-Key-Eingabe-Map - Ermöglicht dem Benutzer, die Hot-Keys neu zuzuweisen
Andere Parameter
- Instanz-ID - Eindeutige ID für mehrere Instanzen pro Diagramm
- Calculator Tpo Size Factor - Normale/große TPO-Skalierung. Hotkey "T"
- Calculator Value Area Percent - TPO innerhalb des Wertebereichs (70%)
- Calculator Value Area Detection - Equal Hi/Low Method - Methodik bei gleichem TPO oberhalb/unterhalb des POC
- Calculator Recalculate Tolerance (Percent TPO Size) - Schedules, Overall - Control price recalc triggers
- Konfiguration Voreinstellungen - Gesamtvolumenintervalle - Überschreibung für Voreinstellungen
- Profile End Realtime Colour Early (mins) - Vorzeitiges Beenden des sich entwickelnden Profils
- Backtest-Modus-Ablaufzeit (Min.) - Automatische Deaktivierung des Backtests
- GMT-Offset - Use Daylight Savings (Sommerzeit) - Sommerzeit verwenden. Passen Sie die Zeit im März/September um 1 Stunde an.
- GMT-Offset - Manueller GMT-Offset in Sekunden


Amazing tool! I love the ability to switch between, sessions, daily, weekly and quarterly profiles instantly.