Laguerre VIX Trend Extrema
- Indikatoren
-
Libertas LLC
 Libertas LLC is a software company by enterprising math nerds. We make high quality and complex mathematical tools in a user-friendly and easy to use package for retail investors.
 - Version: 1.5
- Aktualisiert: 1 Dezember 2021
- Aktivierungen: 20
Der Laguerre VIX Trend Extrema (LVTE) Indikator erkennt Höchst- und Tiefststände des Marktes. Wie der Name schon sagt, ist der LVTE ein prozentualer Preisoszillator, der extreme Bereiche im Marktpreis identifiziert.
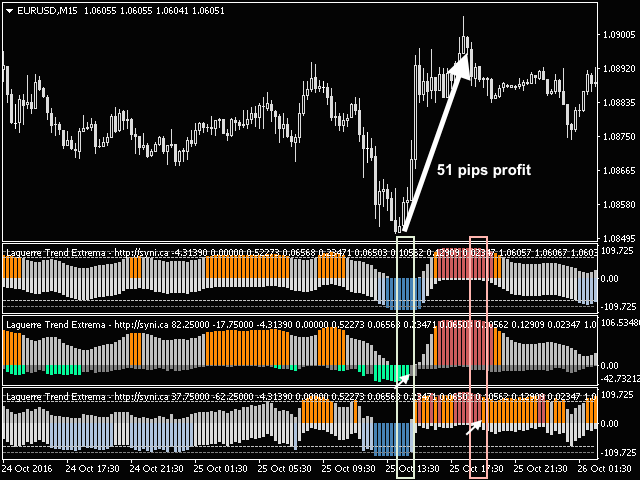
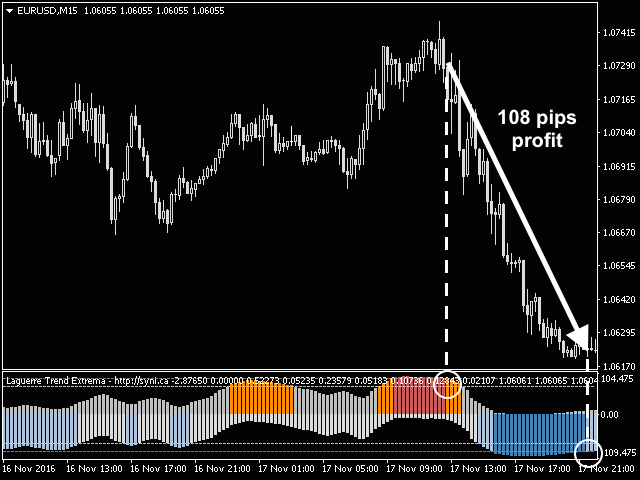
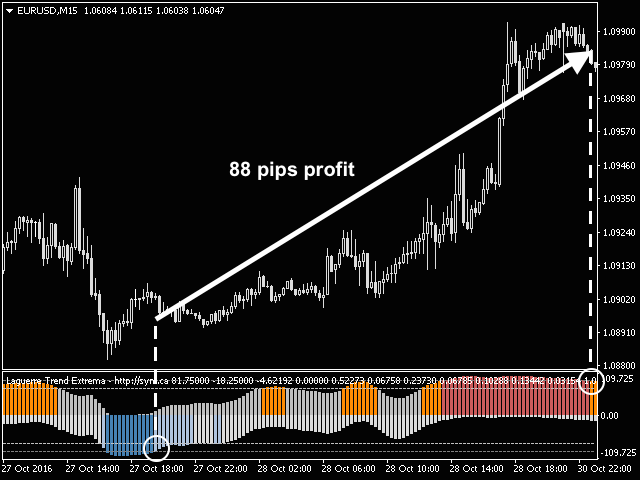
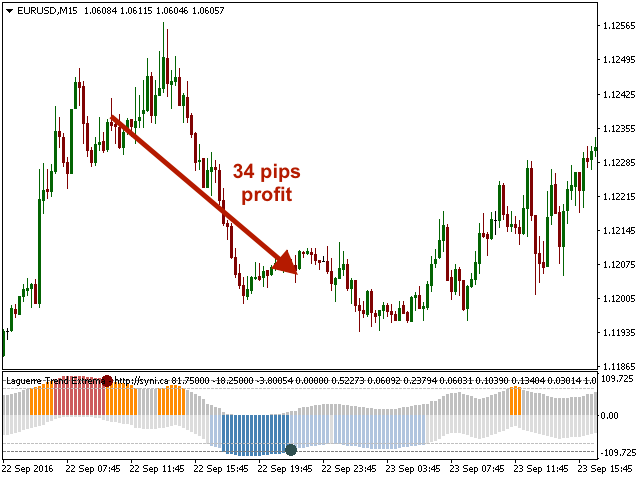
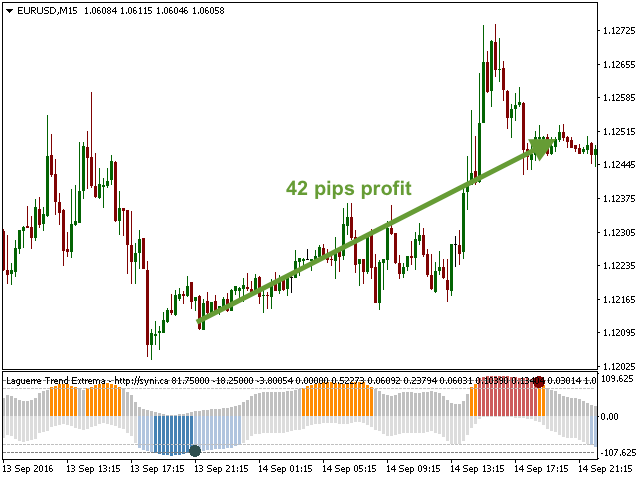
How to use: Buy when the indicator was in the lower "blue" range for more than 2 candles, and then moves up into grey. Sell when the indicator was in the upper "red" range, and then moves down into orange. Please see screenshots for examples!
Der Einfachheit halber kann der Indikator dies durch das Malen von "Punkten" an den Stellen anzeigen, an denen Sie ein- oder aussteigen müssen (Draw maxima offset dots = True)
Wie in John F. Ehlers Buch "Cybernetic Analysis for Stocks and Futures" beschrieben , kann die Einbeziehung der Laguerre-Gleichung eine fortgeschrittenere Trenderkennung und glattere Filter ermöglichen, während weniger Daten benötigt werden. Hier verwenden wir mehrere Varianten der Laguerre-Gleichung für eine robuste Erkennung von Preismaxima und -minima. Wir beziehen auch den modifizierten VIX Fix(wie hier gezeigt) ein, der die Anlegerstimmung widerspiegelt, um die Erkennung von Markttiefs weiter zu verbessern.
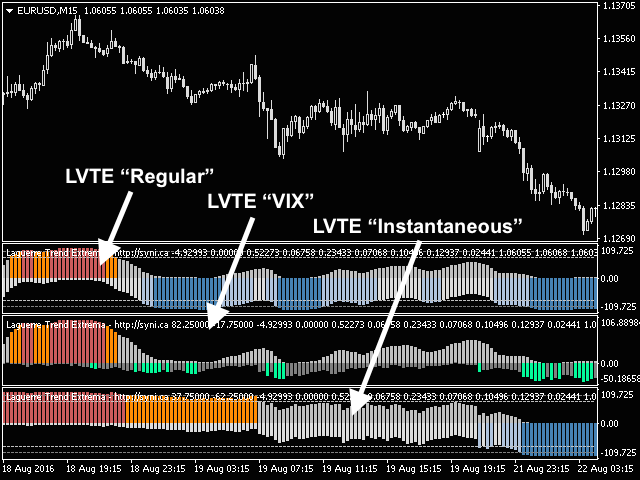
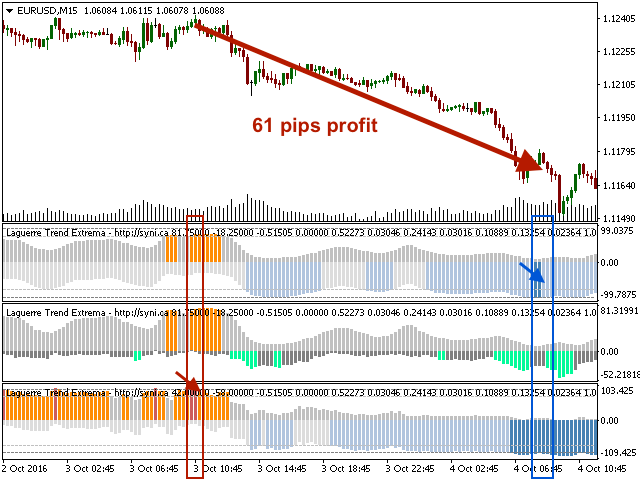
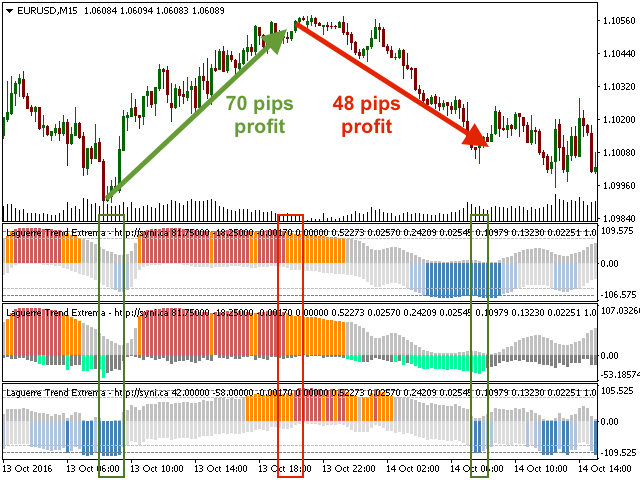
Der LVTE verfügt über drei Algorithmusvarianten (Regular, VIX, Instantaneous), die einzeln verwendet oder zur Bestätigung eines Höchst- oder Tiefstkurses gleichzeitig angezeigt werden können. Er lässt sich auf hellem und dunklem Hintergrund gleichermaßen gut darstellen. Eine gute Möglichkeit besteht darin, die 3 LVTE-Varianten gleichzeitig zu betrachten und eine von 2 Strategien zu verfolgen:
- Konservativer Ansatz: Suchen Sie nach gleichzeitigen bestätigenden Signalen in 2-3 der Varianten. Wie oben unter "Anwendung" beschrieben, bedeutetein bestätigendes Signal, dass mindestens 2 der 3 Varianten von blau nach grau (Kauf) oder von rot nach orange (Verkauf) gewechselt haben.
- Maximieren Sie Handelsmöglichkeiten und Gewinne: Suchen Sie nach einem Kauf-/Verkaufssignal in einer der 3 Varianten. z.B. kaufen Sie, wenn eine der Varianten ein Kaufsignal zeigt, und verkaufen Sie, wenn eine der Varianten ein Verkaufssignal zeigt. Dieselbe Variante muss nicht sowohl das Kauf- als auch das Verkaufssignal anzeigen - dies erhöht die Empfindlichkeit der Strategie.
LVTE-Algorithmus-Varianten
- Regulär: Laguerre-Preisoszillator zur Erkennung von Maxima und Minima
- VIX: Regulärer LVTE für die Erkennung von Maxima, aber modifizierter VIX-Fix für die Erkennung von Minima
- Unmittelbar: Eine Variante des "normalen" Laguerre-Preisoszillators zur Maximierung der Vorwärtserkennung unter Verwendung einer verzögerungsfreien Berechnung bei gleichzeitiger Minimierung von Fehlalarmen. Dies geht jedoch auf Kosten der Glättung.
Warnungen
Für jede LVTE-Variante können Nachrichten-, Ton- und E-Mail-Benachrichtigungen aktiviert werden, wenn sich die Werte von Max- oder Min-Perioden wieder gegen 0 bewegen. Optional können Kreise gezeichnet werden (ein-/ausgeschaltet in den Parametern), die dem Einsetzen der Warnungen entsprechen.
Parameter
- Typ der LVTE-Berechnungsvariante: Regelmäßige, VIX- oder Momentan-Berechnungsarten (beschrieben in LVTE-Algorithmusvarianten oben)
- Farbschema (Standard oder UserDefine): Wählen Sie UserDefine, um die Farben des Indikators anzupassen
- Maxima-Offset-Punkte zeichnen (wahr/falsch): Bei "true" werden Punkte gezeichnet, die den Anfangszeiten der Alarme entsprechen
- Perzentilschwelle Extremwert (Standard=90.0): Legt die Max/Min-Erkennungsschwelle fest (invertiert für Min)
- Perzentilschwelle Warnwert (Standard=70.0): Definiert die Warnschwelle für Extrema (invertiert für min)
- Laguerre kurze Berechnungsperiode (Voreinstellung=0,4): Laguerre Berechnungskoeffizient
- Laguerre langer Berechnungszeitraum (Default=0.8): Laguerre Berechnungskoeffizient
- Berechnungszeitraum für Maxima-Perzentil (Default=200): # für die Berechnung verwendete Balken
- Berechnungszeitraum für das Minimalperzentil (Default=200): # für die Berechnung verwendete Balken
- Berechnungszeitraum für die Standardabweichung: # Balken, die für die Berechnung der Standardabweichung für den VIX-Schwellenwert verwendet werden
- Länge des Bollinger Bandes: # Balken, die für die Bollinger-Band-Berechnung für den VIX-Schwellenwert verwendet werden
- Bollinger-Band-Standardabweichungen: Für die Bollinger-Band-Berechnung verwendete Abweichungen
- Berechnungszeitraum für Perzentil: # Anzahl der Balken, die für den VIX-Perzentil-Schwellenwert verwendet werden
- Schwellenwert für hohes Perzentil (0,85=85%): Schwellenwert für die Erkennung des unteren Perzentils des VIX
- Alle Alarme ein-/ausschalten: Wenn falsch, werden alle Alarme verhindert
- Top-Extrema: Warnung beim Abprallen von oberen Extrema: Warnung, wenn der LVTE von oberen Extrema abprallt
- Untere Extrema: Warnung beim Abprallen von den unteren Extrema: Warnungen, wenn LVTE von unteren Extrema abprallt
- Warnmeldung einschalten: Wenn wahr, werden die Alarme in der Nachrichtenbox aktiviert
- Alarme Ton einschalten: Falls zutreffend, schaltet der Alarmton ein
- Warnmeldungen per E-Mail einschalten: Falls wahr, schaltet die E-Mail-Warnungen ein


I will give 5 stars if I can use all 3 variants simultaneously. Now I can't do that because it only give one variant option in the input parameter. Ohh I have revised my rating and now give 5 stars because it is very easy to open 3 charts simultaneously. Thank you very much.