Volume Accumulation Trend
- Indikatoren
-
Libertas LLC
 Libertas LLC is a software company by enterprising math nerds. We make high quality and complex mathematical tools in a user-friendly and easy to use package for retail investors.
 - Version: 1.0
- Aktivierungen: 20
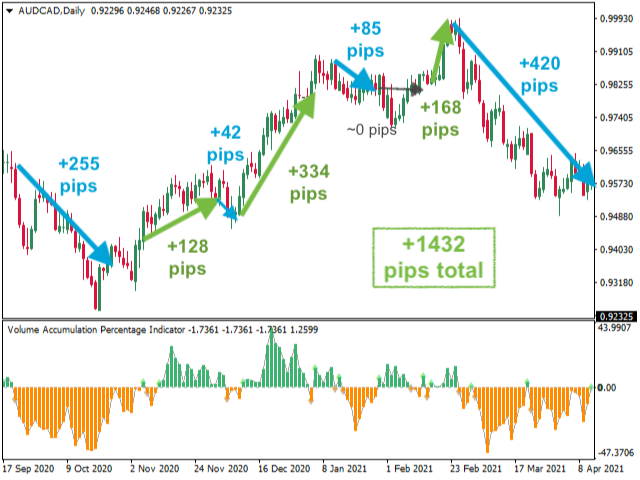
Looking for strong trend entrance and exit points of trends? This incorporates volume into price calculations for a fast entry/exit, showing how supply and demand factors are influencing price, and giving you more insights than the average trader uses.
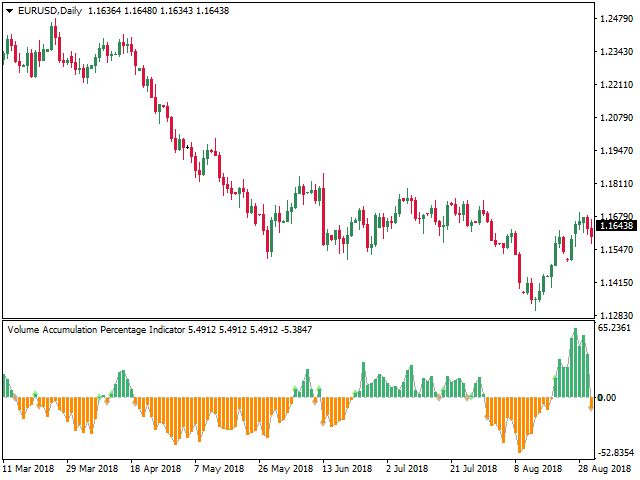
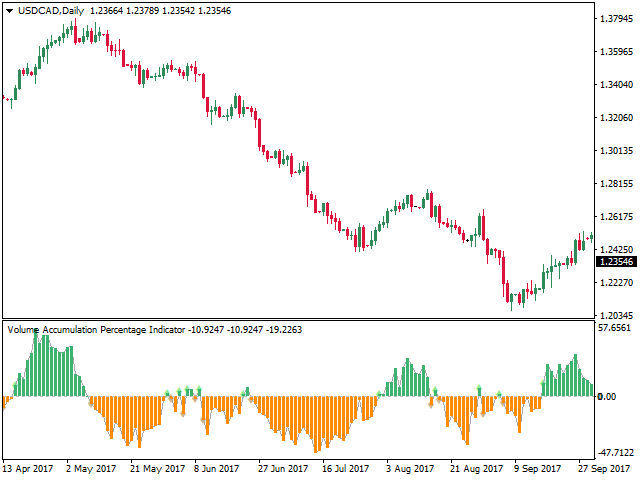
Der Volumen-Akkumulations-Trend-Indikator ist ein kumulativer Indikator, der sowohl das Volumen als auch den Preis verwendet, um zu untersuchen, ob ein Vermögenswert steigt oder fällt. Er identifiziert Unterschiede zwischen dem Preis und dem Volumenfluss, was uns erkennen lässt, wie stark ein Trend ist. Auf diese Weise können Händler Trends gewinnbringend verlassen, bevor die offensichtlichen Preissignale auftreten, auf die alle anderen achten, und haben so einen Vorteil gegenüber den meisten Händlern.
- Ein Beispiel: Obwohl der Kurs steigt, kann das Volumen hinter den Kulissen abnehmen, was darauf hindeutet, dass sich der Trend seinem Ende nähert und sich umkehrt. Im Allgemeinen bietet der Ein- und Ausstieg zu diesem Zeitpunkt ein viel besseres Timing.
Wie Sie vorgehen
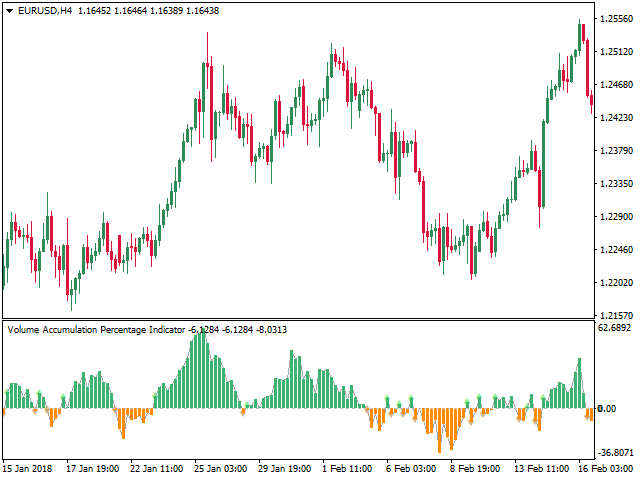
- Gehen Sie eine Long-Position ein, wenn der Indikator zum ersten Mal grün wird (und beenden Sie alle Short-Positionen).
- Gehen Sie eine Short-Position ein, wenn der Indikator zum ersten Mal rot wird (und beenden Sie alle Long-Positionen).
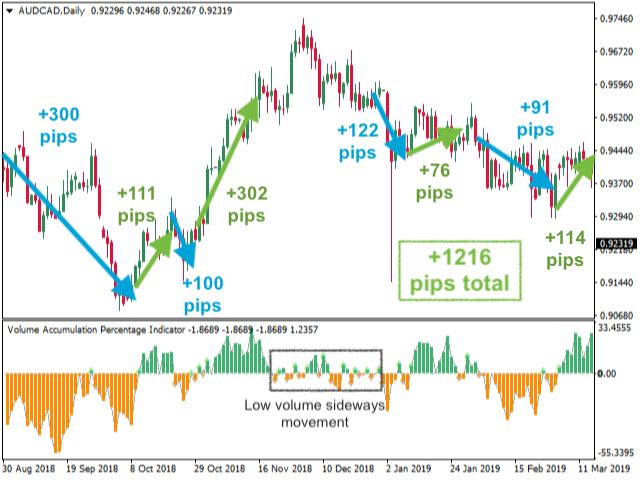
Dieser Indikator warnt gelegentlich vor schnellen Ein- und Ausstiegen, insbesondere bei Seitwärtsbewegungen auf den Märkten. Dies kann lästig sein und kann vermieden werden, indem man nicht in seitwärts gerichteten Märkten handelt (siehe unserenTrue Choppiness Direction oder Choppiness Index, um dies zu vermeiden). Insgesamt lohnt es sich aber, da dieser Indikator sehr gut darin ist,rechtzeitig Ein- und Ausstiegspunkte zu liefern, um große Kursbewegungen zu erfassen und Sie dann zum richtigen Zeitpunkt Gewinne mitnehmen zu lassen. Testen Sie die kostenlose Demo und sehen Sie, was wir meinen!
Warnungen
Nachrichten, Töne und E-Mail-Benachrichtigungen können aktiviert werden, wenn sich der Trend aufwärts oder abwärts bewegt. Die Punktindikatoren können in den Parametern ein- und ausgeschaltet und neu eingefärbt werden.
Parameter
- Zeiträume: # Intervalle, die zur Berechnung des Indikators verwendet werden
- Glättungsperioden : # Intervalle, die verwendet werden sollen, um den geglätteten EMA des Indikators anzuzeigen (als Option für bestimmte Handelsstile enthalten)
- Turn on alerts message: Wenn wahr, wird eine Warnmeldung angezeigt (wenn die Indikatorlinie das Kontrollkästchen überschreitet)
- Turn on alerts sound: Falls zutreffend, wird der Alarmton eingeschaltet( wenn die Indikatorlinie das Steuerelement kreuzt)
- E-Mail-Warnungen einschalten: Wenn wahr, wird die E-Mail-Warnungen eingeschaltet( wenn die Indikatorlinie das Steuerelement kreuzt)
- Auf neue Kerzeneröffnung warten: Bei true wird der Alarm erst bei der Eröffnung der nächsten Kerze ausgelöst (wenn eine aktuelle Kerze schnell einbricht, sich aber wieder erholt, wird so ein falsches positives Signal vermieden). Wir neigen dazu, dies nicht zu verwenden und bevorzugen einen schnelleren Einstiegspunkt, aber das hängt von Ihrem Handelsstil ab!
- Farben: Optionen, um benutzerdefinierte Farben für verschiedene Komponenten des Indikators festzulegen (Indikatorlinie, Kontrolllinie, Punkte usw.)
- Linien/Punkte anzeigen: Optionen zum Ein- oder Ausblenden von Punkt- oder Linienelementen des Indikators
iCustom
Sie können diesen Indikator in Ihren EA integrieren! Nach dem Herunterladen können Entwickler den folgenden Code verwenden, um ihn einzubinden:
iCustom(NULL,0,"Volume Accumulation Percentage Indicator",10, 10, false, false, false, false, false, false, clrGray, clrGray, clrGray, clrGray, clrGray, 0, 0); // VAP alerts for upward crossing (EMPTY_VALUE or not empty)
iCustom(NULL,0,"Volume Accumulation Percentage Indicator",10, 10, false, false, false, false, false, false, clrGray, clrGray, clrGray, clrGray, clrGray, 1, 0); // VAP alerts for downward crossing (EMPTY_VALUE or not empty)
iCustom(NULL,0,"Volume Accumulation Percentage Indicator",10, 10, false, false, false, false, false, false, clrGray, clrGray, clrGray, clrGray, clrGray, 2, 0); // VAP indicator value