Automatic Range Identifier
- Indikatoren
-
Libertas LLC
 Libertas LLC is a software company by enterprising math nerds. We make high quality and complex mathematical tools in a user-friendly and easy to use package for retail investors.
 - Version: 1.0
Free download for a limited time! We hope you enjoy, with our very best wishes during this pandemic!
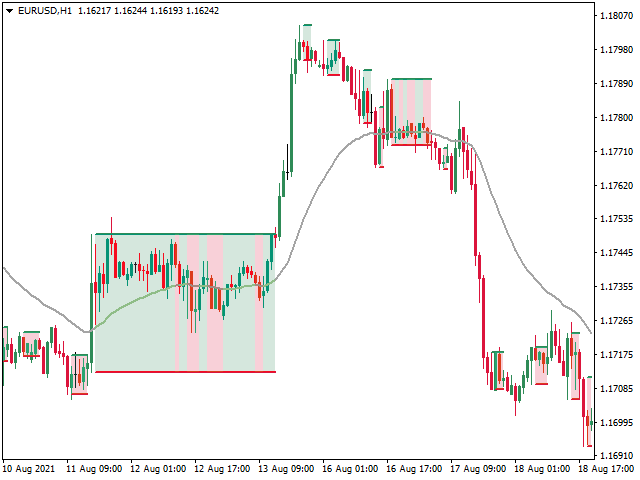
Das Problem bei der Identifizierung von Kursspannen ist, dass einige Kursspannen und -muster leicht zu übersehen sind und bei spontanen Berechnungen menschliche Fehler auftreten können. Der Automatic Range Identifier berechnet sowohl aktuelle als auch historische Kursspannen und stellt diese übersichtlich auf Ihrem Chart dar. Das Konzept ist einfach: Der Algorithmus sucht nach den jüngsten Maxima und Minima und erkennt Kursbewegungen, die sich innerhalb dieser Punkte bewegen. Dies ist auch sehr hilfreich als Ausgangspunkt für die Darstellung relevanter Unterstützungs- und Widerstandslinien.
Dies ist ein einfaches und äußerst nützliches Instrument, das jeder Händler in seinem Werkzeugkasten haben sollte.
So verwenden Sie
Wir empfehlen, die identifizierten Bereiche in verschiedenen Zeitrahmen zu überprüfen, um Ihnen die beste Perspektive auf die Kursbewegungen in dem von Ihnen gewählten Hauptzeitrahmen zu geben... höhere Zeitrahmen zeigen im Allgemeinen die stärkeren Unterstützungs- und Widerstandslinien, die sich auf Ihren Zeitrahmen auswirken können, und niedrigere Zeitrahmen können Frühwarnhinweise auf Veränderungen in der Kursbewegung geben. z.B. wenn Sie in einem 15M-Intervall handeln, stellen Sie sicher, dass Sie auch 5M und 1H überprüfen!
Parameter
- Connect ranges (default=False): Zeichnen Sie Linien und verbinden Sie Füllungen zwischen verschiedenen Bereichen für eine kontinuierliche Darstellung
- EMA anzeigen (Standard=True): EMA-Linie anzeigen
- EMA-Länge: # Balken, die zur Berechnung des EMA verwendet werden
- Bereiche hervorheben: Zeichnet eine halb-opake Füllung für identifizierte Bereiche
- Farben: Festlegung der Farben für Füllungen und Linien
- Deckkraft der Füllung: Legen Sie die Deckkraft der Füllung im Diagramm fest.


Excelente indicador.