• Übersicht
  • Bewertungen (11)
  • Diskussion (10)
  • Neue Funktionen

RSI Mirrors and Reflections

5

"Battles between bulls and bears continue to influence price development long after the combat has ended, leaving behind a messy field that observant technicians can use to manage risk and find opportunities. Apply "trend mirror" analysis to examine these volatile areas, looking for past action to impact the current trend when price turns and crosses those boundaries." - Investopedia.com
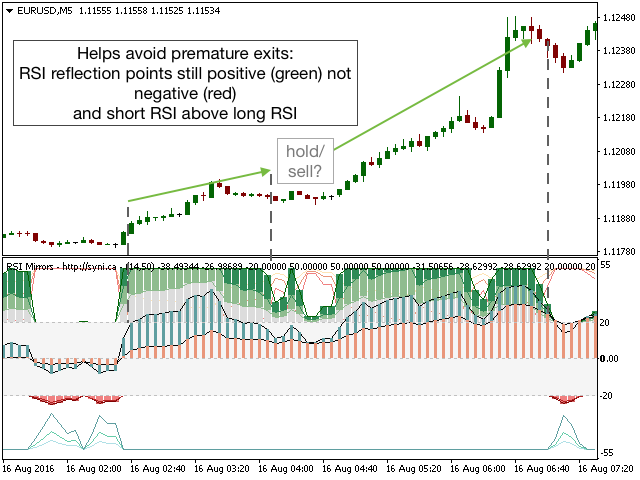
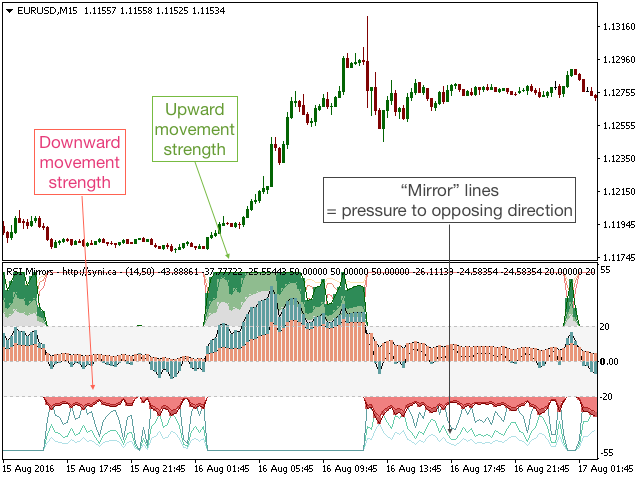
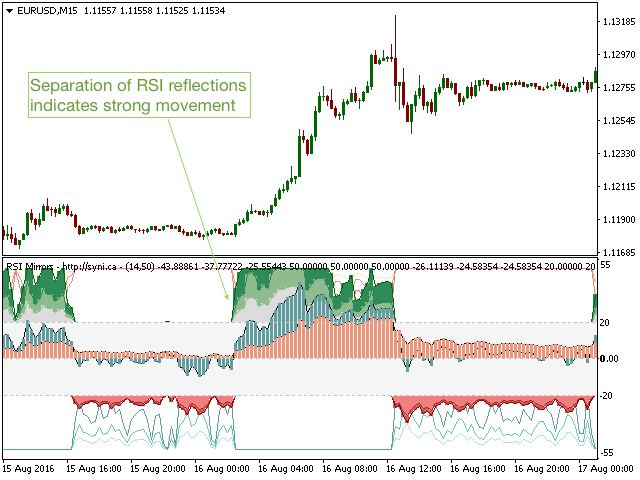
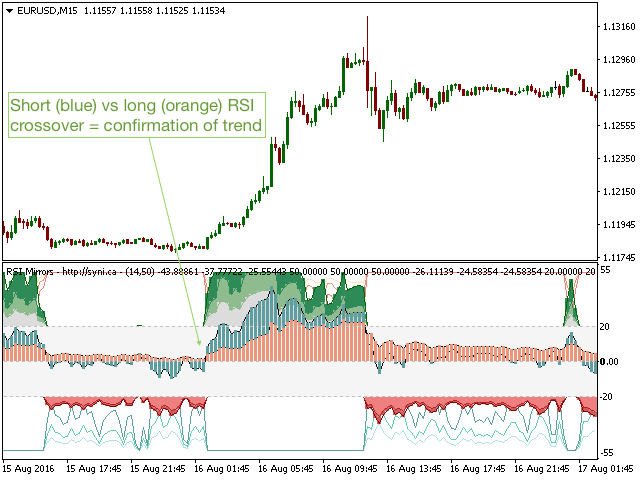
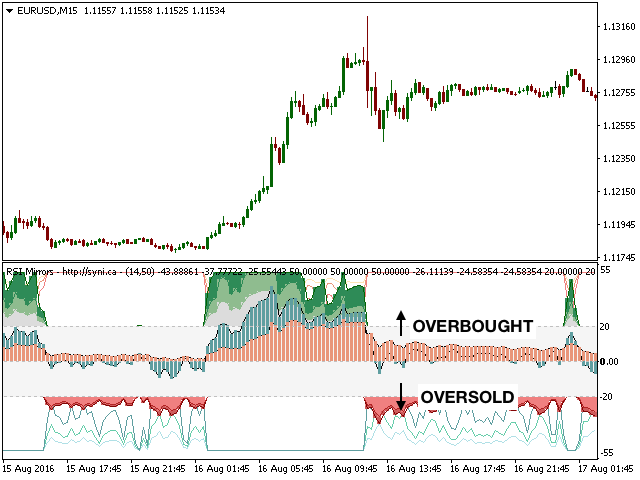
RSI Mirrors and Reflections is a robust technique using multiple RSI periods, mirrors and reflections based on RSI values to indicate the strength of price movements and reversals. Three upward and three downward RSI reflections are calculated: separation and divergence of the RSI reflections indicates a strong vs weak upcoming price movement (please see screenshots) and crossover of long-term vs short-term RSI lines is a confirmation of trend. Mirrors (lines) above and below the plot can be used in conjunction with reflections (filled bars) to track the strength of a price movement and when they are fading.

As shown in the screenshots below, RSI Mirrors and Reflections can be used to identify strong price movements, track the trend and avoid premature exit which would be tempting if only using candlesticks or more limited indicators. In addition to its stand-alone use, this extremely flexible indicator can be used to supplement trading strategies in any timeframes and assets. This pairs well with MACD and moving averages.


Parameters

  • RSI Period 1 (Default=14): Calculation period for short-term RSI
  • RSI Period 2 (Default=50): Calculation period for long-term RSI
  • Plot RSI Reflection Lines (Default=true): Plot trend lines through the filled reflection bars to help visualization
  • Plot RSI Mirror Lines (Default=true): Plot RSI mirror values
  • Reflection bar width (Default=4): Adjust the width of all reflection bars at once

To facilitate plotting, RSI values are set to oscillate between -50 and 50, not 0 and 100.

Bewertungen 11
shams201
114
shams201 2022.06.27 23:59 
 

nice work

Martin Rác
25
Martin Rác 2020.10.16 19:38 
 

The best RSI indicator, very professional...

Aravind Kolanupaka
8820
Aravind Kolanupaka 2020.10.10 00:31 
 

this one is indispensable.

Empfohlene Produkte
The Transition Trend indicator shows the points of potential market reversal. The indicator's smart algorithm detects the trend, filters out market noise and generates entry signals and exit levels. Simple, visual and efficient trend detection. Uses just one parameter for settings. The indicator does not redraw and does not lag. You can set up message alerts as sound or email. Works on all currency pairs and all timeframes. Ready-made trading system.
VaviStar is an indicator based on trend retracements determined by ZigZag segments. It is theorized, and statistics confirm, that stocks react to certain retracement levels. Many use Fibonacci retracement levels (23.6%, 38.2%, 61.8%). It is assumed that once the price goes beyond the 61.8% retracement, we can already speak of a trend reversal. This indicator allows you to comfortably chart a segment of the ZigZag with the relative operating levels chosen. With a reversal mindset , you can use it
KT DMA is a modified and advanced version of the classic Displaced Moving Averages with buy/sell crossover alerts and a Multi-Timeframe scanner that shows DMA's direction across each real-time time frame. A Displaced Moving Average is a simple moving average that moves ahead or backward in a time frame (either short-term or long-term). It also allows you to predict price movement more accurately. Features Depicts the trend direction using the alignment of three moving averages. Buy/Sell signa
Super Trend Channels MT4 Indicator Looking for a versatile and powerful channel indicator for your MetaTrader 4 trading platform? Look no further than the "Super Trend Channels" indicator! This advanced tool is designed to help traders identify trend channels accurately, enabling you to make informed trading decisions with confidence. Key Features: Multi-Channel Support: The "Super Trend Channels" indicator supports multiple channels simultaneously. You can visualize various channel types, inclu
Projection Trend - a Forex arrow indicator without redrawing does not change its signals when the market situation changes, does not adjust to the chart. The signals given by him are unambiguous. Traders build a trading system that provides good signals 80-90% of the time. The indicator showing the points of entry and exit from the market with arrows is able to bring results not only in the Forex market, but also when working with binary options. You can buy it and install it in MetaTrader yo
TrendScanner XTra scans market trends from Multi Symbols and Multi Timeframes with extra additional Entry Point Signals arrow on the current chart. Features: -Entry Point SIgnals :  This is additional feature in the indicator. No repaint arrows. The Trading system in the single indicator. MTF Trend informations and Entry Signals. In order to make it easier for trader to get trading moments from a single chart and  deciding entry time.  -Changeable Panel Display :  Change the value of Max.Symbo
This indicator is designed to detect the best of all candlestick reversal patterns: Three Line Strike . According to the bestselling author and candlestick guru Thomas Bullkowski, this pattern has a winning percentage between 65% and 84% . This indicator scans for you up to 30 instruments (forex, indices or commodities) on up to 8 timeframes. You can get alerts via MetaTrader 4 and email if a Three Line Strike pattern occurs. Please note: Higher timeframes bring the most reliable signals. This i
Channels + S & R Indicator (CSRI) Indicator draws 3 channels (Large, Medium, Small) within bars’ range of current timeframe and pair / instrument. It can identify Support and Resistance levels within any chosen channel. Additionally Fibonacci levels can be drawn for Large Channel. All lines and levels can be customized by color and width. Identify Support and Resistance Levels for any Channel: IdentifySupportAndResistanceLevels - Identify Support and Resistance Levels IdentifySRforChannel –
The correlation coefficient reflects the relationship between two values. It shows the dependence of changes in one value on changes in another. For example, from changes in the price of EURUSD and EURNZD. The correlation coefficient in trade, currency relations is constantly changing. Special indicators of correlation help to define it, trace changes, draw correct conclusions. One of them is the Hubbles Correlator indicator. The indicator allows you to simultaneously display several other char
XFibo Auto Fibonacci
Welinton Dos Reis Goncalves
Use with disciplined risk management. Fibonacci entry system based on the golden zone 38.2 - 61.8 where the entry is confirmed at 23.6 with indications of Take Profit 3:1. Automatically plotted Fibonacci contains retracement and expansion Fibonacci in a single indicator. Up to 77% win rate with this system. FTMO challenge pass with 0.50% risk and 1.50% R:R.
Indicator Name: Signal Generator Non Repaint MT4 The arrow is non-repaint. Its a non-repaint arrow or money back guarantee. Arrow appeared after candle closed. Very accurate. Time Frame: Any Assets: Any This is MT5 version I use this to trade Gold, US30, Nasdaq and Dax at New York and London Opening. TF m5/m15 Parameters: Push Notifications = True ( You can set the alert send to your mobile phone) To Setup Sending Alert to your mobile phone 1. At Metatrader Options > Options > Notifications >
Fibonacci strategies EA trades Fibonacci levels. You can choose whether the EA should trade a manually plotted fibonacci or whether it should automatically plot a fibonacci. In automatic fibonacci drawing mode, the EA automatically plots a fibonacci retracement based on the number of bars you select on the BarsToScan setting in the indicator. The fibonacci is automatically updated in real time as new highest and lowest values appears amongst the selected bars. You can select which level values
ForexGumpUltra
Andrey Kozak
3.25 (4)
ForexGumpUltra is a new and more advanced indicator of the ForexGump series. This indicator easily determines the price direction on any currency pair and any timeframe. The indicator draws its signals on the zero bar and does not redraw them (see the video). In the 34th second of the video it can be seen that this indicator uses new filters to determine the changes in price movement direction without delay, despite the market noise present at the moment (see the video on the 34th second). Once
A trading range takes place when a financial instrument (stocks, indices, bonds, commodities, Forex currencies or cryptocurrencies) oscillates between two upwards and downwards boundaries for a period of time. This Indicator tool help us to view range on the chart bar per bars, also set range in percent and get clean posicion.  Range trading works best in the absence of a trend. When the markets lack a clear direction, that’s when these consolidation periods settle in. Alternatively, more exper
Buffer Reader
Mounir Cheikh
4.25 (4)
The Buffer Reader will help you to check and export the custom indicators buffers data for your current chart and timeframe. You can select the number of buffer and historical bars to read/export. The data can be exported in a CSV format and the files will be stored in the folder: \MQL4\Files . How it works Put the number of buffers to read in the Buffers_Total input parameter. Put the number of rows to display in the Rows_Total. Choose the CSV separator in the parameter. Copy the correct name
FREE
COGO Hunter MT4
Mr Anucha Maneeyotin
CoGo Hunter Strategy Trade Base On Elliott wave and Fibonacci expansion, Fibonacci retracement And RSI Fibonacci expansion Are Used Target price Eillot wave logic use for forecast price Fibonacci retracement Are Used zone price and wave CoGo Hunter use time frame week for forecast Eillot wave Features No martingale Hard stop loss and take profit for each position Flexible stop loss by Bollinger Band, Fixed point, Previous Height or Low, Fibonacci level Flexible Take profit bet
XLines MT4
Farid Shyhaliev
5 (2)
X-Lines 2.0 Pro I want to present for your attention a new and completely updated and expanded version of X-Lines indicator. Version 2.0 Pro has many new features and can make your analysis more productive. Please read full instructions here . Please before purchasing try free version. Free and limited version (you can set only one alert): here 1) Multi-timeframe settings and user-friendly control panel. You can dynamically select and save indicator settings not only for each currency
Werden Sie Breaker Trader und profitieren Sie von Änderungen der Marktstruktur, wenn sich der Preis umkehrt. Der Order Block Breaker Indikator zeigt an, wann sich eine Trend- oder Preisbewegung der Erschöpfung nähert und bereit ist, sich umzukehren. Es weist Sie auf Änderungen in der Marktstruktur hin, die normalerweise auftreten, wenn eine Umkehrung oder ein größerer Rückzug bevorsteht. Der Indikator verwendet eine proprietäre Berechnung, die Ausbrüche und Preisdynamik identifiziert. Jedes
Stardust
Evgeniy Zhdan
StarDust searches for divergences in the values of several indicators considering them as signs of flat and enters the market if a relatively steady trend is detected. The Expert Advisor trades "basic" symbols with a low spread. The best results are achieved on М15. The EA automatically adjusts to 4 and 5-digit quote flows. Settings Comment_to_orders – comment to a placed order. The field can be left blank if no comment is required. MM – enable money management with automatic setting of a work
Contact me for instruction, any questions! Introduction Chart patterns   are an essential tool traders and investors use to analyze the future price movements of securities. One such pattern is the triple bottom or the triple top pattern, which can provide valuable insights into potential price reversals. This pattern forms when a security reaches a low   price level   three times before reversing upward or reaches a high price level three times before reversing downward.   Triple Top Bottom
Wir stellen vor: Market Structure Break Out für MT4 – Ihr professioneller MSB- und ununterbrochener Zonen-Indikator  Treten Sie dem  Koala Trading Solution Channel  in der mql5-Community bei, um die neuesten Nachrichten zu allen Koala-Produkten zu erfahren. Der beigefügte Link führt Sie dorthin: https://www.mql5.com/en/channels/koalatradingsolution Market Structure Break Out: Ihr Weg zu einer reinen Analyse der Marktwellen Dieser Indikator ist darauf ausgelegt, die Marktstruktur und Bewegung
Inficator MT4 : HiLo Objective : Find Support and Resistance zone How to set up Indicator   HiLo : 1. Indicators type multi time frame are MN1 W1 D1 H4. 2. Customize for use MN1 only or W1 only or D1 only or H4 only or open all. 3. We use MN1 and W1 for set to Key level. 4. For Close price or Open price to high price set for  Resistance zone. 5. For  Close price or Open price to Low price set for  Support zone. How to trade for success : Entry point : Buy / Long position 1. Price bid hit the
TrendSurfer OsMa
Augustine Kamatu
2 (1)
Introducing TrendSurfer OsMa: Elevating Your Forex Trading Experience. TrendSurfer OsMa is a cutting-edge automated trading system meticulously crafted to harness the power of the MetaTrader 4 indicator, Moving Average of Oscillator (OsMa), revolutionizing your approach to forex trading. The Moving Average of Oscillator (OsMa) is a derivative of the MACD (Moving Average Convergence Divergence) indicator. It represents the difference between the MACD line and its signal line. The OsMa provid
Fibonacci Sniper
Elmira Memish
5 (3)
Fibonacci Sniper MT4 - No Repaint Features:  - Indicator sends signals and notifications on key Fibonacci Retracement and Fibonacci Extensions Levels - Once the buy/sell signal is set, targets ( TP1 TP2 TP3 )and stop loss levels are drawn by the indicator. - Fibonacci Calculations and Custom Patterns are identified by the last 3 or 5 Zig Zag exterum. - You can easily identify key harmonic patterns like Gartley, Bat, Butterfly and Crab patterns. Important Settings:  - Choose the Zig
For this set of indicators 1. General information     - Calculates with high performance mathematical algorithms.     - Calculated from the price of candles     - The entry point of this order is filtered by the train EMA and the oscillator.     - Calculate the integrity of the candle 2. How does it work?     - You can see two types of order entry points: the notification on the monitor and the arrow.     - You can trust 75-95 percent of this entry point. 3. Settings     - A complete candle
Description Better version of RSI indicator which offer a complete visual trading strategy and realize an auto-optimization Support:   We create great tools for the entire trading community. Most of them are free. If you believe in what we do  Support Us Here.   KEY LINKS:   How to Install  –  Frequent Questions  -  All Products  How is this indicator useful? NEVER repaints. Detect best parameters of RSI indicator, based on profit factor during the specified period. This indicator can be used as
After the purchase, the current year free indicator, please contact me for your version As a bonus to the purchase, 3 months access to https://www.mql5.com/en/market/product/78772?source=Unknown%3Ahttps%3A%2F%2Fwww.mql5.com%2Fen%2Fmarket%2Fmy Fibonacci retracement This indicator is based on use of Fibonacci retracement. I use Fibonacci levels for last year for important levels, where market stops and turns. These levels are important Price Action levels and market respect them. I do not us
This indicator is used to determine the trend. Standard Three Moving Average and ADX indicators are used. It has the indicator warning system (audio, e-mail) and three types of alerts, including messages to mobile phone. It shows the best performance on M5. When the trend value reaches the value set, the warning system is activated. This indicator works only with Forex symbols. Inputs SoundAlarm = true - Sound Alert Sendmail=true - Send an e-mail in case of a buy or sell signal Sendnotificatio
KT Price Border MT4
KEENBASE SOFTWARE SOLUTIONS
KT Price Border creates a three-band price envelope that identifies potential swing high and low areas in the market. These levels can also be used as dynamic market support and resistance. The mid-band can also be used to identify the trend direction. As a result, it also functions as a trend-following indicator. In addition, its ease of use and more straightforward conveyance of trade signals significantly benefit new traders. Features It works well on most of the Forex currency pairs. It
Trend Slow
Maryna Shulzhenko
The Trend Slow indicator uses the author's algorithm for analyzing price behavior and displays the result of complex work in the form of lines. For simplicity, the algorithm automatically changes the line color according to its direction. The indicator has a parameter to enable alerts when the color changes, thus helping the trader to identify new market trends. This system will help you find high-probability trades in the direction of strong trends.
Käufer dieses Produkts erwarben auch
Gann Made Easy
Oleg Rodin
4.96 (45)
Gann Made Easy ist ein professionelles und einfach zu bedienendes Forex-Handelssystem, das auf den besten Handelsprinzipien unter Verwendung der Theorie von Mr. basiert. W.D. Gann. Der Indikator liefert genaue KAUF- und VERKAUFSsignale, einschließlich Stop-Loss- und Take-Profit-Levels. Mit PUSH-Benachrichtigungen können Sie auch unterwegs handeln. Bitte kontaktieren Sie mich nach dem Kauf! Ich werde meine Handelstipps und tolle Bonusindikatoren kostenlos mit Ihnen teilen! Wahrscheinlich haben Si
Atomic Analyst
Issam Kassas
5 (1)
Zunächst einmal ist es erwähnenswert, dass dieser Handelsindikator nicht neu malt, nicht neu zeichnet und keine Verzögerung aufweist, was ihn sowohl für manuellen als auch für Roboterhandel ideal macht. Der Atom-Analyst ist ein PA-Preisaktionsindikator, der die Stärke und das Momentum des Preises nutzt, um einen besseren Vorteil auf dem Markt zu finden. Ausgestattet mit fortschrittlichen Filtern, die helfen, Rauschen und falsche Signale zu entfernen, und das Handelspotenzial zu erhöhen. Durch
Scalper Vault
Oleg Rodin
5 (27)
Scalper Vault ist ein professionelles Scalping-System, das Ihnen alles bietet, was Sie für erfolgreiches Scalping benötigen. Dieser Indikator ist ein komplettes Handelssystem, das von Forex- und Binäroptionshändlern verwendet werden kann. Der empfohlene Zeitrahmen ist M5. Das System liefert Ihnen genaue Pfeilsignale in Richtung des Trends. Es liefert Ihnen auch Top- und Bottom-Signale und Gann-Marktniveaus. Die Indikatoren bieten alle Arten von Warnungen, einschließlich PUSH-Benachrichtigungen.
TPSproTREND PrO
Roman Podpora
5 (15)
TPSpro TRENDPRO  - is a trend indicator that automatically analyzes the market and provides information about the trend and each of its changes, as well as giving signals for entering trades without redrawing! The indicator uses each candle, analyzing them separately. referring to different impulses - up or down impulse. Exact entry points into transactions for currencies, crypto, metals, stocks, indices!  -  Version MT5               DETAILED DESCRIPTION        /       TRADING SETUPS           
Trend Screener
STE S.S.COMPANY
4.83 (86)
Trendindikator, bahnbrechende, einzigartige Lösung für Trendhandel und -filterung mit allen wichtigen Trendfunktionen in einem Tool! Es handelt sich um einen 100 % nicht neu zu malenden Multi-Timeframe- und Multi-Währungs-Indikator, der für alle Symbole/Instrumente verwendet werden kann: Forex, Rohstoffe, Kryptowährungen, Indizes und Aktien. Trend Screener ist ein effizienter Trendfolgeindikator, der Pfeiltrendsignale mit Punkten im Diagramm liefert. Die Funktionen, die im Trendanalysator-Indika
Wir stellen vor       Quantum Trend Sniper Indicator   , der bahnbrechende MQL5-Indikator, der die Art und Weise, wie Sie Trendumkehrungen erkennen und handeln, verändert! Entwickelt von einem Team erfahrener Händler mit über 13 Jahren Handelserfahrung,       Quantum Trend Sniper-Indikator       wurde entwickelt, um Ihre Trading-Reise mit seiner innovativen Methode zur Identifizierung von Trendumkehrungen mit extrem hoher Genauigkeit auf ein neues Niveau zu heben. ***Kaufe Quantum Trend Snipe
Zunächst einmal ist es wichtig zu betonen, dass dieses Handelstool ein Nicht-Repaint-, Nicht-Redraw- und Nicht-Verzögerungsindikator ist, was es ideal für professionelles Trading macht. Der Smart Price Action Concepts Indikator ist ein sehr leistungsstarkes Werkzeug sowohl für neue als auch erfahrene Händler. Er vereint mehr als 20 nützliche Indikatoren in einem und kombiniert fortgeschrittene Handelsideen wie die Analyse des Inner Circle Traders und Strategien des Smart Money Concepts. Diese
DERZEIT 26% RABATT Die beste Lösung für jeden Newbie oder Expert Trader! Dieser Indikator ist ein einzigartiges, qualitativ hochwertiges und erschwingliches Trading-Tool, da wir eine Reihe von proprietären Funktionen und eine neue Formel integriert haben. Mit nur EINEM Chart können Sie die Währungsstärke für 28 Forex-Paare ablesen! Stellen Sie sich vor, wie sich Ihr Handel verbessern wird, weil Sie in der Lage sind, den genauen Auslösungspunkt eines neuen Trends oder einer Scalping-Gelegenh
TPSpro RFI Levels
Roman Podpora
5 (13)
A key element in trading is zones or levels from which decisions to buy or sell a trading instrument are made. Despite attempts by major players to conceal their presence in the market, they inevitably leave traces. Our task was to learn how to identify these traces and interpret them correctly. Reversal First Impulse levels (RFI)   -  Version MT5                INSTRUCTIONS                 RUS                 ENG                                       R ecommended to use with an indicator   -  
Advanced Supply Demand
Bernhard Schweigert
4.92 (310)
Derzeit 33% Rabatt! Die beste Lösung für jeden Anfänger oder erfahrenen Händler! Dieser Indikator ist ein einzigartiges, qualitativ hochwertiges und erschwingliches Trading-Tool, da wir eine Reihe von proprietären Funktionen und eine neue Formel integriert haben. Mit diesem Update werden Sie in der Lage sein, doppelte Zeitrahmenzonen anzuzeigen. Sie können nicht nur einen höheren TF (Zeitrahmen) anzeigen, sondern sowohl den Chart-TF als auch den höheren TF: SHOWING NESTED ZONES. Alle Supply Dema
Entry Points Pro
Yury Orlov
4.7 (224)
Dies ist ein Indikator für MT4, der genaue Signale für den Einstieg in einen Handel ohne Repainting (Neuzeichnen) liefert. Er kann auf alle Finanzwerte angewendet werden: Forex, Kryptowährungen, Metalle, Aktien, Indizes. Er liefert ziemlich genaue Schätzungen und sagt Ihnen, wann es am besten ist, eine Position zu eröffnen und zu schließen. Sehen Sie sich das Video (6:22) mit einem Beispiel für die Verarbeitung nur eines Signals an, das sich für den Indikator gelohnt hat! Die meisten Händler ver
Scalper Inside PRO
Alexey Minkov
4.75 (55)
SALE NOW! Limited Time Offer! An exclusive indicator that utilizes an innovative algorithm to swiftly and accurately determine the market trend. The indicator automatically calculates opening, closing, and profit levels, providing detailed trading statistics. With these features, you can choose the most appropriate trading instrument for the current market conditions. Additionally, you can easily integrate your own arrow indicators into Scalper Inside Pro to quickly evaluate their statistics and
Entdecken Sie das Geheimnis des erfolgreichen Forex -Handels mit unserem benutzerdefinierten MT4 -Indikator! Haben Sie sich jemals gefragt, wie Sie Erfolg auf dem Forex -Markt erzielen können und gleichzeitig Gewinne erzielen und gleichzeitig das Risiko minimieren können? Hier ist die Antwort, nach der Sie gesucht haben! Erlauben Sie uns, unseren proprietären MT4 -Indikator vorzustellen, der Ihren Handelsansatz revolutionieren wird. Einzigartige Vielseitigkeit Unser Indikator ist speziell
TrendMaestro
Stefano Frisetti
5 (2)
note: this indicator is for METATRADER4, if you want the version for METATRADER5 this is the link: TRENDMAESTRO recognizes a new TREND in the bud, he never makes mistakes. The certainty of identifying a new TREND is priceless. DESCRIPTION TRENDMAESTRO identifies a new TREND in the bud, this indicator examines the volatility, volumes and momentum to identify the moment in which there is an explosion of one or more of these data and therefore the moment in which prices have strong probability of f
Derzeit 20% Rabatt! Die beste Lösung für jeden Neueinsteiger oder Expert Händler! Dieses Dashboard arbeitet mit 28 Währungspaaren. Es basiert auf 2 unserer Hauptindikatoren (Advanced Currency Strength 28 und Advanced Currency Impulse). Es bietet einen hervorragenden Überblick über den gesamten Forex-Markt. Es zeigt die Werte der Advanced Currency Strength, die Veränderungsrate der Währungen und die Signale für 28 Devisenpaare in allen (9) Zeitrahmen. Stellen Sie sich vor, wie sich Ihr Hande
Präsentation des Miraculous Forex Indikators: Entfesseln Sie die Kraft präzisen Tradings Sind Sie es leid, nach dem besten Forex-Indikator zu suchen, der wirklich herausragende Ergebnisse in allen Zeitebenen liefert? Suchen Sie nicht weiter! Der Miraculous Forex Indikator ist da, um Ihre Trading-Erfahrung zu revolutionieren und Ihre Gewinne auf neue Höhen zu bringen. Basierend auf modernster Technologie und jahrelanger sorgfältiger Entwicklung steht der Miraculous Forex Indikator als Höhepunkt v
FX Power MT4 NG
Daniel Stein
5 (8)
Erhalten Sie Ihr tägliches Marktupdate mit Details und Screenshots über unser Morning Briefing hier auf mql5 und auf Telegram ! FX Power MT4 NG ist die nächste Generation unseres langjährig sehr beliebten Währungsstärkemessers FX Power. Und was bietet dieser Stärkezähler der nächsten Generation? Alles, was Sie am ursprünglichen FX Power geliebt haben PLUS GOLD/XAU-Stärkeanalyse Noch präzisere Berechnungsergebnisse Individuell konfigurierbare Analysezeiträume Anpassbares Berechnungslimit für noc
MEHRWÄHRUNGS- und MULTITIMEFRAME-KAUF- UND VERKAUFSALARM. AUTO TRAILING STOP UND RISIKO REWARD TAKEPROFIT! Der Indikator scannt und analysiert den Markt, sodass Sie nichts zu tun haben! HANDELN SIE ALLE IHRE WÄHRUNGEN AUF EINEM CHART!   Bitte hinterlassen Sie nach dem Kauf einen Kommentar, kontaktieren Sie mich und ich sende Ihnen den Handelsassistenten EA. Der Indikator verwendet mehrere Oszillatoren und angeschlossene Filter, um die besten BESTÄTIGTEN Einstiegspunkte zu finden, sodass S
Quantum Breakout Indicator PRO
Bogdan Ion Puscasu
4.96 (26)
Wir stellen vor       Quantum Breakout PRO   , der bahnbrechende MQL5-Indikator, der die Art und Weise, wie Sie mit Breakout-Zonen handeln, verändert!   Quantum Breakout PRO   wurde von einem Team erfahrener Händler mit über 13 Jahren Handelserfahrung entwickelt und soll Ihre Handelsreise mit seiner innovativen und dynamischen Breakout-Zonen-Strategie auf ein neues Niveau bringen. Der Quantum Breakout Indicator zeigt Ihnen Signalpfeile auf Breakout-Zonen mit 5 Gewinnzielzonen und Stop-Loss
PRO Renko System ist ein hochpräzises Handelssystem, das speziell für den Handel mit RENKO-Charts entwickelt wurde. Dies ist ein universelles System, das auf verschiedene Handelsinstrumente angewendet werden kann. Das System neutralisiert effektiv so genannte Marktgeräusche, die Ihnen Zugang zu genauen Umkehrsignalen geben. Der Indikator ist sehr einfach zu bedienen und hat nur einen Parameter, der für die Signalerzeugung verantwortlich ist. Sie können das Tool einfach an jedes Handelsinstr
TrendDecoder Premium
Christophe, Pa Trouillas
5 (3)
Identifizieren Sie Bereiche und die nächsten wahrscheinlichen Bewegungen   |  Erhalten Sie früheste Signale und die Stärke von Trends   |  Klare Ausstiegssignale vor Umkehrung   |  Erkennen Sie die Fibo-Levels, die der Kurs testen wird Indikator, der nicht zurückverfolgt, nicht verzögert - ideal für den manuellen und automatisierten Trading - geeignet für alle Vermögenswerte und Zeiteinheiten Zeitlich begrenztes Angebot   >> 50% OFF Nach dem Kauf,   bitte kontaktieren Sie mich auf diesem Kanal  
Currency Strength Wizard ist ein sehr leistungsstarker Indikator, der Ihnen eine Komplettlösung für erfolgreichen Handel bietet. Der Indikator berechnet die Stärke dieses oder jenes Forex-Paares anhand der Daten aller Währungen in mehreren Zeitrahmen. Diese Daten werden in Form von benutzerfreundlichen Währungsindizes und Währungsstärkelinien dargestellt, anhand derer Sie die Stärke dieser oder jener Währung erkennen können. Sie müssen lediglich den Indikator an das Diagramm anhängen, mit dem Si
Trend Forecasting
Mohamed Hassan
5 (15)
This indicator is unstoppable when combined with our other indicator called Katana. After purchase, send us a message and you could get Katana for FREE as a BONUS After purchase, send us a private message for your instructions.  MT5 version: click here There are limited copies available at $55. Next price is $105. Don't miss this great deal!  The Trend Forecasting indicator is a very unique & easy tool that is able to make prediction about future price movement based on the signal
DERZEIT 31% RABATT! Die beste Lösung für jeden Newbie oder Expert Trader! Dieser Indikator ist ein einzigartiges, qualitativ hochwertiges und erschwingliches Handelsinstrument, da wir eine Reihe von proprietären Funktionen und eine geheime Formel eingebaut haben. Mit nur EINEM Chart liefert er Alerts für alle 28 Währungspaare. Stellen Sie sich vor, wie sich Ihr Handel verbessern wird, weil Sie in der Lage sind, den genauen Auslösepunkt eines neuen Trends oder einer Scalping-Gelegenheit zu e
FX Volume
Daniel Stein
4.6 (35)
Erhalten Sie Ihr tägliches Marktupdate mit Details und Screenshots über unser Morning Briefing hier auf mql5 und auf Telegram ! FX Volume ist der ERSTE und EINZIGE Volumenindikator, der einen ECHTEN Einblick in die Marktstimmung aus Sicht eines Brokers bietet. Es bietet fantastische Einblicke in die Positionierung von institutionellen Marktteilnehmern, wie z.B. Brokern, auf dem Forex-Markt, viel schneller als COT-Berichte. Diese Informationen direkt auf Ihrem Chart zu sehen, ist der wahre Game
Shepherd Harmonic Pattern
Abdullah Alrai
4.68 (59)
Dieser Indikator erkennt harmonische Muster, die manuell oder automatisch auf dem Chart gezeichnet wurden. Sie können das Benutzerhandbuch unter diesem Link einsehen: Fügen Sie Ihre Bewertung hinzu und kontaktieren Sie uns, um es zu erhalten. Es gibt eine kostenlose Version, um dieses Produkt auf MT4 auszuprobieren. Sie können es verwenden, um Gartley- und Nenstar-Muster zu erkennen: https://www.mql5.com/en/market/product/30181 Sie können die vollständige MT4-Version von kaufen: https://www.mql5
TakePropips Donchian Trend Pro
Eric John Pajarillaga Aldana
4.82 (17)
TakePropips Donchian Trend Pro   (MT4) ist ein leistungsstarkes und effektives Tool, das mithilfe des Donchian-Kanals automatisch die Richtung des Trends erkennt und Ihnen Handelssignale für den Ein- und Ausstieg liefert! Dieser Multifunktionsindikator umfasst einen Trendscanner, Handelssignale, ein statistisches Panel, einen Screener, Handelssitzungen und ein Dashboard für den Verlauf von Warnungen. Es wurde entwickelt, um Ihnen Handelssignale zu liefern und Ihnen Stunden beim Analysieren der C
How to use Pair Trading Station Pair Trading Station is recommended for H1 time frame and you can use it for any currency pairs. To generate buy and sell signal, follow few steps below to apply Pair Trading Station to your MetaTrader terminal. When you load Pair Trading Station on your chart, Pair Trading station will assess available historical data in your MetaTrader platforms for each currency pair. On your chart, the amount of historical data available will be displayed for each currency pai
Market Structure Patterns MT4
Samuel Manoel De Souza
5 (15)
Market Structure Patterns   is an indicator based on   smart money concepts   that displays almost all of the   SMC/ICT   elements needed to take your trading decisions to the next level. Take advantage of the   alerts ,   push notifications   and   email messages   to keep informed from when an element is formed on the chart, the price crosses a level and/or enters in a box/zone. Developers can access the values of the elements of the indicator using the   global variables  what allows the aut
The 1 2 3 Pattern Scanner
Reza Aghajanpour
4.78 (54)
** All Symbols x All Timeframes scan just by pressing scanner button ** After 15 years of experience in the markets and 3 years of programming, Winner indicator is ready. I would like to share with you! *** Contact me after purchase to send you instructions and add you in "123 scanner group" for sharing or seeing experiences with other users. Introduction The 123 Pattern Scanner indicator with a special enhanced algorithm is a very repetitive common pattern finder with a high success rate . Inte
Weitere Produkte dieses Autors
"The VIX Fix is a powerful indicator that detects market bottoms for any asset " The VIX (volatility index) is a ticker symbol of implied volatility of the S&P 500, calculated by the Chicago Board Options Exchange. VIX is a popular measure of market risk, and is one of the best measures of market bottoms that currently exists. Unfortunately, it only exists for the S&P 500... The VIX Fix was published by Larry Williams in 2007, and it synthesizes a VIX volatility index for any asset (not just the
WaveTrend Momentum Oscillator is an upgrade to the popular and easy-to-use WaveTrend Oscillator. The WaveTrend Momentum Oscillator adds a momentum component to the original WaveTrend calculation, in order to provide faster and more accurate entry points during trendy market conditions. Do you prefer the original WaveTrend Oscillator? The WaveTrend Momentum Oscillator allows you to switch between momentum and original WT versions. Both provide valuable information depending on the market conditio
Two Period RSI + Alerts compares long-term and short-term RSI lines, and plots a fill between them for improved visualization. Fill is colored differently according to an uptrend (short period RSI above long period RSI) or a downtrend (short period RSI below long period RSI). Short-term RSI crossing long-term RSI adds a more robust trend confirmation signal than using single period RSI alone. This is a tool to help visualize and confirm RSI trends. We hope you enjoy! Alerts Email, message, and
Trendiness Index
Libertas LLC
5 (3)
"The trend is your friend" is one of the best known sayings in investing, because capturing large trendy price movements can be extremely profitable. However, trading with the trend is often easier said than done, because many indicators are based on price reversals not trends. These aren't very effective at identifying trendy periods, or predicting whether trends will continue. We developed the Trendiness Index to help address this problem by indicating the strength and direction of price trend
Choppiness Index
Libertas LLC
5 (1)
"Wouldn't we all love to reliably know when a stock is starting to trend, and when it is in flat territory? An indicator that would somehow tell you to ignore the head fakes and shakeouts, and focus only on the move that counts?" The Choppiness Index is a non-directional indicator designed to determine if the market is choppy (trading sideways) or not choppy (trading within a trend in either direction). It is an oscillating indicator between -50 (very trendy) and +50 (very choppy). There are man
The Relative Momentum Index (RMI) was developed by Roger Altman, and introduced in his Feb 1993 article in Technical Analysis of Stocks & Commodities magazine. As its name suggests, Relative Momentum Index adds a momentum component to the traditional RSI, designed to increase reliability by decreasing spurious oscillations between defined overbought and oversold levels. This Relative Momentum Index indicator has 2 components. A change in RMI line color provides a warning signal for an upward or
Detect strength for uptrends and downtrends by tracking Buy Power and Sell Power. Stay on the right side of the market by being able to determine whether the market is in a bull or bear trend and how strong the trend is. Free download for a limited time! We hope you enjoy, with our very best wishes during this pandemic! Trend Trigger Factor  aims to ride out sideways movement, while positioning the trader in the correct side of the market to capture big trends when they occur. It was   orig
FREE
Two Period RSI
Libertas LLC
4.5 (8)
Two Period RSI compares long-term and short-term RSI lines, and plots a fill between them for improved visualization. Fill is colored differently according to an uptrend (short period RSI above long period RSI) or a downtrend (short period RSI below long period RSI). Short-term RSI crossing long-term RSI adds a more robust trend confirmation signal than using single period RSI alone. This is a small tool to help visualize and confirm RSI trends. We hope you enjoy! Looking for RSI alerts? You can
FREE
"Capture the sleeping and waking alligator." Detect trend entrance/exit conditions - this indicator can also be tuned according to your trading style. You can adjust a confidence parameter to reduce false positives (but capture less of the trend). This is based on a modification of the Alligator indicator by Bill Williams, an early pioneer of market psychology.  2 main strategies: either the " conservative"  approach to more frequently make profitable trades (at a lower profit), or the " high r
FREE
"The Squeeze indicator attempts to identify periods of consolidation in a market. In general the market is either in a period of quiet consolidation or vertical price discovery. By identifying these calm periods, we have a better opportunity of getting into trades with the potential for larger moves. Once a market enters into a "squeeze," we watch the overall market momentum to help forecast the market direction and await a release of market energy." The Modified TTM Squeeze Indicator is a modi
Whether trading stocks, futures, options, or FX, traders confront the single most important question: to trade trend or range? This tool helps you identify ranges to either trade within, or, wait for breakouts signaling trend onset. Free download for a limited time! We hope you enjoy, with our very best wishes during this pandemic! The issue with identifying ranges is some ranges and patterns are easy to miss, and subject to human error when calculated on the fly. The Automatic Range Identi
FREE
ATR Volatility plots the ATR-based volatility, and triggers alerts when it crosses user-defined upper and lower thresholds (purple and tan lines, please see screenshots). Circles are painted when ATR volatility crosses either above the upper threshold, or below the lower threshold. This is a small tool custom-built by our group, by specific request of one of our customers. We hope you enjoy! Do you have an indicator you would like to see designed? Feel free to send us a message! Click here for m
FREE
EMA Separation
Libertas LLC
2.5 (2)
EMA Separation plots 2 exponential moving averages, and a fill between them. The fill is colored differently according to an uptrend (short period EMA above long period EMA), or a downtrend (short period EMA below long period EMA). This is a small tool to help visualize the difference between long and short period averages. We hope you enjoy! EMA Separation can also be paired with our free EMA Separation Coefficient Parameters Short period (Default=10): # bars used to calculate short period EM
FREE
EMA Separation Coefficient reflects the separation between short-term and long-term exponential moving average trend resistance, as well as the direction of the current movement. Pay attention to potential crossover points when the coefficient approaches zero, this may indicate an upcoming breakout or reversal. Wait for confirmation of the trend before entering the trade, and exit when the coefficient forms a max (for calls) or a min (for puts). This is a small tool to help visualize the differe
FREE
The  Laguerre VIX Trend Extrema   (LVTE)  indicator detects market tops and bottoms. As its name suggests, LVTE is a percentage price oscillator that identifies extreme ranges in market price. How to use:   Buy   when the indicator was in the lower "blue" range for more than 2 candles, and then moves up into grey.   Sell   when the indicator was in the upper "red" range, and then moves down into orange. Please see screenshots for examples! To make it simple, the indicator can show this by paint
Automate your charting with the All-In-One SRES channel indicator. This is a complete package designed to address 3 questions: (1) when to enter a trade, (2) what is a good exit point, and (3) what is the probabilistic likelihood of success of the trade. Longevity and Flexibility : The All-In-One SRES calculates and charts S upport, R esistance, E xpected range, and a S queeze channel, and is enormously flexible for many trading strategies. Each option is customizable to fit your strategy, and c
Fano Factor is a measure of the dispersion of the probability distribution of Fano noise, named after Ugo Fano, an Italian-American Physicist. Fans has applications in Particle Detection and Neuroscience for describing variability in complex multivariate data. In trading, we have discovered Fano can be used as a 'signal to noise' ratio, and can indicate the strength of price movements (i.e., price movement is greater than predicted by purely statistical measures). Like standard deviation, Fano F
"The Squeeze indicator attempts to identify periods of consolidation in a market. In general the market is either in a period of quiet consolidation or vertical price discovery. By identifying these calm periods, we have a better opportunity of getting into trades with the potential for larger moves. Once a market enters into a "squeeze," we watch the overall market momentum to help forecast the market direction and await a release of market energy." Modified TTM Squeeze Indicator is a modifica
"The Squeeze indicator attempts to identify periods of consolidation in a market. In general the market is either in a period of quiet consolidation or vertical price discovery. By identifying these calm periods, we have a better opportunity of getting into trades with the potential for larger moves. Once a market enters into a "squeeze," we watch the overall market momentum to help forecast the market direction and await a release of market energy." The StdATR Squeeze Channel combines standard
SuperTrend Alerts
Libertas LLC
3 (4)
SuperTrend Alerts adds alerts to the widely popular SuperTrend indicator. As the name suggests, SuperTrend is a trending indicator which works best in trendy (not choppy) markets. SuperTrend is extremely popular for intraday and daily trading, and can be used on any timeframe. Place a call when the price closes above the SuperTrend line, and place a put when the price closes below the SuperTrend line. These crossovers are highlighted by non-repainting up/down arrows. Alerts Email, message and
True Choppiness Direction determines if the market is choppy (trading sideways) or if it is trending, as well as the trend direction and strength (green=up, red=down, grey=no trend) . The underlying algorithm is designed to detect trend movements even in the presence of noisy market data, please see screenshots. Trend strength is indicated by taller or shorter red/green fill. Choppiness index is range-bound between -50 (very trendy) and +50 (very choppy). This is a custom algorithm designed by u
Laguerre SuperTrend Clouds adds an Adaptive Laguerre averaging algorithm and alerts to the widely popular SuperTrend indicator. As the name suggests, Laguerre SuperTrend Clouds (LSC) is a trending indicator which works best in trendy (not choppy) markets. The SuperTrend is an extremely popular indicator for intraday and daily trading, and can be used on any timeframe. Incorporating Laguerre's equation to this can facilitate more robust trend detection and smoother filters. The LSC uses the impro
Catch major price movements, early in the trend. Alerts you to enter at the likely beginning of a trend, and if it's incorrect, quickly alerts you to exit to limit any loss. Designed to capture large, profitable price movements, with early entrance to maximize your returns. As shown in screenshots, typical behavior is  several quick entrance/exists with small loss , and then  capture of a large trend with high profits .  The   Instantaneous Trend  indicator is a lag-reduced method to detect pri
Looking for strong trend entrance and exit points of trends? This incorporates volume into price calculations for a fast entry/exit, showing how supply and demand factors are influencing price, and  giving you more insights than the average trader uses. The   Volume Accumulation Trend   indicator is a cumulative indicator that uses both   volume  and   price  to investigate whether an asset is growing or falling. It identifies differences between the price and the volume flow, which lets us kno
"Wouldn't we all love to reliably know when a stock is starting to trend, and when it is in flat territory? An indicator that would somehow tell you to ignore the head fakes and shakeouts, and focus only on the move that counts?" The Choppiness Index is a non-directional indicator designed to determine if the market is choppy (trading sideways) or not choppy (trading within a trend in either direction). It is an oscillating indicator between -50 (very trendy) and +50 (very choppy). There are man
Two Period RSI + Alerts compares long-term and short-term RSI lines, and plots a fill between them for improved visualization. Fill is colored differently according to an uptrend (short period RSI above long period RSI) or a downtrend (short period RSI below long period RSI). Short-term RSI crossing long-term RSI adds a more robust trend confirmation signal than using single period RSI alone. This is a tool to help visualize and confirm RSI trends. We hope you enjoy! Alerts Email, message, and
"Battles between bulls and bears continue to influence price development long after the combat has ended, leaving behind a messy field that observant technicians can use to manage risk and find opportunities. Apply "trend mirror" analysis to examine these volatile areas, looking for past action to impact the current trend when price turns and crosses those boundaries." RSI Mirrors and Reflections is a robust technique using multiple RSI periods, mirrors and reflections based on RSI values to ind
The  Laguerre VIX Trend Extrema   (LVTE)  indicator detects market tops and bottoms. As its name suggests, LVTE is a percentage price oscillator that identifies extreme ranges in market price. How to use: Buy when the indicator was in the lower "blue" range for more than 2 candles, and then moves up into grey. Sell when the indicator was in the upper "red" range, and then moves down into orange. Please see screenshots for examples! To make it simple, the indicator can show this by painting "dots
Catch major price movements, early in the trend. Alerts you to enter at the likely beginning of a trend, and if it's incorrect, quickly alerts you to exit to limit any loss. Designed to capture large, profitable price movements, with early entrance to maximize your returns. As shown in screenshots, typical behavior is several quick entrance/exists with small loss , and then capture of a large trend with high profits .  The Instantaneous Trend  indicator is a lag-reduced method to detect price t
Laguerre SuperTrend Clouds   adds an Adaptive Laguerre averaging algorithm and alerts to the widely popular SuperTrend indicator. As the name suggests,   Laguerre SuperTrend Clouds (LSC)   is a trending indicator which works best in trendy (not choppy) markets. The SuperTrend is an extremely popular indicator for intraday and daily trading, and can be used on any timeframe. Incorporating Laguerre's equation to this can facilitate more robust trend detection and smoother filters. The LSC uses the
Auswahl:
shams201
114
shams201 2022.06.27 23:59 
 

nice work

Martin Rác
25
Martin Rác 2020.10.16 19:38 
 

The best RSI indicator, very professional...

Aravind Kolanupaka
8820
Aravind Kolanupaka 2020.10.10 00:31 
 

this one is indispensable.

steedchitra
554
steedchitra 2020.07.12 09:04 
 

I love this indicator. It's so awesome.

SamitR
1231
SamitR 2020.04.21 02:31 
 

hello I have just purchased this but when I click on the install button, nothing happens

there is no downloading of the indicator

please help

alden24
189
alden24 2019.05.01 14:17 
 

Enjoyed trade with this art..thx

Natasha Diedericks
5715
Natasha Diedericks 2018.10.09 22:22 
 

Thanks

hkarram
288
hkarram 2018.07.23 05:10 
 

outstanding indicator ...... works very well with certain pairs and and time frames ..... 5 stars :)

Roberto Cesar Ruarte Pedraza
702
Roberto Cesar Ruarte Pedraza 2018.07.17 17:32 
 

Excellent! Helps a lot in exits and trend recognition.

sammyuht
491
sammyuht 2018.01.29 18:16 
 

Very good indicator, recommended.

3316589p
870
3316589p 2017.09.08 10:17 
 

Great Indicator, Highly recommended for RSI users.

Antwort auf eine Rezension
Version 1.3 2021.12.01
Upgraded for MT4 version compatibility
Version 1.2 2017.03.22
- Users can now customize indicator colors
- Updated indicator icon
Version 1.1 2016.09.28
V1.1 includes custom property icon