Choppiness Index MT5
- Indikatoren
-
Libertas LLC
 Libertas LLC is a software company by enterprising math nerds. We make high quality and complex mathematical tools in a user-friendly and easy to use package for retail investors.
 - Version: 1.4
- Aktualisiert: 1 Dezember 2021
- Aktivierungen: 20
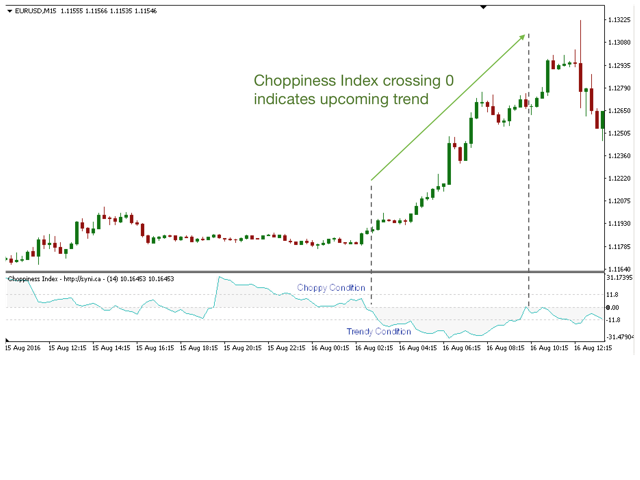
"Würden wir nicht alle gerne zuverlässig wissen, wann eine Aktie einen Trend beginnt und wann sie sich in einem flachen Bereich befindet? Einen Indikator, der uns sagt, dass wir die Kopfnüsse und Erschütterungen ignorieren und uns nur auf die Bewegung konzentrieren sollten, die zählt?"
Der Choppiness-Index ist ein richtungsunabhängiger Indikator, mit dem festgestellt werden kann, ob der Markt abgehackt (seitwärts) oder nicht abgehackt (innerhalb eines Trends in eine der beiden Richtungen) ist. Es handelt sich um einen oszillierenden Indikator zwischen -50 (sehr trendy) und +50 (sehr abgehackt).
Es gibt viele Strategien für den Handel mit dem Choppiness-Indikator:
1. Kaufen oder verkaufen Sie den Ausbruch, der von extremen Choppiness-Index-Werten abprallt
- Bewegt sich der CI unter +11,8 (abgehackt bis trendy), nachdem er von einem hohen CI-Wert abgeprallt ist, kann dies auf einen bevorstehenden Trend hinweisen. Achten Sie auf die Bestätigung der Richtung im Preis
- Für einen konservativeren Handel warten Sie, bis sich der CI über 0 bewegt (wie im Screenshot gezeigt)
2. Folgen Sie dem Trend mit dem Choppiness Index (wann sollten Sie aussteigen und wann nicht)
- Wenn sich der Kurs in einem Trend befindet, aber der CI nicht mehr als dreimal über die Schwelle von +11,8 gestiegen ist, wird der Handel wahrscheinlich fortgesetzt. Wenn der KI die Schwelle von +11,8 dreimal oder öfter überschreitet, ist es wahrscheinlich, dass der Trend gestoppt wird.
3. Verfeinern Sie die Leistung Ihrer Handelsstrategie, indem Sie die aktuellen Marktbedingungen bestätigen, BEVOR Sie einen Handel eingehen. Viele Handelsstrategien funktionieren am besten unter bestimmten Marktbedingungen. Bestimmen Sie quantitativ das gewünschte Ausmaß an Choppiness/Trendiness anhand des CI.
Zusätzliche Details
- Schwellenwerte werden häufig mit dem Choppiness-Index verwendet, um zwischen abgehackten und trendigen Bewegungen zu unterscheiden. Übliche Werte sind die beliebten Fibonacci-Retracements: +11,8 für die hohe (abgehackte) Schwelle und -11,8 für die niedrige (trendige) Schwelle
- Der Choppiness-Index lässt sich gut mit Trendlinien und der traditionellen Mustererkennung kombinieren.
Warnungen
E-Mail-, Nachrichten- und Tonwarnungen können für die folgenden Ereignisse ein-/ausgeschaltet werden. Bitte beachten Sie, dass E-Mail-Empfänger und SMTP-Informationen in MetaTrader 5/Optionen angegeben werden sollten, bevor Sie E-Mail-Warnungen verwenden.
- Der Choppiness-Index überschreitet 0
- Der Choppiness-Index liegt über dem vom Benutzer wählbaren oberen (abgehackten) Schwellenwert (Standard=11,8)
- Choppiness-Index liegt unter dem vom Benutzer wählbaren unteren (trendigen) Schwellenwert (Standard=-11,8)
Parameter
- CHOP-Periode (Voreinstellung=14): Anzahl der für die Berechnung des Indikators verwendeten Balken
- CHOP-Glättung (Standardwert=1): optionaler Glättungszeitraum, der auf den Choppiness-Index angewendet wird. 1=keine Glättung, >1 = verstärkte Glättung (dieser Wert wird als Glättungszeitraum verwendet)
- Kreise einzeichnen, wenn CI > oberer Schwellenwert: True = Überschneidungen werden durch Kreise hervorgehoben
- Kreise einzeichnen, wenn CI < unterer Schwellenwert: Wahr = Übergänge werden durch Kreise hervorgehoben
- Kreise einzeichnen, wenn CI den Nullpunkt überschreitet: Wahr = Überschneidungen werden durch Kreise hervorgehoben
- Alle Warnungen ein-/ausschalten: Wahr = Alarme sind erlaubt, falsch = alle Alarme werden pausiert
- Warnung, wenn CI den Wert 0 überschreitet: Wenn wahr, wird eine Warnung ausgegeben, wenn der Choppiness Index den Wert 0 überschreitet.
- Warnung, wenn CI über dem oberen Schwellenwert liegt: Wenn wahr, wird ein Alarm ausgelöst, wenn der Choppiness-Index-Wert über dem benutzerdefinierten oberen (abgehackten) Schwellenwert liegt.
- Obere Warnschwelle (Standard=11,8): Benutzerdefinierte obere Warnschwelle
- Warnung, wenn CI unter dem unteren Schwellenwert liegt: Wenn wahr, wird ein Alarm ausgelöst, wenn der Choppiness-Index-Wert unter dem benutzerdefinierten unteren (trendigen) Schwellenwert liegt.
- Untere Warnschwelle (Standard=-11.8): Benutzerdefinierte untere Alarmschwelle
- Warnmeldung einschalten: Warnmeldung im Nachrichtenfeld
- Alarmton einschalten: Ton-Alarm
- Alarme per E-Mail einschalten: E-Mail-Warnung