Two Period RSI
- Indikatoren
-
Libertas LLC
 Libertas LLC is a software company by enterprising math nerds. We make high quality and complex mathematical tools in a user-friendly and easy to use package for retail investors.
 - Version: 1.2
- Aktualisiert: 1 Dezember 2021
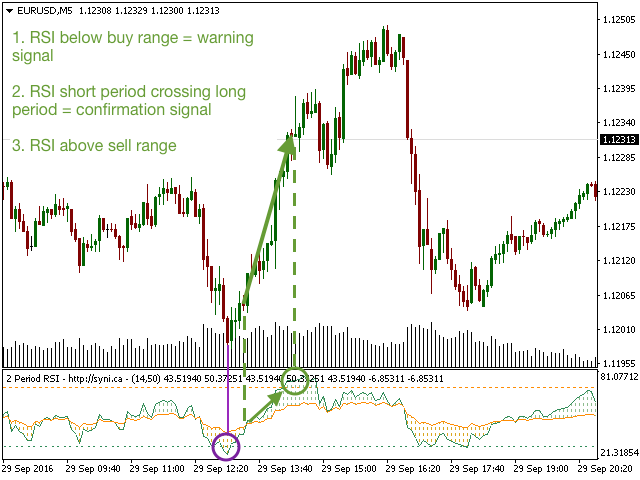
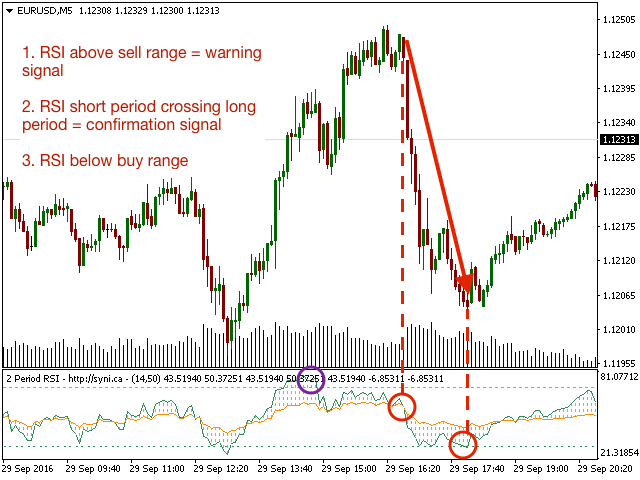
Der Zwei-Perioden-RSI vergleicht langfristige und kurzfristige RSI-Linien und stellt zur besseren Visualisierung eine Füllung zwischen ihnen dar. Die Füllung ist je nach Aufwärtstrend (RSI der kurzen Periode über dem RSI der langen Periode) oder Abwärtstrend (RSI der kurzen Periode unter dem RSI der langen Periode) unterschiedlich gefärbt. Der kurzfristige RSI, der den langfristigen RSI kreuzt, liefert ein robusteres Trendbestätigungssignal als der RSI für eine einzelne Periode.
Dies ist ein kleines Tool zur Visualisierung und Bestätigung von RSI-Trends. Wir wünschen Ihnen viel Spaß!
Suchen Sie nach RSI-Warnungen? Sie können unseren Zwei-Perioden-RSI + Alarme-Indikator hier herunterladen, der vom Benutzer auswählbare E-Mail-/Meldungs-/Ton-Warnungen enthält.
Parameter
- Kurze Periode (Standard=14): Anzahl der Balken, die zur Berechnung des RSI der kurzen Periode verwendet werden
- Lange Periode (Standard=50): Anzahl der Balken, die für die Berechnung des RSI der langen Periode verwendet werden


Vraiment efficace, j'y mais dessus un RSI 3 colored et un CCI 14 colored, impecable.