Super Channel Pro
- Indikatoren
- Version: 1.0
- Aktivierungen: 5

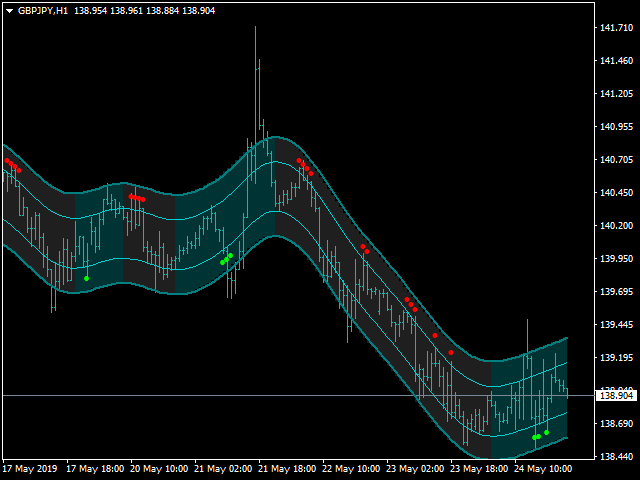
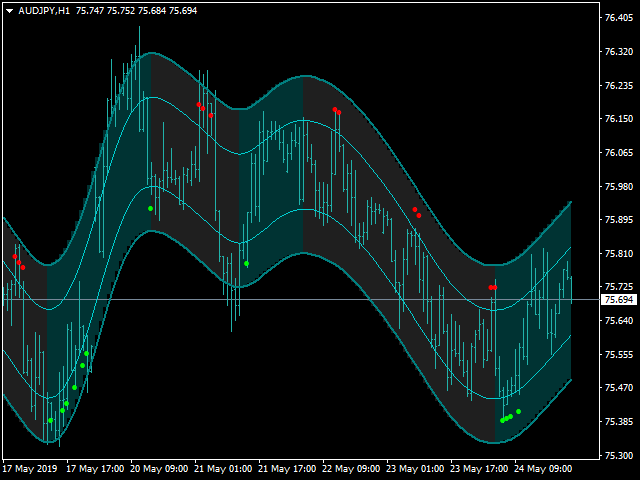
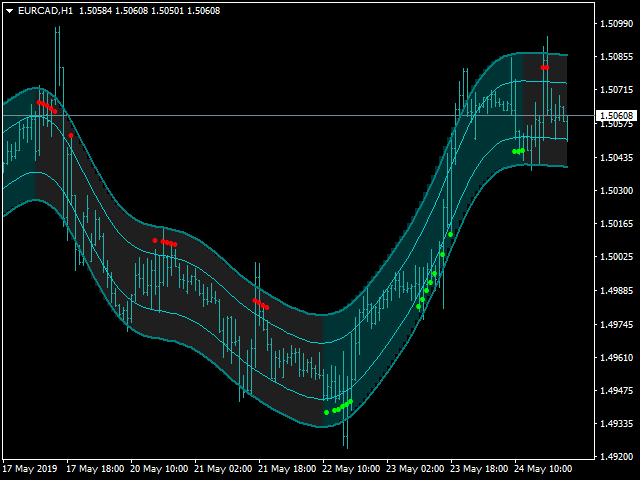
Dieser Indikator Super Channel Pro Indikator zeigt die Trendbewegung an, derIndikator berechnet automatisch die Linie.
Eigenschaften
- FiltPer -. zeigt Indikator Kanal Zeitraum.
- Abweichung zeigt die Abweichung des Indikatorkanals an.
- Abweichung2 - zeigt die zeigt die Abweichung des Indikatorkanals an.
Wie ist der Status zu verstehen?
- Wenn der Pfeil grün ist, ist der Trend aufwärts gerichtet.
- Wenn der Pfeil rot ist, ist der Trend abwärts.
////////////////////////////////////////////////////////////////////////////////////////////////////////////////////////////////////////////////////
////////////////////////////////////////////////////////////////////////////////////////////////////////////////////////////////////////////////////
////////////////////////////////////////////////////////////////////////////////////////////////////////////////////////////////////////////////////
////////////////////////////////////////////////////////////////////////////////////////////////////////////////////////////////////////////////////
////////////////////////////////////////////////////////////////////////////////////////////////////////////////////////////////////////////////////
///////////////////////////////////////////////////////////////////////////////////////////////////////////////////////////////////////////////////
///////////////////////////////////////////////////////////////////////////////////////////////////////////////////////////////////////////////////
///////////////////////////////////////////////////////////////////////////////////////////////////////////////////////////////////////////////////
///////////////////////////////////////////////////////////////////////////////////////////////////////////////////////////////////////////////////
//////////////////////////////////////////////////////////////////////////////////////////////////////////////////////////////////////////////////
//////////////////////////////////////////////////////////////////////////////////////////////////////////////////////////////////////////////////
//////////////////////////////////////////////////////////////////////////////////////////////////////////////////////////////////////////////////
//////////////////////////////////////////////////////////////////////////////////////////////////////////////////////////////////////////////////
//////////////////////////////////////////////////////////////////////////////////////////////////////////////////////////////////////////////////
//////////////////////////////////////////////////////////////////////////////////////////////////////////////////////////////////////////////////
//////////////////////////////////////////////////////////////////////////////////////////////////////////////////////////////////////////////////
//////////////////////////////////////////////////////////////////////////////////////////////////////////////////////////////////////////////////
//////////////////////////////////////////////////////////////////////////////////////////////////////////////////////////////////////////////////