EMA Separation Coefficient
- Indikatoren
-
Libertas LLC
 Libertas LLC is a software company by enterprising math nerds. We make high quality and complex mathematical tools in a user-friendly and easy to use package for retail investors.
 - Version: 1.2
- Aktualisiert: 1 Dezember 2021
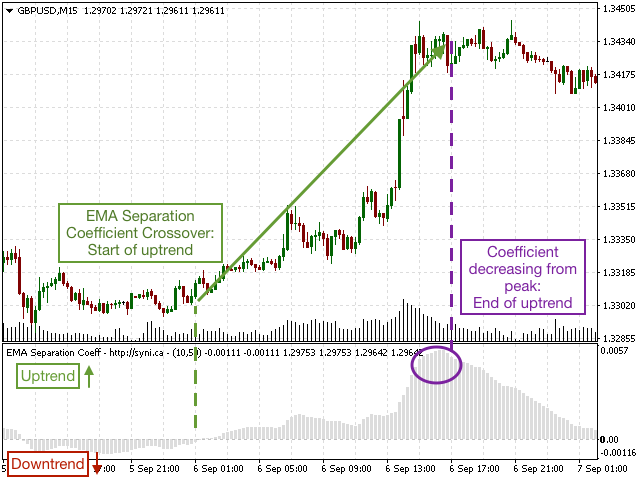
Der EMA-Separationskoeffizient spiegelt den Abstand zwischen dem kurzfristigen und dem langfristigen Trendwiderstand des exponentiellen gleitenden Durchschnitts sowie die Richtung der aktuellen Bewegung wider. Achten Sie auf potenzielle Kreuzungspunkte, wenn der Koeffizient sich Null nähert, da dies auf einen bevorstehenden Ausbruch oder eine Umkehrung hinweisen kann. Warten Sie auf die Bestätigung des Trends, bevor Sie in den Handel einsteigen, und steigen Sie aus, wenn der Koeffizient ein Maximum (bei Calls) oder ein Minimum (bei Puts) bildet.
Dies ist ein kleines Hilfsmittel, um den Unterschied zwischen lang- und kurzperiodischen Durchschnitten zu verdeutlichen. Wir wünschen Ihnen viel Spaß!
Der EMA Separation Coefficient kann auch mit unserem kostenlosen EMA Separation Indikator kombiniert werden.
Parameter
- Kurze Periode (Standard=10): # Balken, die zur Berechnung des EMA der kurzen Periode verwendet werden
- Lange Periode (Standardwert=50): # Anzahl der Balken, die für die Berechnung des EMA der langen Periode verwendet werden


Good Indicator