WaveTrend Momentum Oscillator
- Indikatoren
-
Libertas LLC
 Libertas LLC is a software company by enterprising math nerds. We make high quality and complex mathematical tools in a user-friendly and easy to use package for retail investors.
 - Version: 1.4
- Aktualisiert: 1 Dezember 2021
- Aktivierungen: 20
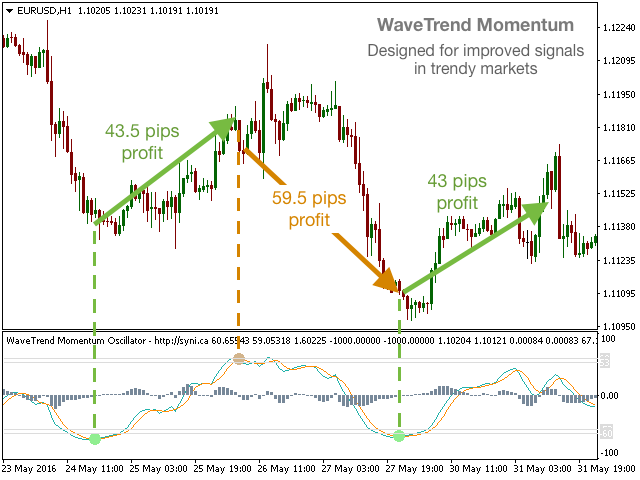
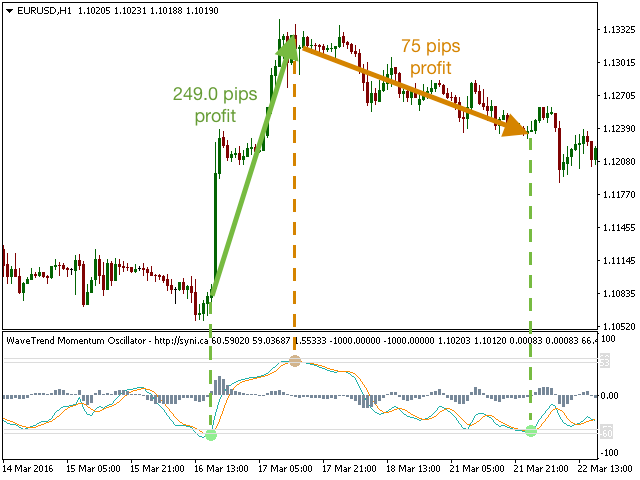
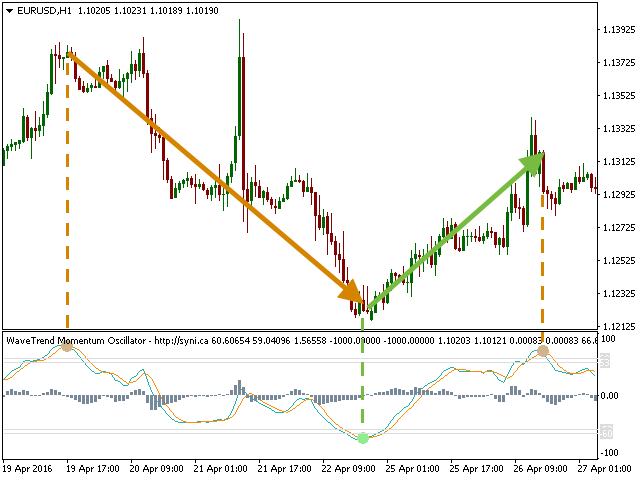
WaveTrend Momentum Oscillator ist ein Upgrade des beliebten und einfach zu bedienenden WaveTrend Oscillators. Der WaveTrend Momentum Oscillator fügt der ursprünglichen WaveTrend Berechnung eine Momentum-Komponente hinzu, um schnellere und präzisere Einstiegspunkte in trendigen Marktsituationen zu ermöglichen.
Bevorzugen Sie den ursprünglichen WaveTrend Oscillator? Der WaveTrend Momentum Oscillator ermöglicht es Ihnen, zwischen der Momentum- und der ursprünglichen WT-Version zu wechseln. Beide liefern je nach Marktlage wertvolle Informationen.
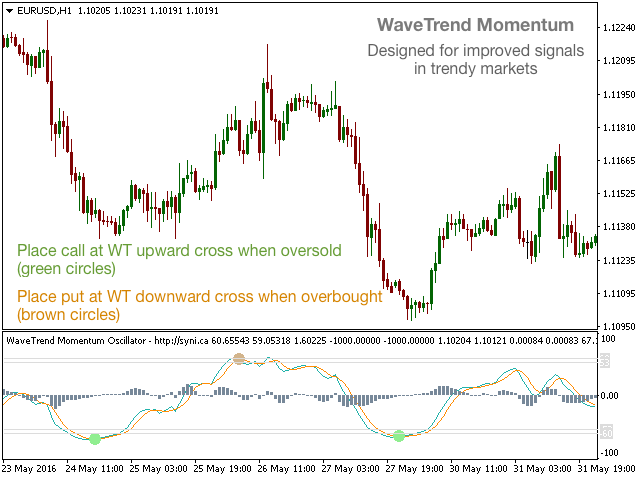
Wenn der WT über dem überkauften Niveau liegt und die Kontrolllinie unterschreitet, ist dies ein gutes Verkaufssignal. Wenn der WT unter dem überverkauften Niveau liegt und die Kontrolllinie überschreitet, ist dies ein gutes Kaufsignal. Farbige Kreise markieren Kauf- und Verkaufssignale. Divergenzen zwischen WT und Kursbewegung können auf eine bevorstehende Umkehrung hinweisen.
Warnungen
Wir haben akustische Warnungen, Nachrichten und E-Mail-Warnungen für WaveTrend-Kreuzungen bei überkauften (Verkaufssignal) und überverkauften (Kaufsignal) Bedingungen hinzugefügt. Überkaufte und überverkaufte Niveaus sind vom Benutzer auswählbar. E-Mail-Empfänger und smtp-Informationen müssen in MT4/options angegeben werden, bevor E-Mail-Warnungen verwendet werden können.
Parameter
- WaveTrend-Typ (Momentum oder Original): Wählen Sie den Momentum- oder Original-WaveTrend-Indikator-Typ
- Berechnungszeitraum (Standard=10): # Balken, die zur Berechnung des WaveTrend verwendet werden
- Mittelungszeitraum (Standard=21): # Anzahl der Takte, die für die Durchschnittsbildung des WaveTrend verwendet werden
- Momentum Länge (Standard=4): # Balken, die für die Berechnung des WaveTrend-Momentums verwendet werden
- Überkauft-Level (Kreise & Alarme): Benutzerdefiniertes Überkauft-Niveau für das Plotten von farbigen Kreisen und das Auslösen von Alarmen
- Oversold Level (Kreise & Alarme): Benutzerdefiniertes überverkauftes Niveau für die Darstellung von farbigen Kreisen und die Auslösung von Alarmen
- Alle Alarme ein-/ausschalten: Bei true werden alle Alarme zugelassen, bei false werden alle Alarme verhindert
- Warnung, wenn das Signal die Strg. über dem überkauften Niveau kreuzt: Wenn true, wird ein Alarm ausgelöst, wenn das WT den Kontrollbereich unterschreitet und über dem überkauften Niveau liegt (Put-Signal)
- Alarm, wenn das Signal ctrl unterhalb des überverkauften Levels kreuzt: Falls zutreffend, wird ein Alarm ausgelöst, wenn der WT das Kontrollniveau überschreitet und unter dem überverkauften Niveau liegt (Kaufsignal)
- Warnmeldung einschalten: Wenn wahr, schaltet die Nachrichtenbox ein
- Alarme Ton einschalten: Wenn wahr, schaltet der Alarmton ein
- Alarme per E-Mail einschalten: Falls wahr, schaltet die E-Mail-Warnungen ein


Good Indicator. When changing the size of the lines, they do not stay.