Trend Trigger Factor Alerts
- Indikatoren
-
Libertas LLC
 Libertas LLC is a software company by enterprising math nerds. We make high quality and complex mathematical tools in a user-friendly and easy to use package for retail investors.
 - Version: 1.0
Detect strength for uptrends and downtrends by tracking Buy Power and Sell Power. Stay on the right side of the market by being able to determine whether the market is in a bull or bear trend and how strong the trend is.
Free download for a limited time! We hope you enjoy, with our very best wishes during this pandemic!
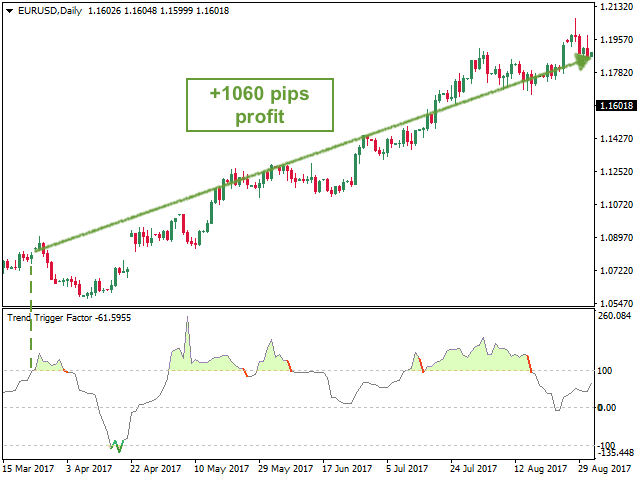
Trend Trigger Factor zielt darauf ab, Seitwärtsbewegungen zu überstehen, während sich der Händler auf der richtigen Seite des Marktes positioniert, um große Trends zu erfassen, wenn sie auftreten. Ursprünglich wurde ervon M.H. Pee als eine "Immer-am-Markt"-Strategie entwickelt. Wir haben sie um Frühwarnsignale und Warnungen erweitert, damit Sie Ihre Positionen schnell ändern und den Trend erfassen können, ohne ständig auf den Bildschirm starren zu müssen.
Der Trend Trigger Factor wird auf einer Skala dargestellt, bei der Werte über +100 und unter -100 auf Situationen mit größerer Kauf- oder Verkaufskraft hinweisen.
Wie wird er verwendet?
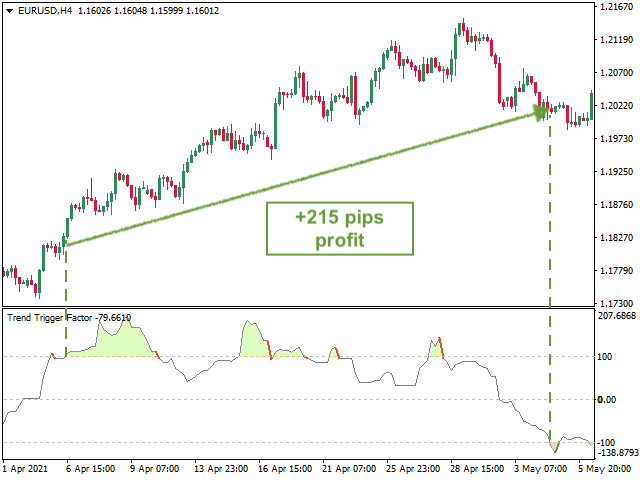
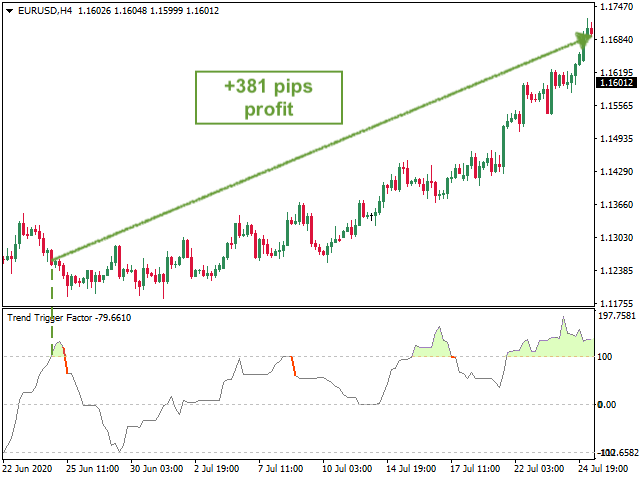
- Gehen Sie eine Long-Position ein, wenn der Indikator über +100 steigt (grüne Füllung). Bleiben Sie in der Position, bis der Indikator eine Short-Position anzeigt (unten).
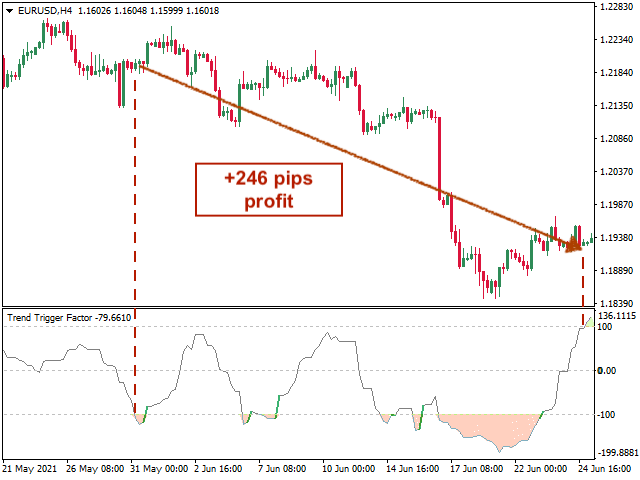
- Gehen Sie eine Short-Position ein, wenn der Indikator unter -100 fällt (rote Füllung). Bleiben Sie in der Short-Position, bis der Indikator eine Long-Position anzeigt (oben).
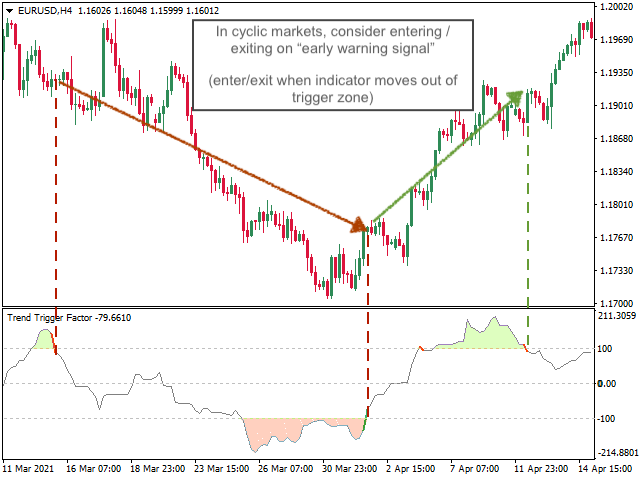
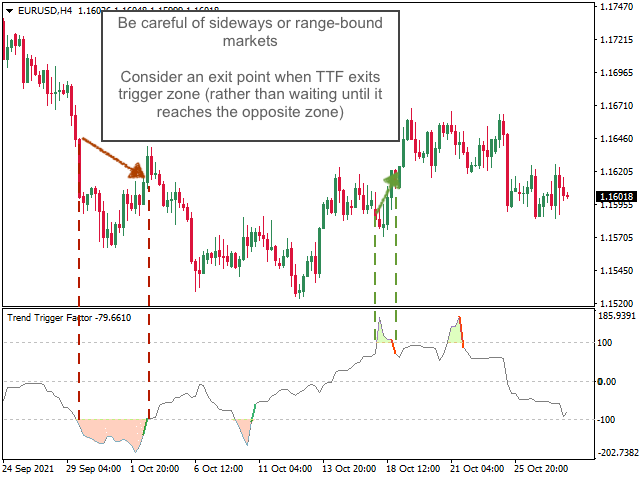
- Frühwarnhinweis: In trendigen Märkten kann TTF eine Long-/Short-Position mehrmals wiederholen, bevor der Trend vorbei ist. Bei unruhigen / seitwärts tendierenden Märkten kann es jedoch besser sein, eine Position zu beenden, wenn der Indikator den Auslösebereich verlässt (d.h. war er > 100, bewegt sich dann aber unter 100, beenden Sie die Long-Position). TTF gibt eine Frühwarnung aus, wenn dies geschieht. Dies ist ein guter Zeitpunkt, um Trailing-Stop-Losses zu setzen und zu überlegen, ob der Trend stark aussieht oder ob man aussteigen sollte.
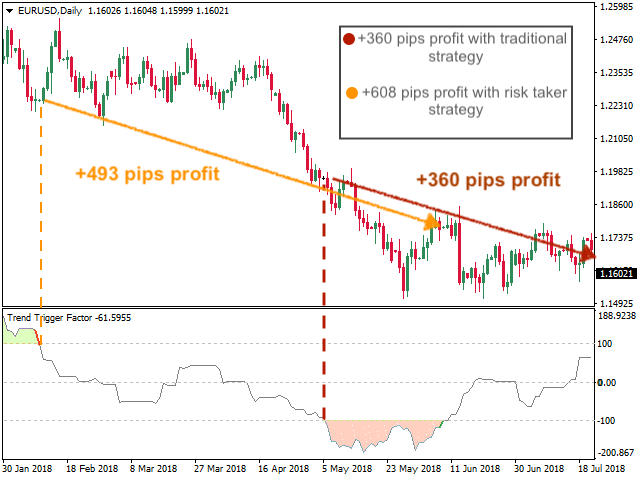
- Hier ist eine riskantere Methode, um mehr Gewinn zu erzielen: Gehen Sie eine Position bei der Warnung und nicht bei der Bestätigung ein. Gehen Sie also eine Long-Position ein, wenn TTF eine "frühe Warnung zum Ausstieg aus der Short-Position" ausgibt (TTF lag unter 100, steigt aber jetzt darüber). Dies funktioniert besonders gut bei schwankenden Märkten.
Warnungen
Nachrichten, Töne und E-Mail-Warnungen können aktiviert werden, wenn sich der Trend aufwärts oder abwärts bewegt. Punktindikatoren können ein- und ausgeschaltet und in Parametern neu eingefärbt werden.
Zu den Warnungen gehören Frühwarnungen vor sich abschwächenden Trends und Bestätigungssignale. Frühwarnungen können unabhängig voneinander ausgeschaltet werden.
Parameter
- Berechnungslänge: # Intervalle, die zur Berechnung des Indikators verwendet werden
- Schwelle für Kaufauslöser: Schwellenwert zur Erkennung eines "gekauften" Zustands für Indikator und Alarme (+100 Standard)
- Schwellenwert für den Verkaufstrigger: Schwellenwert, um einen "verkauften" Zustand für den Indikator und die Alarme zu identifizieren (Standardwert -100)
- Mark trigger crossover: Farbige Indikatorlinie zur Markierung von Überschreitungen des Schwellenwertes; entspricht den Alarmen
- Fill zones: Farbige Füllung für Indikatorbereiche außerhalb der Trigger-Schwellenwerte
- Warnmeldungen einschalten: Wenn diese Option aktiviert ist, werden Warnmeldungen in der Nachrichtenbox angezeigt (wenn die Indikatorlinie den Schwellenwert überschreitet).
- Alarme Ton einschalten: Falls zutreffend, wird der Ton der Alarme eingeschaltet(wenn die Indikatorlinie das Steuerelement kreuzt).
- E-Mail-Warnungen einschalten: Wenn wahr, wird die E-Mail-Warnungen eingeschaltet( wenn die Indikatorlinie die Kontrolle kreuzt)
- Auf neue Kerzeneröffnung warten: Bei true wird der Alarm erst bei der Eröffnung der nächsten Kerze ausgelöst (wenn eine aktuelle Kerze schnell einbricht, sich aber wieder erholt, wird so ein falsches positives Signal vermieden). Wir neigen dazu, dies nicht zu verwenden und bevorzugen einen schnelleren Einstiegspunkt, aber das hängt von Ihrem Handelsstil ab!
- Farben: Optionen zur Festlegung benutzerdefinierter Farben für verschiedene Komponenten des Indikators (Indikatorlinie, Kontrolllinie, Punkte usw.)
iCustom
Sie können diesen Indikator in Ihren EA integrieren! Nach dem Herunterladen können Entwickler den folgenden Code verwenden, um ihn einzubinden:
iCustom(NULL,0,"Trend Trigger Factor",15, 100, -100, true, true, false, false, false, false, clrGray, clrGray, clrGray, clrGray, clrGray, clrGray, 0, 0); // TTF indicator value
iCustom(NULL,0,"Volume Accumulation Percentage Indicator",10, 10, false, false, false, false, false, false, clrGray, clrGray, clrGray, clrGray, clrGray, 3, 0); // TTF alerts for upward crossing (EMPTY_VALUE or not empty)
iCustom(NULL,0,"Volume Accumulation Percentage Indicator",10, 10, false, false, false, false, false, false, clrGray, clrGray, clrGray, clrGray, clrGray, 4, 0); // TTF alerts for downward crossing (EMPTY_VALUE or not empty)


Good indicator. Many thanks for sharing