适用于MetaTrader 5的技术指标 - 24

Highly configurable Bollinger Bands indicator. Features: Highly customizable alert functions (at levels, crosses, direction changes via email, push, sound, popup) Multi timeframe ability Color customization (at levels, crosses, direction changes) Linear interpolation option Works on strategy tester in multi timeframe mode (at weekend without ticks also) Parameters:
Bollinger Bands Timeframe: You can set the lower/higher timeframes for Bollinger Bands. Bollinger Bands Bar Shift: Y ou can set th
FREE
Range Identifier v3 User Guide 1. Overview The Range Identifier v3 is a technical analysis tool designed to automatically detect and visualize periods of market consolidation, commonly known as ranges. this MQL5 version brings the same powerful logic to the MetaTrader 5 platform. The primary function of this indicator is to draw a channel around recent highs and lows during periods of low volatility. When the price breaks out of this channel, the indicator provides an alert, helping traders iden
FREE

Fundamentação teórica A VWAP é uma média móvel ajustada pelo volume, ou seja o peso de cada preço corresponde ao volume de ações negociadas no período, dando mais importância ao período em que se tenha mais negociações. [1] VWAP = sum(price[i]*volume[i]) / sum(volume[i]) Metodologia É possível configurar o período que será utilizado para o calculo da VWAP, a cor, a espessura e o estilo da linha. A linha é desenhada desde a o começo da série disponível apenas uma vez para economizar recursos com
FREE

High Low Swing (HLS) Indicator
The HLS indicator is a technical analysis tool designed to identify swing highs and lows in the market, aiding swing traders in making informed decisions. It offers an adjustable "degree" parameter, allowing you to customize the sensitivity to strong price movements based on current market conditions.
Features:
• Clear Buy/Sell Signals: The indicator plots signals directly on the chart, simplifying trade identification.
• Adjustable Swing Strength: The "degr
FREE
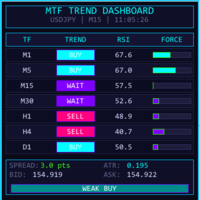
MTF TREND DASHBOARD - 多周期趋势分析面板 强大的可视化仪表板,可同时显示 7 个周期的趋势方向(M1、M5、M15、M30、H1、H4、D1)。 === 主要功能 === 基于 EMA 金叉/死叉的多周期实时趋势检测 RSI 数值及超买/超卖颜色提示 动态趋势强度条 全局市场偏向信号(Strong Buy/Sell、Bias、Weak、Neutral) 实时显示点差、ATR、买价/卖价 现代暗色主题,可自定义霓虹颜色 面板可缩放(50–200%) 可移动到图表任意角落 === 信号条件 === BUY :快 MA > 慢 MA 且 RSI > 50
SELL :快 MA < 慢 MA 且 RSI < 50
信号强度基于 MA/ATR 比率 === 自定义选项 === 快/慢 MA 周期 RSI 周期 ATR 周期 全部面板颜色 面板位置和缩放 === 推荐用法 === 非常适合趋势跟随策略。使用高周期共振(4 个及以上一致信号)可获得更强的入场机会。适用于所有品种和周期。 无重绘。轻量级。每 500ms 更新一次。
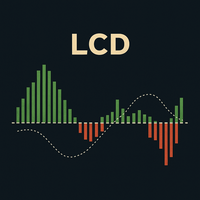
LCD 拉盖尔聚合离散指标:MACD 的高级改良版 LCD 拉盖尔聚合离散指标 (LCD Laguerre Convergence Divergence) 是一种先进的技术指标,旨在改进经典的 MACD 指标,提供更快、更灵敏和更具适应性的动量检测。其主要优势在于使用了 拉盖尔滤波器 (Laguerre filters) ,它比传统的移动平均线能更精确地响应价格变化。 主要优势 更高灵敏度和更小滞后性: 拉盖尔滤波器能生成更早的进场和出场信号,这在波动剧烈的市场中至关重要。 对波动性的适应能力: 它根据 ATR(平均真实波幅) 动态调整,在低波动性时过滤掉噪音,在高波动性时快速做出反应。 改进的噪音过滤: 包含一个 决策区 (Decision Zone) 和额外的平滑处理(直方图的 EMA),以减少虚假信号。 可选的成交量确认: 允许通过成交量来验证信号,这对于 H1-D1 等时间周期非常有用;在 M1-M30 的剥头皮交易中可以将其禁用。 视觉灵活性: 可以自定义线条和直方图的颜色、粗细和样式。 组成部分与工作原理 L-Fast 线: 代表短期动量,对价格反应迅速。 L-Signal
FREE

The most crucial price level in any "Volume Profile" is the "Point of Control" . Is the price level with the highest traded volume. And mainly, is the level where the big guys start there their positions, so it's an accumulation/distribution level for smart money.
The idea of the indicator arose after the "MR Volume Profile Rectangles" indicator was made. When creating the "MR Volume Profile Rectangles" indicator, we spent a lot of time comparing the volumes with those from the volume profile

Velas Multi Time Frame
Las velas multi time frame, también conocidas como "MTF candles" en inglés, son un indicador técnico que permite visualizar velas japonesas de un marco temporal diferente al marco temporal principal en el que estás operando. Este enfoque ofrece una perspectiva más amplia del comportamiento del precio, lo que resulta especialmente útil para los traders que emplean estrategias de acción del precio. A continuación, se detallan los conceptos clave relacionados con este indic
FREE

This indicator displays Point & Figure charts (PnF charts) in the indicator window. PnF charts show only price movements that are bigger than the specified box size. It helps to eliminate noise and allows focusing on main trends. Time is not a factor here. Only price movements are taken into account. That is why PnF chart is not synchronized with the main chart it is attached to. More about PnF charts: http://stockcharts.com/school/doku.php?id=chart_school:chart_analysis:pnf_charts Indicator wor
FREE

Several assets in several markets have the behavior of using specific numbers as Force Numbers, where support, resistance and price thrust is created. Let this indicator draw those levels of support and resistance for you. You can also stack it to show different level of Prices! This technique is being used by Tape Readers and Order Flow traders all over the world for a long time. Give it a try. Challenge yourself to study new ways of Price Action!
SETTINGS
What Price reference to use in the c
FREE

VR ATR Pro 指标是一个强大的专业工具,用于确定金融工具的目标水平。该指标的有效性已被真实和模拟账户的数千次测试所证明。 VR ATR Pro 指标在真实数据上运行,使用实时真实的统计数据。统计数据是很顽固的东西,在数学计算中使用真正的统计数据可以让你计算出金融工具的准确目标水平。 对于安装文件,说明,愉快的奖金 联系我 好处 该指标有许多优点,以下是其中的几个。 指标的高精确度。 超自然现象可以排除在计算之外。 直接在图表上简单显示目标水平。 适用于任何金融工具(外汇、金属、差价合约、期货、加密货币)。 它不会被重新绘制,它不断地保存它的读数。 对确定 Stop Loss 和 Take Profit 水平有效。 智能手机通知,电子邮件和MetaTrader提醒。 MetaTrader 4和MetaTrader 5的版本是完全相同的。 易于设置和安装。 适用于初学者和有经验的交易者。 适用于所有时段和时间范围。 建议 计算指标的时期必须小于指标的时间框架。 在新金融工具的设置中使用读数的准确性计算。 使用该指标来计算每日或长于一天的时期的水平。 将该指标与你的交易系统结合起来使

Candle Countdown Pro – Real-Time Timeframe & Spread Tracker Love it? Hate it? Let me know in a review! Feature requests and ideas for new tools are highly appreciated. :) Try "The AUDCAD Trader":
https://www.mql5.com/en/market/product/151841 Never miss a candle close again! Candle Countdown Pro is an essential trading tool that displays real-time countdowns for multiple timeframes,
live spread monitoring , and key trading information—all in one clean, customizable panel.
Key Features:
FREE

DailyHiLo Indicator
Master the daily range like a pro. This indicator automatically plots the previous day’s high and low levels —a core element in the (Beat The Market Maker) trading approach—directly on your chart. These levels act as natural boundaries for intraday price action, helping traders identify potential reversal zones, breakout points, and liquidity targets. Key Features Accurate plotting of yesterday’s high and low for any symbol and timeframe. Works seamlessly with BTMM-inspired
FREE

The indicator displays divergence for any custom indicator. You only need to specify the indicator name; DeMarker is used by default. Additionally, you can opt for smoothing of values of the selected indicator and set levels whose crossing will trigger an alert. The custom indicator must be compiled (a file with ex5 extension) and located under MQL5/Indicators of the client terminal or in one of the subdirectories. It uses zero bar of the selected indicator with default parameters.
Input parame
FREE

It is the very same classic Stochastic indicator, but with a little twist: we changed the Signal Line with a 2-color line, so we can use it with EAs as a filtering system. And that's it! I know it could seem stupid but I needed that, so I created it. The original formula is right from Metaquote's chest, no additions, no subtractions, it is Stochastics in its core.
So I will not publish here the Stochastics parameters as they are all the same as always... Enjoy!
If you like this indicator, all I
FREE

TransitTrendlines this is a automatically trendline drawer, it draw both horizontal and diagonal trendlines. The horizontal trendlines are the pivot points of the day timeframe and the diagonal trendlines are based on the current time frames. You can adjust the diagonal trendlines by increasing the number of bars to draw the diagonal trendline and can also adjust the steepness. Note that the Horizontal trendlines are based on the day pivot points not currant time frame. Join mql5 transitbk98 cha
FREE

VR Sync Charts 是用于在窗口之间标记同步的实用程序。 使用VR Sync Charts,您的趋势水平、横水平、斐波那契折返将与所有图表同步。 该实用程序允许同步MetaTrader终端中的所有标准图形对象,您的所有趋势、江恩线和其他对象都将被准确复制到相邻图表。 您不再需要手动复制您的划线和标记。在下面的图片和视频中,您可以查看和评定VR Sync Charts实用程序的工作。 建议: 在所有图表上指定指标。 在终端设置中设置为通过双击选择一个对象。 对该程序无法在策略测试器中进行测试,请看下面的视频。 有点 同步任何图形对象 将图表与任何时间范围同步 所有更新都是免费的 适合初学者和专业交易者 设置数量不大,有助于有选择地做同步 适用于任何金融工具(Forex, CFD, Crypto, Metalls, Futures) 易于安装和配置,该程序带有文本和视频说明 版本: MetaTrader 4 博客上的更多信息 跳转 您的反馈是最好的感谢! 留下评价。 技术支持、设置、set文件、试用期可以在 聊天群
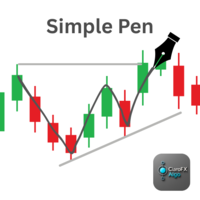
ClaroFxAlgo - Simple Pen v1.00 Free-Hand Drawing Tool for MetaTrader 5 Overview:
ClaroFxAlgo - Simple Pen is a lightweight and intuitive tool that allows traders to draw directly on the MT5 chart using just mouse movements. Designed to enhance visual analysis, this tool makes it easy to sketch trends, highlight zones, or mark chart behavior on-the-fly. Key Features: Draw on chart by simply holding Ctrl and moving the mouse — no clicks required Customizable drawing settings:
• Drawing col
FREE

The Daily Highs and Lows Indicator is a versatile tool that combines support and resistance levels with real-time market dynamics. By incorporating previous daily highs and lows, it provides valuable insights into market psychology and identifies potential areas of price reversals or breakouts. With its ability to adapt to changing market conditions and customizable options, traders can stay ahead of trends and make informed decisions. This indicator is suitable for various trading styles and ti
FREE

Alert Indicator for exponential moving average cross blue arrow for buy alert , fast ema 14 crosses above 50 pink arrow for sell alert , fast ema 14 crosses below 50 Default 14 ema fast & 50 ema slow add these indicators to chart Full Alerts , push, email, phone inputs for moving average lengths and alarm on off settings Please contact for help of an indicator alert suggestion
FREE
FREE VERSION FOR GOLD (XAUUSD) AND BTCUSD Dont forget to rate after use this indicator, Thanks.
Features: Clear Buy/Sell labels with directional arrows. Automatic Take Profit (TP) & Stop Loss (SL) labels for better risk management. Easy-to-read chart signals (no messy lines). Works on any timeframe and any asset (Forex, Gold, Indices, Crypto, Stocks). Compatible with MetaTrader 5 (MT5 desktop & mobile sync) . Perfect for: Beginner traders who need straightforward sign
FREE

This Supertrend strategy will allow you to enter a long or short from a supertrend trend change. Both ATR period and ATR multiplier are adjustable. If you check off "Change ATR Calculation Method" it will base the calculation off the S MA and give you slightly different results, which may work better depending on the asset. Be sure to enter slippage and commission into the properties to give you realistic results. If you want automatic trade with Supertrend indicator, please buy following pr
FREE
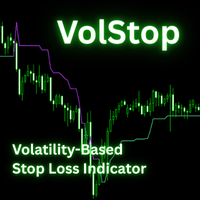
The VolStop Adaptive Volatility-Based Trailing Stop Indicator for MT5 VolStop is a precision volatility-stop indicator for MetaTrader 5, built for traders who want to stay in winning trades longer and exit with discipline. Instead of fixed pips or moving averages, VolStop dynamically tracks price action with ATR-based bands, automatically adapting to market turbulence. Key Features Adaptive Volatility Stops – Calculates a dynamic trailing stop using ATR and a user-set multiplier to match changi
FREE

STAMINA HUD – Advanced Market & Trend Dashboard (MT5) STAMINA HUD is a professional market information panel designed for traders who want clarity, speed, and control directly on the chart. It provides a clean heads-up display (HUD) with essential market data and multi-timeframe trend direction , without cluttering the chart or generating trading signals.
What STAMINA HUD Shows Current Price
Spread (in real pips)
Today High–Low range (pips)
Average D
FREE

Highest High and Lowest Low (HH_LL) Indicator Description: The HH_LL Indicator is a trading tool designed to help traders identify key market points by automatically drawing Higher High (HH) and Lower Low (LL) lines across multiple timeframes. This indicator allows traders to easily spot significant levels on the chart, facilitating more accurate trading decisions. Key Features: Multi-Timeframe Analysis: The indicator supports various timeframes, including M30, H1, and H4. This enables traders t
FREE

MAD Bands (Moving Average Deviation Bands) MAD Bands are intended to be used when you want to visually check the behavior of price volatility in relation to a moving average.
MAD_Bands (MQL5 version) parameter description This document explains the MT4 parameter input screen for each setting item (input parameter). Group: Main (basic settings) Period Default : 20 Explanation : The number of candlesticks used to calculate the moving average (Mid) and band width. The larger the value
FREE

Hull Suite by Riz | MT5 Indicator Overview: Hull Suite is a premium trend-following indicator that combines three powerful Hull Moving Average variations (HMA, EHMA, THMA) into one versatile tool. Designed for traders who demand clarity and precision, this indicator helps identify trend direction with minimal lag while filtering out market noise. Key Features: Three Hull Variations – Switch between HMA (classic), EHMA (exponential smoothing), and THMA (triple weighted) to match your trading styl
FREE

Adiciona marca d'água com nome do ativo em negociação. Pode ser ajustado definindo tamanho da fonte e coloração do texto. Testado com vários ativos do mercado B3 e Forex Adione ao gráfico e configure de acordo com a necessidade. Caso tenha problemas sinta-se a-vontade para nos avisar e providenciaremos a correção logo que possível. ______________________________
FREE
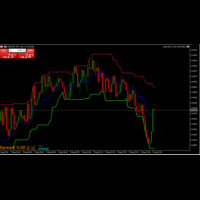
The Donchian Channel Indicator I created is a powerful tool for analyzing price trends and volatility. By plotting the highest high and lowest low over a specified period, it helps identify potential breakout opportunities and trend reversals. This indicator is valuable for traders seeking to understand market dynamics and make informed decisions based on price movements. Its simplicity and effectiveness make it an essential addition to any trading strategy.
FREE

Time Candle with Sound Alert
This indicator will be display the time left candle Features : 1. Multi Time Frames, Multi Pairs 2. Time Left 2. Position dynamic with Bid Price or Edge of Chart Screen 3. Font Size and Color 4. Display Current Spread, Maximum Spread and Minimum Spread
Note: Maximum and Minimum Spread will be reset when you change TF Tested On MT5 Version 5 Build 5200
If you want the source code, just PM me
FREE

[TH] คำบรรยายสินค้า: The Horse Pro Signal (WinWiFi Robot Series) The Horse Pro Signal คืออินดิเคเตอร์ระดับมืออาชีพรุ่นล่าสุดจากตระกูล WinWiFi Robot Series ออกแบบมาสำหรับแพลตฟอร์ม MetaTrader 5 (MT5) โดยเฉพาะ เพื่อช่วยเทรดเดอร์ในการวิเคราะห์พฤติกรรมราคา (Price Action) ทั้งในสภาวะตลาดที่มีเทรนด์ชัดเจนและช่วงตลาดไซด์เวย์ (Sideways) คุณสมบัติเด่น: การวิเคราะห์แท่งเทียนอัจฉริยะ: ระบบอ้างอิงการเคลื่อนที่ของราคาตามเทรนด์และสลับกับการกรองสัญญานในช่วงไซด์เวย์ เพื่อความแม่นยำสูงสุด การแสดงผลที่ชัดเจน: มาพ
FREE

I'm sure after a lot of research on the internet, you haven't found any indicator that can help you with forex or binary trading in the latest probability strategy created by famous trader Ronald Cutrim. The strategy is based on a simple count of green and red candles, checking for a numerical imbalance between them over a certain period of time on an investment market chart. If this imbalance is confirmed and is equal to or greater than 16%, according to trader Ronald Cutrim, creator of the pro
FREE
VWAP Indicator, the short form of Volume Weighted Average Price, is similar to a moving average but takes into consideration the tick volume of the candles. The indicator calculates the moving average multiplying the price of each candle for the tick volume in the candle. Said calculation weighs with more significance price where more transactions were made.
Features: Visual styling customizable Period customizable Ease of use
FREE
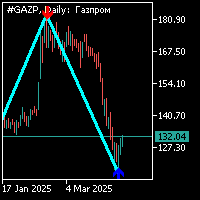
之字形指示器是标准的,周期为34,带有额外的箭头信号。 附加信号与之字形指示器分开计算。该指标的工作如下:1。 当形成之字形指示器的一段并且附加信号以箭头的形式出现时,您需要在箭头的方向上打开一个位置;2。 当zig-zag指示器的另一个臂在与前一个臂的顶部的附加信号(箭头)相反的方向上形成时,就可以建立一个挂单的位置。 在形成与附加信号(箭头)相反的锯齿形肩之后,您可以添加到之前的打开位置或将止损移动到这个水平;4. 如果您以保守的交易模式进行交易,则无法在价格走势的第一次回调之前开设额外的头寸;5。 为了准确地进入市场,您可以等待zig-zag指标段的形成和高级时间框架上的额外信号的出现,同时在距离未平仓头寸不超过40点的位置放置止损。 6. 在您为交易添加了额外的头寸后,未平仓头寸的止损应保持在相同的价格水平,如果头寸在止损处关闭,那么您将以平均值获利;7。 止损,建议在下一个价格回调形成后重新排列(指标的一段将形成之字形朝向附加信号(箭头))。 8. 如果在之字形段形成后,一个额外的信号以箭头的形式出现在你交易的时间框架上,所有的开放头寸都被关闭 9. 在高度波动的金融市场中,

买卖双方压力指标是一个综合的市场分析工具,能够同时显示从M1分钟图到D1日线图等多个时间框架的市场情绪和力量对比。该指标通过精密的移动平均动量分析算法,在用户可自定义配置的周期内准确计算买方压力和卖方压力的具体百分比数值。其直观的可视化操作面板采用动态进度条设计,买方力量以醒目的青色(蓝绿色)显示,卖方主导力量则以鲜明的红色标识,当压力值达到显著水平时还会显示精确的百分比数值。每个时间框架都集成了专业的ADX平均趋向指数强度测量功能,配备清晰的方向性指标来准确识别和显示当前的上升趋势、下降趋势或横盘震荡市场状态。特别是在市场处于震荡整理期间(当ADX数值低于23阈值时),经验丰富的交易者可以灵活运用区间交易策略,通过在关键支撑位附近逢低买入,在重要阻力区域附近逢高卖出来获取稳定收益。智能化的彩色信号提示点系统为交易者提供即时的视觉确认,帮助准确判断市场条件变化并把握最佳的进场和出场时机。 成功消息- 分析完成!多时间框架情绪数据已准备好用于战略交易决策。

Async Charts is an indicator to synchronize charts and display a customized crosshair (cursor) on all selected charts. This is a useful utility for traders using multiple timeframes of analyzing multiple symbols for trade entry or exit.
Main Features : Real time Crosshair Synchronization on All Selected Charts
Supports Multiple Timeframes and Multiple Symbols at the same time
Auto Scroll Option
Graphical Adjustment of Color, Font, Size, ...
Locking All or Locking Specific Charts
More and More .
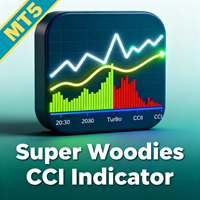
提升您的交易优势,使用 Super Woodies CCI Indicator MT5,这是一个先进的动量振荡器,受肯·伍德著名的 Woodies CCI 系统启发,该系统在 2000 年代初因其双 CCI 方法用于发现循环模式和高概率设置而在日内交易者中流行。广泛受到外汇、股票和商品交易者的青睐,这个指标利用 Commodity Channel Index (CCI) 来检测超买/超卖状况、趋势延续和反转,社区论坛如 Forex Factory 和 TradingView 强调其在减少虚假信号方面的有效性——通常通过清晰的视觉提示如 Zero Line Rejects 和 Trend Line Breaks 将胜率提高 15-25% 在基于动量的策略中。其持久吸引力在于简化复杂的市场动态,在波动会话中启用精确入口,同时最小化情绪交易,使其理想用于剥头皮者、波段交易者和寻求强劲趋势强度确认的自动化系统。 Super Woodies CCI Indicator MT5 通过彩色直方图可视化融合:白色 CCI 线(默认周期 100,典型价格)用于核心动量,黄色 Turbo CCI (TCC

-蜡烛芯填充趋势概念
在市场的高波动性事件中,蜡烛往往会在其移动过程中产生灯芯。蜡烛图中的灯芯反映了价格的拒绝。大多数情况下,这些蜡烛芯被填满是因为有巨大的成交量向该方向推动。烛芯填充趋势扫描那些专注于趋势市场的机会。
它有一个成功率模拟器仪表板,显示带有进入点、获利和止损的实时信号。这个成功率模拟器可以作为回溯测试,检查哪些输入在过去有更好的利润。它计算点数和百分比的利润,根据过去的表现给出一个整体的概念,什么是最好的参数。
- 投入
-趋势阀芯。这个输入决定了指标所要扫描的阀芯的大小。它是以百分比来衡量的。它的默认值为20%。
-信号的数量。这是成功率模拟器所要扫描的信号数量。
-移动平均数。这个过滤器是移动平均线指标和RSI的组合。用户有机会根据自己的需要设置RSI和移动平均线。
-前一栏方向。这个功能可以避免或允许基于前一根蜡烛的信号。如果是真的,该指标将只考虑在前一根蜡烛是在相同的趋势方向上的灯芯作为信号。如果它是假的,它将考虑所有的灯芯。
-最后的高点和低点:该功能允许交易者在最后的 "x "条中扫描最后的高点和低点,以避免范围期。
-最小的蜡烛尺寸。此

No Wick Candle Identifier Best for Gold (XAUUSD) and Forex pairs | Works on any timeframe No Wick Candle Identifier is a price-action indicator designed to highlight high-intent candles where price opens exactly at the extreme (high or low).
These candles reflect strong institutional participation and often act as decision points, continuation triggers, or high-probability reaction levels when price revisits them. The indicator is especially effective on Gold (XAUUSD) and Forex pairs , and it w
FREE

此指标显示世界主要市场的当前时间。它也显示当前时段。 使用非常容易。它不会占用太多图表空间。 它可以与 EA 或其它面板一起工作, 比如 虚拟交易板 。 这是经典风格版本。 Dear friends and users of our EAs, please add your ratings in the Reviews section. All updates to our forex software are free ! This is a free trading utility! 其它功能: 输入参数中有一个选项: 显示/隐藏鼠标覆盖按钮提示, 您也可以选择提示的语言英语 / 俄语; 关闭按钮终止此应用程序; 最大化/最小化按钮在图表上缩放格板; 格板可以在图表上移动。要想移动,在面板上部靠近关闭和最小化按钮的地方用鼠标拖拽,移动到期望的位置。 Expforex,Vladon,Indicator,Utility
FREE
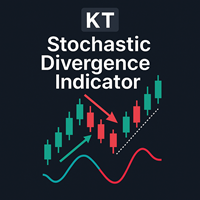
背离是市场中预测价格反转的重要信号之一。KT Stoch Divergence 指标可识别价格与随机指标之间形成的常规和隐藏背离。
KT Stoch Divergence 的局限性
仅将随机背离用作入场信号可能存在较大风险。并非所有背离都预示强烈的反转信号。为了提高准确率,建议结合价格行为和趋势方向使用。
功能特色
标注价格与随机指标之间的常规和隐藏背离。 支持趋势反转与趋势延续的交易策略。 可嵌入至自动交易专家顾问(EA)中使用。 过滤掉不对称背离,减少图表混乱并提升精度。 既可用于入场,也可用于出场。 包含所有 MetaTrader 提供的预警功能。
什么是背离? 通常来说,当价格创出新高时,振荡指标也应创出新高;当价格创出新低时,振荡指标也应创出新低。当价格与振荡指标未同步时,即为出现背离。这表示价格与指标行为相矛盾。背离分为两种类型:
常规背离 常规看涨背离:价格创出新低,但指标创出更高的低点。 常规看跌背离:价格创出新高,但指标创出更低的高点。 隐藏背离 隐藏看涨背离:价格创出更高的低点,指标却创出更低的低点。 隐藏看跌背离:价格创出更低的高点,指标却创出更高的高点

KT Heiken Ashi Alert 基于标准的平均足蜡烛图绘制买入和卖出箭头,并发出交易提醒。对于希望将 Heiken Ashi 应用于交易策略的交易者来说,这是一个必备工具。 当 Heiken Ashi 从空头状态变为多头状态时,绘制买入箭头。 当 Heiken Ashi 从多头状态变为空头状态时,绘制卖出箭头。 支持手机通知、电子邮件、声音和弹窗提醒功能。
什么是 Heiken Ashi? 在日语中,“Heiken Ashi” 的意思是“平均蜡烛”。它用于使蜡烛图更加易于阅读和识别趋势。交易者可以使用 Heiken Ashi 进行进场和出场决策。颜色的变化通常代表市场方向的变化。
重要提示
不建议将 Heiken Ashi Alerts 作为单独使用的指标,应与其他技术指标结合使用以获得更准确的分析。 趋势的改变通常从一根具有上下影线的小蜡烛开始。 没有上影线的红色蜡烛表示强烈的下跌趋势。 没有下影线的蓝色蜡烛表示强烈的上涨趋势。
Heiken Ashi 计算公式 Heiken Ashi 蜡烛图与普通的日本蜡烛图类似,但计算方式不同。 开盘价 =(上一根蜡烛的开盘价 +
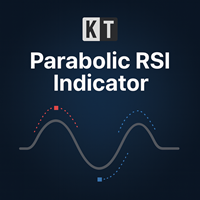
KT Parabolic RSI 将抛物线SAR直接叠加在RSI线上,用来突出可能的市场转折点。传统的RSI超买和超卖读数已经提示潜在的反转,但加入PSAR过滤器后,能有效去除大量噪音,使信号更加清晰和可靠,从而为交易者提供更稳健的入场和出场机会。 大方块信号: 当RSI处于超买或超卖区域时,Parabolic SAR翻转。这通常标志着高概率的市场转折。 小方块信号: 当RSI位于中性区间时出现的SAR翻转。将其视为低概率提示,更适合用于部分止盈或顺势跟随。
功能特点 将RSI动能和Parabolic SAR趋势翻转整合在同一个窗口中,无需再使用两个分离的指标。 出现在RSI窗口中的方块标记会同步显示在主图表上,这样您可以在观察价格走势的同时捕捉到信号。 结合K线形态分析和RSI-SAR定量信号,帮助您在入场前确认图表形态的可靠性。 支持自定义RSI周期、Parabolic SAR步长与最大值,以及超买和超卖阈值,以便适应不同交易风格与市场环境。 提供弹窗、声音、邮件和移动推送提醒,让您即使不在电脑前也能及时掌握每一个信号。
为什么结合RSI和Parabolic SAR有效 RSI

这是一个组合指标分析趋势、支撑阻力、买卖点。运用了均线MA、布林带、KDJ、CCI、RSI。
主图上下线是布林带上下线,采用的是20周期和2.3标准差可以用来支撑阻力。 中间的是分析趋势的均线,趋势分析是用均线多周期: 为涨趋势,反之为下跌趋势。在同一种颜色,基本说明趋势没有发生变化。 子图是由 KDJ、CCI、RSI三个指标组成,大于70超买,小于30超卖, 智能提示是运用了算法,主要计算布林带, KDJ、CCI、RSI指标
有三个或四个指标超出市场常态就会发出提示行情可能反转。 子图指标运用了很多数据,刚刚开始加载会有点慢,耐心等待就可以 这个指标是子图指标,还要再下我发布的MMB分析,这样就刚刚好组成一套分析
电脑分辨率的文本大小请设置100%,不然字体会不一样
FREE
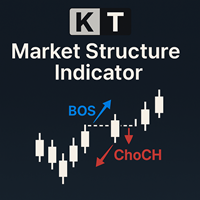
The KT Market Structure intelligently detects and displays Break of Structure (BOS) , Change of Character (CHoCH) , Equal Highs/Lows (EQL) , and various significant swing high/low points using our proprietary algorithm for accurate pattern detection. It also offers advanced pattern analysis by effectively demonstrating the captured profit for each pattern. A fully automated EA based on this indicator is available here: KT Market Structure EA MT5
Features
Accurate Pattern Detection: Our advance

You may find this indicator helpfull if you are following a session based strategy. The bars are colored according to the sessions. Everything is customisable.
Settings: + Asia Session: zime, color, high, low + London Session: zime, color, high, low + US Session: zime, color, high, low
Please feel free to comment if you wish a feature and/or give a review. Thanks.
FREE

Highly configurable Williams %R indicator. Features: Highly customizable alert functions (at levels, crosses, direction changes via email, push, sound, popup) Multi timeframe ability Color customization (at levels, crosses, direction changes) Linear interpolation and histogram mode options Works on strategy tester in multi timeframe mode (at weekend without ticks also) Adjustable Levels Parameters:
Williams %R Timeframe: You can set the current or a higher timeframes for Williams %R. Williams
FREE

Haven Fibonacci Volume Profiles — 您的自动市场区间分析师 隆重推出 Haven Fibonacci Volume Profiles — 一款将市场分析提升到新水平的强大工具。该指标可自动识别基于重要转向点(枢轴点)构建的关键价格区间,并在每个区间上叠加详细的成交量分布图和斐波那契水平。这使交易者能够即时了解流动性集中在哪里,以及真正的支撑位和阻力位位于何处。 其他产品 -> 这里 . 无需再猜测哪个区间是有效的。该指标为您完成所有复杂的工作,同时显示历史和当前的价格区间,让您全面了解市场背景。 指标主要功能 自动识别区间: 指标可独立找到重要的高点和低点(枢轴点),并在此之间构建价格区间。 详细的成交量分布图: 为每个区间计算并显示成交量分布图,突出显示交易活动最多和最少的区域。 可自定义的斐波那契水平: 斐波那契水平会自动应用于每个区间。您可以启用、禁用并自定义每个水平的颜色(0.0、0.236、0.5、1.0 等)。 POC(控制点)可视化: 成交量分布图清晰显示成交量最大的水平,该水平通常作为强支撑或阻力。 历史分析: 指标不仅显示当前的价格区间

Megatron Shark Indicator – MT5 Harmonic Pattern Detection Tool The Megatron Shark Indicator is a MetaTrader 5 tool for detecting and displaying Shark harmonic patterns directly on the chart. It automatically identifies bullish and bearish Shark formations, calculates entry, stop-loss, and take-profit levels, and provides real-time alerts. This allows traders to quickly integrate harmonic pattern analysis into their trading process without manual drawing. Advantages * Automatic Pattern Detection
FREE

ATR Plus is an enhanced version of the classic ATR that shows not just volatility itself, but the directional energy of the market .
The indicator converts ATR into a normalized oscillator (0–100), allowing you to clearly see: who dominates the market — buyers or sellers when a trend begins when a trend loses strength when the market shifts into a range where volatility reaches exhaustion zones ATR Plus is perfect for momentum, trend-following, breakout and volatility-based systems. How ATR Plus
FREE

Multi-Currency Strength Dashboard PRO MT5 (v2.6) – 货币强弱仪表盘指标 Multi-Currency Strength Dashboard PRO 是一款用于 MetaTrader 5 的指标,可实时计算并显示 8 种主要货币 (USD、EUR、GBP、JPY、CHF、CAD、AUD、NZD)的相对强弱,并分析最多 28 个外汇货币对 (具体取决于您的经纪商是否提供相应交易品种)。 本工具旨在提供清晰、结构化的强弱概览,帮助您更快地 筛选需要进一步分析的货币对 (强势货币对弱势货币),并识别强弱差较小、方向性可能较弱的组合。 主要功能 图表内可视化仪表盘 :以强弱柱状条显示结果(0–100 归一化刻度)。 最多 28 货币对分析 :自动生成可用品种列表,并支持经纪商后缀(如存在)。 Best Pairs :根据可配置的最小强弱差,列出值得关注的组合。 Worst Pairs :识别强弱差较小的组合,用于过滤与回避。 提醒功能 :强势/弱势货币提醒与最佳机会提醒(可选推送通知)。 v2.6 更新内容 新增 3 种计算模式 : Price
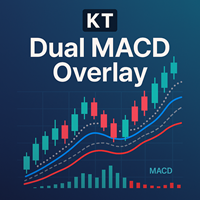
KT Dual MACD Overlay 在价格图表上直接叠加两组完整的 MACD:一组来自当前周期,另一组来自更高周期。快速 MACD 捕捉短线动能,而慢速 MACD 让你始终与大周期趋势保持一致。 两者与 K 线同屏显示,无需来回切换窗口即可获得市场动能的完整视角。
买入信号
主买入: 当上涨趋势启动时,图表会出现一条蓝色竖线。 加仓买入: 快速 MACD 上穿信号线且得到慢速 MACD 与总体多头趋势确认时触发。 卖出信号 主卖出: 当下跌趋势启动时,图表会出现一条橙色竖线。 加仓卖出: 快速 MACD 下穿信号线且得到慢速 MACD 与总体空头趋势确认时触发。
功能 双 MACD(快+慢)联用,形成更完整可靠的系统;单一 MACD 往往缺乏背景。 用竖线清晰标记新趋势起点。 即使错过主入场,仍提供多次顺势再入场机会。 相比标准 MACD 金叉死叉,叠加方案精度与可读性更高。 三类关键事件提醒:主趋势变化、快速 MACD 交叉、来自高周期的慢速 MACD 交叉。 对快速 MACD 交叉进行平滑处理,降低虚假信号。 从零开始编码,界面简洁无杂乱。 支持所有 MetaTrader

INDICATOR: Trend Line GEN INDICATOR: Trend Line GEN Developer: gedeegi General Description Trend Line GEN adalah indikator yang secara otomatis menggambar trendline berdasarkan titik-titik swing penting (highs dan lows) pada chart. Garis-garis ini berfungsi sebagai support dan resistance dinamis untuk membantu pengambilan keputusan trading. Key Features Automatic Swing Detection: Mengidentifikasi pivot high dan pivot low secara otomatis. Flexible Slope Calculation: Pilihan metode perhitungan ke
FREE

Body Ratio 指标(MT5)– 蜡烛图强度与震荡压缩分析器 Body Ratio 指标是一款技术分析工具,用于评估蜡烛图结构,并根据实体(开盘与收盘之间的差)与总范围(最高与最低之间的差)之间的比例来识别市场状态。
这种简单但强大的计算方法可以帮助交易者识别出具有强烈方向性动量的蜡烛图、犹豫不决的蜡烛图以及通常出现在重大突破前的区间压缩阶段。 每根蜡烛图会被实时分类: 弱蜡烛图 (实体 < 总范围的30%):通常出现在 犹豫日 , 十字星 或 上影线/下影线很长的蜡烛图 ,表示市场缺乏明确方向 中性蜡烛图 (实体占比30%–70%):常见于 震荡区间 、 窄幅整理 、 波动收缩 或 压缩形态 (如 NR4、NR7、内包线) 强蜡烛图 (实体 > 总范围的70%):表示 强烈的趋势动能 ,适用于寻找 突破形态 、趋势延续以及顺势交易机会 该指标以彩色柱状图的形式实时显示在图表上,便于快速解读价格行为。 为什么使用此指标 识别 突破前的压缩形态 发现 犹豫蜡烛图 ,避免低质量交易信号 确认 强趋势蜡烛图 ,配合趋势方向交易 根据 蜡烛图质量 过滤不可靠的入场信号 在波动率收缩区域
FREE

Colored Moving Average – Visual Trend Clarity Made Simple The Colored Moving Average is a clean and effective trend visualization tool that enhances any trading strategy. Unlike standard moving averages, this indicator dynamically changes color based on the direction of the trend—green when rising, red when falling—making it easy to spot shifts in momentum at a glance. Perfect for scalping, day trading, or swing trading, this indicator helps you: Instantly identify bullish and bearish phases Fi
FREE

Cycle Sniper MT5 Cycle Sniper MT4 Version and definitions : https://www.mql5.com/en/market/product/51950 Important Notes: MT5 Version does not include Breakout Mode and Late Entry Mode Features.
MT5 Version does not include RSI and MFI filter. **Please contact us after your purchase and we will send you the complimentary indicators to complete the system.**
This indicator does not send any signal without a reason...You can observe and analyze the indicator and the signals it sends Cycle Sni

这个指标采用经典的MACD和Zigzag结合用于检测价格和指标的背离,并采用先进的人工智能技术检测背离的有效性。MACD是指标之王,Zigzag也是非常有用的指标,这个指标把两个指标结合起来,发挥两个指标的优势。检测背离存在概率的问题,通常背离了又背离,所有我们试图通过先进的人工智能技术判断背离的有效性,过滤掉无效的背离,然后通过多种方式提醒用户。 促销价:59$ 功能 1.MACD形式的Zigzag指标 2.检测价格和MACD指标背离 3.通过AI技术检测背离的有效性 4.背离信号预警提醒 5.背离信号手机提醒 6.背离信号邮件提醒 7.使用于多个周期 8.使用 强大的ONNX( Open Neural Network Exchange )模型格式
使用 底背离: 单MACD在下面交叉时,指标会检测出是否底背离,画出向上的箭头,并提醒
顶背离: 单MACD在上面交叉时,指标会检测出是否顶背离,画出向下的箭头,并提醒
输入参数 Fast EMA period = 12; Slow EMA period = 26;

Highly configurable Macd indicator.
Features: Highly customizable alert functions (at levels, crosses, direction changes via email, push, sound, popup) Multi timeframe ability Color customization (at levels, crosses, direction changes) Linear interpolation and histogram mode options Works on strategy tester in multi timeframe mode (at weekend without ticks also) Adjustable Levels Parameters:
Macd Timeframe: You can set the lower/higher timeframes for Macd. Macd Bar Shift: you can set the o
FREE

Channels indicator does not repaint as its based on projecting the falling and raising channels. As a trader you need a path to be able to place your buy and sell trades such as: Supply and Demand , Falling & raising channels. Falling and raising channels can be in any time frame and also can be in all time frames at the same time and the price always flows within these channels. Experienced trades will draw the key levels and channels around the time frames. But, they will not be able to draw
FREE
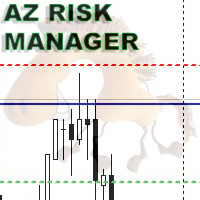
A simple indicator for calculating risk and automatically calculating the take profit line. In the settings, you enter the desired risk to profit ratio, the indicator will automatically calculate the volume for entry and show where to set the take-profit line to maintain the proportion. The risk is calculated based on your balance data. The information panel can be moved around the screen. The stop-loss line can also be moved, this will recalculate the entry volume and the take-profit position.
FREE
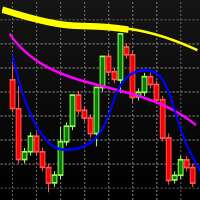
Baseado no indicador MIMA SAR, que é uma combinação dos indicadores MIMA Consolidação e MIMA Tendência, da metodologia Phicube. O indicador é composto pelos 8 fractais, 17,34.72.144.305,610.1292,2554. Sendo a tendência indicada pelas linhas finas e a consolidação pelas linhas mais espessas. Para usar o indicador de maneira adequada deve-se partir do princípio de que tudo na natureza segue o caminho que oferece menor resistência. Isso significa que para uma reversão da tendência ocorrer nesse mod
FREE

Bollinger bands out/in strategy A strategy created by Joe Ross, and very useful for finding trades when the market is overloaded. Indicator You don't need to find where there are entries on the chart, this indicator shows them for you. The entrance The trade is confirmed when the price closes outside the bollinger bands on a candle and the candle after the price closes inside the bands. comment I want to improve this indicator, so you can help me sending me your reviews and comments, thanks :).
FREE

2025 Spike Killer Dashboard - Advanced Trading Signals & Market Analytics Transform Your Trading with Intelligent Market Insights! The 2025 Spike Killer Dashboard is a powerful MQL5 indicator that combines cutting-edge signal generation with an intuitive crystal dashboard for real-time market analysis. Designed for traders who demand precision and clarity, this all-in-one tool delivers actionable signals and comprehensive market metrics at a glance. Key Features: Dual Signal System Shved S

Price Predictor Pro Turn Market Patterns into Predictable Profits!
Are you tired of guessing where the market will go next? With Price Predictor Pro , you’ll trade with confidence by spotting powerful chart patterns and receiving precise price projections —directly on your MT5 chart.
What Price Predictor Pro Does: ️ Detects high-probability chart patterns like Double Tops, Double Bottoms, Head & Shoulders, Flags, Pennants, and more . ️ Instantly projects the next price target using adv
FREE
The Channel Sgnals ProfRoboTrading Indicator for MT5 is an effective Forex trading tool designed to track market movements. The MT5 signal point indicator effectively detects trend reversals after they have already occurred. This Indicator is a fully automated technical tool that includes a number of parameters to track market trends. It automatically examines the ever-changing price dynamics of the market, compares the information with earlier data and generates a trading signal. Because
FREE

1. Introduction The Market Squeeze Momentum Indicator (SQZMOM_LB) is a powerful technical analysis tool designed to help traders identify periods of low market volatility (the "squeeze" phase) and predict the direction and strength of price momentum after the squeeze ends. This indicator combines the principles of Bollinger Bands and Keltner Channels to detect changes in market volatility, along with a momentum oscillator to measure buying/selling pressure. 2. Key Components of the Indicator The
FREE

**Experience Smarter Trading with FVG Super Signal**
Unlock simpler, more decisive trading with **FVG Super Signal**, an advanced MT5 indicator from the WinWiFi Robot Series. This powerful tool uniquely combines the Fair Value Gap (FVG) technique with robust trend-following logic.
* **Clear Signals:** Delivers intuitive Buy/Sell alerts, simplifying your trading decisions. * **Universal Compatibility:** Works seamlessly across all assets and timeframes. * **Highly Versatile:** Ideal for all tr
FREE

Enjoy the Free Candle Color indicator.
Kijun Sen is an element of Ichimoku Kinko Hyo Indicator, it's far too complicated for many traders hence they tend to be confused. We have simplified it so the Kijun Sen will change colors as it activates without the Tenkan Sen, Senkou Span, Up Kumo and Down Kumo. Customize to your period parameter and colors of your choice. Great for beginners and seasoned traders. Set your period and enjoy
GOOD LUCK and ALL THE BEST IN YOUR TRADING JOURNEY !!!!!
FREE

UT Bot Alerts is a technical indicator for MetaTrader 5 that highlights potential directional changes based on momentum conditions.
The indicator marks signal points directly on the chart and can generate optional notifications for convenience. The signal generation logic can operate in two modes: Closed-bar mode: signals are confirmed only after the bar closes. Live-bar mode: signals are displayed during the formation of the current bar. Both modes are available depending on the user's preferr
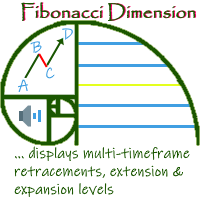
'Fibonacci Dimension' indicator allows display of preset or user-defined multi-timeframe Fibonacci levels. It automatically takes the previous high and low for two user-defined timeframes and calculates their Fibonacci retracement levels. It also considers the retraced level to draw the expansions on every change of price. A complete visual dimension in multiple timeframes allows deriving profitable strategies for execution. Enhanced functionality to view and customize the default Fibonacci Rang
FREE
MetaTrader 市场 - 在您的交易程序端可以直接使用为交易者提供的自动交易和技术指标。
MQL5.community 支付系统 提供给MQL5.com 网站所有已注册用户用于MetaTrade服务方面的事务。您可以使用WebMoney,PayPal 或银行卡进行存取款。
您错过了交易机会:
- 免费交易应用程序
- 8,000+信号可供复制
- 探索金融市场的经济新闻
注册
登录