TilsonT3
- Indikatoren
-
Jonathan Pereira
 Como Desenvolvedor de Sistemas dedicado e apaixonado, adoro me aventurar no mundo da programação, tanto profissionalmente quanto em meu tempo livre. Dominando Java, Python e MQL5, minha experiência se estende a outras áreas, como SQL, bancos de dados relacionais e não relacionais, PySpark, Hadoop
 - Version: 1.0
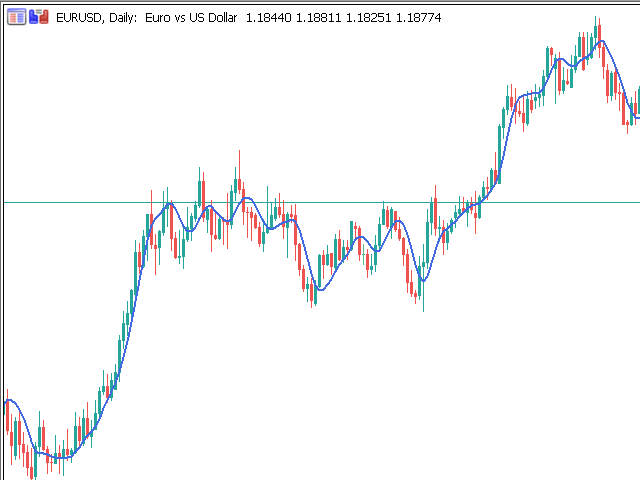
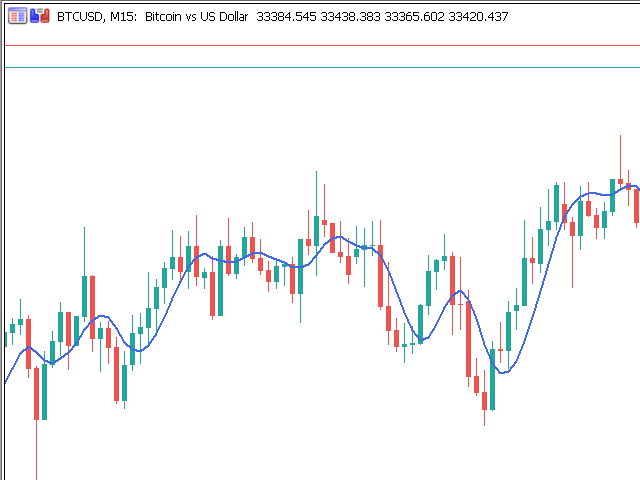
Der gleitende T3-Durchschnitt von Tillson wurde der Welt der technischen Analyse in dem Artikel "A Better Moving Average" vorgestellt, der in der amerikanischen Zeitschrift Technical Analysis of Stock Commodities veröffentlicht wurde. Der von Tim Tillson entwickelte gleitende Durchschnitt faszinierte schon bald die Analysten und Händler auf den Futures-Märkten, da er die Preisreihen glättet und gleichzeitig die für Trendfolgesysteme typische Verzögerung (Lag) verringert.

Muito bom o indicador ,estou gostando muito de usar