YouTube'dan Mağaza ile ilgili eğitici videoları izleyin
Bir alım-satım robotu veya gösterge nasıl satın alınır?
Uzman Danışmanınızı
sanal sunucuda çalıştırın
sanal sunucuda çalıştırın
Satın almadan önce göstergeyi/alım-satım robotunu test edin
Mağazada kazanç sağlamak ister misiniz?
Satış için bir ürün nasıl sunulur?
MetaTrader 5 için teknik göstergeler - 24

El **Heiken Ashi Smoothed** es una versión suavizada del indicador técnico Heiken Ashi, que se utiliza en el análisis de gráficos de velas para identificar tendencias del mercado y pronosticar movimientos de precios. Este indicador se basa en el promedio de datos de precios para formar un gráfico de velas que ayuda a los traders a filtrar el ruido del mercado.
**¿Para qué sirve?** Este indicador se utiliza para identificar cuándo los traders deben permanecer en una operación y cuándo está por
FREE

HiperCube Piyasa Profili! Darwinex Zero'da %20 indirim kodu: DWZ2328770MGM_20 Piyasa Profili, fiyat ve zaman bilgilerini bir dağıtım biçiminde birleştiren grafiksel bir gösterimdir. Fiyat bilgilerini dikey ölçekte (y ekseni) ve hacim bilgilerini yatay ölçekte (x ekseni) görüntüler. Bu grafik türü, piyasa aktivitesine ilişkin içgörüler sunarak, yatırımcıların adil piyasa değerini gerçek zamanlı olarak görselleştirmelerine ve değerlendirmelerine olanak tanır.
Özellikler: Özel Renkler Özel Grafik
FREE

For those who love to follow Volume behavior here it is a little indicator that could be used as a replacement for the old and standard MT5 built-in volume indicator. The trick here is that this indicator paints the volume histogram based on the direction of the candle giving to the trader a quick "Heads Up" on what is happening, visually! It could be used to study and see for instance, the volume and past bars volume during (or, reaching) a peak (Tops and Bottoms). UP candles are shown in pale
FREE
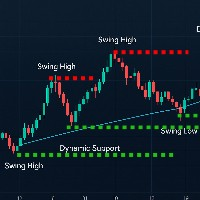
A professional swing point detection indicator that identifies key highs and lows with precision. Features include: Smart Detection : Identifies swing highs/lows based on customizable left/right bar analysis Visual Alerts : Clear arrows and labels (optional) mark swing points Dynamic Lines : Draws support/resistance lines that disappear when price touches them (toggle on/off) Real-Time Alerts : Sound and popup notifications for new swings Non-Intrusive : Preserves all manual chart drawings Perfe
FREE

Highly configurable Bollinger Bands indicator. Features: Highly customizable alert functions (at levels, crosses, direction changes via email, push, sound, popup) Multi timeframe ability Color customization (at levels, crosses, direction changes) Linear interpolation option Works on strategy tester in multi timeframe mode (at weekend without ticks also) Parameters:
Bollinger Bands Timeframe: You can set the lower/higher timeframes for Bollinger Bands. Bollinger Bands Bar Shift: Y ou can set th
FREE

Introducing the South African Sniper Indicator
Created by a dedicated team of South African traders with years of profitable experience in the financial markets, the South African Sniper Indicator is designed to give traders a sharp edge — combining simplicity, precision, and power in one tool.
This is a plug-and-play indicator for MT5, built to deliver accurate BUY and SELL (Sniper Entry) signals — complete with target levels and automated trailing stops. Whether you trade forex, indice
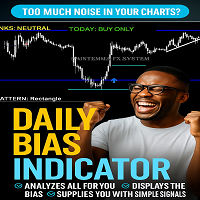
INTRODUCING the Powerful Daily Bias Indicator
The Daily Bias Indicator
Stop Guessing. Start Trading with Confidence.
Tired of staring at your charts and not knowing if today is a buy day or a sell day? The Daily Bias Indicator does the heavy lifting for you.
It scans the market using 7 powerful tools (EMA trend, RSI, MACD, ADX, Volume, Pivot Points & Price Action). It tells you in plain language:
“TODAY: BUY ONLY”
“TODAY: SELL ONLY”
Or “NO CLEAR BIAS” (so you don’t waste money
FREE
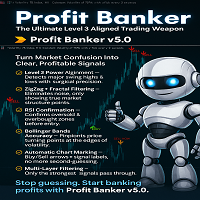
N/B: All our product purchase comes with our free ‘’DAILY SCALPER EA’’ - bit.ly/4qlFLNh Whatsapp Developer for yours after successful purchase
THE 4 GUARDIANS OF PROFIT BANKER
1. LEVEL 3 POWER INDICATOR (The General)
· Identifies MAJOR market turning points · Filters out noise and minor fluctuations · Only acts on significant high/low points
2. ZIGZAG FRACTALS (The Confirmer)
· Validates the Level 3 signals · Ensures swing point authenticity · Adds second-layer confirmation

## ONLY GOLD
## Тiльки Золото
## **Mercaria Professional Trading Zones - Complete Guide** ## **Mercaria Professional Trading Zones - Повний посібник**
### **How Mercaria Zones Work / Як працюють зони Mercaria**
**English:** Mercaria Zones is an advanced trading indicator that identifies high-probability support and resistance areas using ZigZag extremes combined with mathematical zone calculations. The indicator works on multiple timeframes simultaneously, providing a comprehensive view

FVG Detector Multi-TF ( БЕЗ ФЛИКЕРА ) Автоматический индикатор для обнаружения и отображения ключевых ценовых уровней на основе концепций Smart Money Concept (SMC) . Индикатор идентифицирует Ценовые Разрывы Справедливой Стоимости (FVG) и Свинг High/Low одновременно на текущем графике и с нескольких старших таймфреймов. Особенности и преимущества 1. Усовершенствованный Анти-Фликер В отличие от стандартных индикаторов, вызывающих мерцание при тиковых обновлениях, здесь реализована оптимизированна
FREE

Volume Horizon is a horizontal volume indicator that allows you to observe the density of market participants' volumes across various price and time intervals. Volume histograms can be constructed based on ascending or descending market waves, as well as individual bars. This tool enables more precise determination of entry or exit points, relying on levels of maximum volumes or volume-weighted average prices (VWAP).
What makes Volume Horizon unique? 1. Segmentation into ascending and descendi

Professional Percentage Levels Indicator Precision-engineered percentage levels based on period opening prices This professional trading tool automatically plots symmetrical percentage levels from Daily, Weekly, or Monthly opening prices, providing traders with clear reference zones for intraday and swing trading strategies. Note: As part of our initial release, this indicator is being made available at no cost for the first 100 users, or until 15 January 2025. Standard pricing of $49.00 applies
FREE

CandleForce Pro: The Ultimate Decision-Support Dashboard for Modern Traders Introduction: Overcoming the Chaos of Modern Markets
In today's hyper-connected financial markets, the modern trader faces a paradox of choice. We are inundated with an endless stream of data, indicators, news, and strategies, all promising to unlock the secrets of profitable trading. This constant influx often leads to "analysis paralysis"—a state of cognitive overload where conflicting signals create confusion, hesit
FREE

Introduction to Fibonacci Volatility Indicator Volatility indicator can help you to detect any statistical advantage for your trading. Especially, if you are trading with Price Action and Price Patterns, then we recommend to use the Volatility indicator together with your strategy. Especically, Fibonacci Volatility indicator combines the market volatiltiy with Fibonacci Analysis to provide you more advanced volatiltiy indicator. Main Features Fibonacci Volatility in Z score Configuration Mode Fi
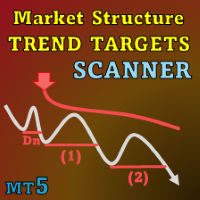
Special offer : ALL TOOLS , just $35 each! New tools will be $30 for the first week or the first 3 purchases ! Trading Tools Channel on MQL5 : Join my MQL5 channel to update the latest news from me I. Giriş
Market Structure Trend Targets Scanner , piyasa trendlerini analiz etmek, breakout noktalarını belirlemek ve dinamik stop loss aracılığıyla riski yönetmek için güçlü bir araçtır. Breakout noktalarını belirlemek için önceki yüksekleri ve düşükleri takip ederek, bu araç trader'la

The Smart Liquidity Profile is color-coded based on the importance of the traded activity at specific price levels, allowing traders to identify significant price levels such as support and resistance levels, supply and demand zones, liquidity gaps, consolidation zones, Buy-Side/Sell-Side Liquidity and so on. Smart Liquidity Profile allows users to choose from a number of different time periods including 'Auto,' 'Fixed Range,' 'Swing High,' 'Swing Low,' 'Session,' 'Day,' 'Week,' 'Month,' 'Quart

Welcome to Propsense, the best solution for new and veteran traders with a simple FREE strategy! NEW to MT5! This indicator is a unique and affordable trading tool built on the teachings of a former bank trader. With this tool, you will be able to see inefficient points with ease. Additionally, traders will have a clean Heads Up Display which will show your running and closed P/L in pips AND currency units. As a highly requested option, a candle timer has been added which will allow you to j

Order block hunter indicator is the best indicator for hunt the order blocks that area where there has been a large concentration of limit orders waiting to be executed Order blocks are identified on a chart by observing previous price action and looking for areas where the price experienced significant movement or sudden changes in direction .This indicator does that for you by using very complicated codes and helps you to take the best areas To buy and sell because it make marks at the best a

Direct Scalping shows the most SUPER SUPER SUPER EARLY opportunity to scalp the market. Do entry as early as possible, as soon as the first sign appears.
It plays sound alert so that you can wait the moment while doing something else.
Remember to cut loss below the '' area. Yes, it is not stop loss but cut loss (exit on candle close). Made for M1 timeframe, but higher is good too.
My new favorite setup: M3 using 8 indicators with different parameters: 11, 18, 25, 32, 39, 46, 53, and 60.
Combin

DiverX is a powerful and versatile divergence indicator developed for the MetaTrader 5 platform. It detects both Regular and Hidden Divergences based on five popular technical indicators: RSI (Relative Strength Index) , RVI (Relative Vigor Index) , Stochastic Oscillator, CCI (Commodity Channel Index) , and MACD (Moving Average Convergence Divergence) and ATR Plus (author’s proprietary indicator, product page >> ) . The indicator plots results directly on the main chart, providing visual lines
FREE
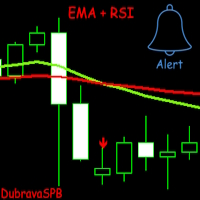
Introducing EMA + RSI – A Trading Indicator Combining Exponential Moving Average (EMA) and Relative Strength Index (RSI) Analysis. The indicator signals trade entries with arrows on the chart when two EMAs cross and the RSI meets the specified conditions.
It is initially optimized for the GBPUSD currency pair on the 1H timeframe, but users can customize it to fit their strategy. Key Features: Flexible settings: Users can adjust EMA length, choose the price for calculation, and configure RSI para
FREE

Fundamentação teórica A VWAP é uma média móvel ajustada pelo volume, ou seja o peso de cada preço corresponde ao volume de ações negociadas no período, dando mais importância ao período em que se tenha mais negociações. [1] VWAP = sum(price[i]*volume[i]) / sum(volume[i]) Metodologia É possível configurar o período que será utilizado para o calculo da VWAP, a cor, a espessura e o estilo da linha. A linha é desenhada desde a o começo da série disponível apenas uma vez para economizar recursos com
FREE

Smart Risk Manager Dashboard is a MetaTrader 5 indicator designed to assist traders with structured risk control and real-time account monitoring.
It provides a visual interface for managing position size, tracking losses and gains, and setting custom trading limits. Key Features SL/TP Risk Calculator
Displays estimated risk and reward directly on the chart using adjustable horizontal lines. Live Dashboard with Metrics
Shows equity, balance, daily gain/loss, trade count, and other key values i

Gösterge tanıtımı:
Gösterge trend çizgisi ve histogram çizer, Küçük fiyat gecikmesi vardır ve gelecekteki işlevleri yoktur, sinyaller kaymaz. Piyasa alanlar arası salınımlar altındayken, gösterge kırmızı ve yeşil histogram gösteriyorsa, bu düşük fiyat bölgesidir, gösterge macenta ve sarı histogram görünüyorsa, burası yüksek fiyat bölgesidir. Yüksek ve düşük fiyat bölgelerine göre piyasanın trendini analiz etmek için de kullanılabilir. Göstergenin bir önceki k satırında yukarı veya aşağı ok old
FREE

The Spots Indicator can be used for Entering and Exiting your trades based on the common candlestick patterns such as: engulfing, hanging man, doji etc. It is designed to publish desktop and mobile notification every time a signal is triggered. However, it is worth noting that this indicator is recommended to be used with other indicator for confirming the entries. It is best to use it with the Investment Castle Trend Lines indicator and the Supply and Demand indicator .
FREE

Enhance your price action strategy: inside bar breakouts at your fingertips
This indicator detects inside bars of several ranges, making it very easy for price action traders to spot and act on inside bar breakouts. [ Installation Guide | Update Guide | Troubleshooting | FAQ | All Products ] Easy to use and understand Customizable color selections The indicator implements visual/mail/push/sound alerts The indicator does not repaint or backpaint An inside bar is a bar or series of bars which is/a
FREE
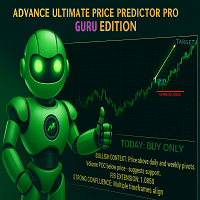
THE ADVANCE PRICE PREDICTOR - GURU EDITION Tired of Guesswork?
Meet the AI-Powered "Almighty Predictor" – Pinpoints High-Probability Targets Before the Move, With Surgical Precision
Stop chasing pips. Start attracting them. Our proprietary algorithm fuses Multi-Timeframe Analysis + Smart Money Concepts + Real-Time Confluence Scoring to give you a clear, calculated edge on every trade.
Are You Constantly Wondering…
"Is this the top, or will it keep going?"
"Where should I real
FREE

The indicator displays divergence for any custom indicator. You only need to specify the indicator name; DeMarker is used by default. Additionally, you can opt for smoothing of values of the selected indicator and set levels whose crossing will trigger an alert. The custom indicator must be compiled (a file with ex5 extension) and located under MQL5/Indicators of the client terminal or in one of the subdirectories. It uses zero bar of the selected indicator with default parameters.
Input parame
FREE

[ Kanalım ] , [ Ürünlerim ] Lorentzian Distance Classifier, Approximate Nearest Neighbors (ANN) çerçevesi içinde temel metrik olarak Lorentz mesafesini kullanan, makine öğrenimi tabanlı bir trading indikatörüdür. Geleneksel Öklid mesafesine dayanmak yerine, finansal fiyat hareketini “bozulmuş” bir fiyat-zaman uzayında gerçekleşiyormuş gibi ele alır (tıpkı görelilik teorisinde büyük kütlelerin uzay-zamanı bükmesi gibi). Bu yaklaşım, indikatörü piyasa gürültüsüne, aykırı değerlere ve olay kaynaklı

Product Name: SavasaLaS Tutelage | Pro Price Action Compass Stop guessing. Start trading with Confluence. SavasaLaS Tutelage is not just an indicator; it is a complete trading system designed for the serious Price Action trader. It eliminates chart noise by strictly enforcing the three pillars of institutional trading: Market Structure , Trend Direction , and Candlestick Verification . Unlike standard indicators that flood your chart with weak signals, SavasaLaS Tutelage waits for the "Perfect O
FREE

G-Labs Market Maker Dashboard - Exclusive Seasonal Offer Elevate your trading with the original G-Labs Market Maker Dashboard, available for a limited time at just $70 USD. Ideal for starter traders, this dashboard has been enhanced with new features and now includes a comprehensive training video. This indicator is for people trading the market makers method and is the entry level dashboard for that strategy is available for both mt4 and mt5. its a market scanner in real time showing peak forma

ATR Plus is an enhanced version of the classic ATR that shows not just volatility itself, but the directional energy of the market .
The indicator converts ATR into a normalized oscillator (0–100), allowing you to clearly see: who dominates the market — buyers or sellers when a trend begins when a trend loses strength when the market shifts into a range where volatility reaches exhaustion zones ATR Plus is perfect for momentum, trend-following, breakout and volatility-based systems. How ATR Plus
FREE

Spline Searcher MT5 — Fiyat Splineleri ve İlgi Noktalarının Erken Tespiti için Çoklu Para Birimi İndikatörü Karmaşık fiyat formasyonlarının başlangıç aşamalarını otomatik olarak tespit eden ve görselleştiren yardımcı bir araçtır. İndikatör **yalnızca manuel işlem için tasarlanmıştır** ve daha karmaşık piyasa formasyonlarını veya trendlerini (bu formasyonların basit yapılar içerebileceği) erken aşamada tespit etmeye çalışan işlemciler içindir. İndikatör, uzak veya yakın mumda tepeye sahip parabo
FREE

Position Size Calculator PRO MT5 (v2.20) Position Size Calculator PRO , işlem başına riskiniz, Zarar Durdur (Stop Loss) mesafeniz ve sembol özelliklerine (tick değeri, tick boyutu, min/maks/adım hacmi, teminat) göre önerilen lot büyüklüğünü hesaplayan MetaTrader 5 için profesyonel bir risk yönetimi aracıdır. Ticari işlem yapmaz: Bu gösterge emir açmaz/kapatmaz ve pozisyonları yönetmez. Para yönetiminizi standartlaştırmak ve girişteki hacim hatalarını azaltmak için tasarlanmış bir karar destek ar

Quantopro Plus: Skyrocket Your Trading Success Unleash the power of precision with Quantopro , the ultimate trading indicator for MetaTrader 5 that transforms market chaos into profitable opportunities. Engineered with a cutting-edge proprietary formula, Quantopro delivers crystal-clear buy and sell signals, empowering traders of all levels to dominate the markets with confidence. Why Choose Quantopro? Dynamic Signal Painting : Instantly spot high-probability trades with vivid, real-time signals
FREE

Do you like scalping? Th is indicator displays information about the latest price quotes received from the broker. [ Installation Guide | Update Guide | Troubleshooting | FAQ | All Products ]
Identify tick trends easily A blue row means the price has increased A red row means the price has decreased Customizable colors and font sizes Display your desired amount of rows The indicator is non-repainting
Parameters Rows: amount of rows with data to display in the chart Font size: font size of the t
FREE
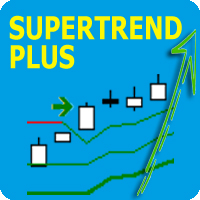
Super Trend Plus is a trading system that uses four Supertrends set with different parameters. The idea behind this system is that when three Supertrends move in the same direction, there is a strong trend confirmation, but entry occurs only when the fourth Supertrend also moves in the same direction as the other three. For example, the first Supertrend could be used with a volatility multiplier of 3 and a period of 10, the second Supertrend with a volatility multiplier of 3 and a period of 12,

Pipsometer is an elegant, real-time panel indicator for MT5 that instantly shows you both your cumulative money and pip gain/loss and total trades executed on the current chart. It dynamically changes its display color—green for net profit and red for net loss—so you can gauge performance at a glance without opening reports or scrolling through trade history.
FREE

INDICATOR: Trend Line GEN INDICATOR: Trend Line GEN Developer: gedeegi General Description Trend Line GEN adalah indikator yang secara otomatis menggambar trendline berdasarkan titik-titik swing penting (highs dan lows) pada chart. Garis-garis ini berfungsi sebagai support dan resistance dinamis untuk membantu pengambilan keputusan trading. Key Features Automatic Swing Detection: Mengidentifikasi pivot high dan pivot low secara otomatis. Flexible Slope Calculation: Pilihan metode perhitungan ke
FREE
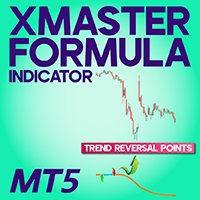
XMaster XHMaster Formula MT5 Indicator – No Repaint Strategy The XMaster / XHMaster Formula Indicator for MetaTrader 5 (MT5) is an upgraded version of the popular MT4 tool, designed to detect trend direction, momentum shifts, and high-probability reversal zones. With enhanced optimization for the MT5 engine, the indicator delivers stable No Repaint signals and performs efficiently on multiple asset classes including Forex, Gold, Cryptocurrencies, and Indices. The MT5 version integrates improved
FREE

Dynamic CMF Calculation: Customize the period for the Chaikin Money Flow (CMF) to fine-tune your analysis and maximize signal precision. Intuitive Color-Coded Alerts: Instantly interpret market conditions with clear visual cues: Green Alert: Indicates the Overbought zone – signaling a potential selling opportunity. Red Alert: Indicates the Oversold zone – suggesting a potential buying opportunity. Gray Alert: Represents the Neutral zone – a signal to wait for a confirmed trend or reversal. Autom
FREE

This all-in-one indicator displays real-time market structure (internal & swing BOS / CHoCH), order blocks, premium & discount zones, equal highs & lows, and much more...allowing traders to automatically mark up their charts with widely used price action methodologies. Following the release of our Fair Value Gap script, we received numerous requests from our community to release more features in the same category. "Smart Money Concepts" (SMC) is a fairly new yet widely used term amongst price a

The Candle Countdown Timer for MetaTrader 4 (also available for MT5) is a vital indicator designed to help you manage your trading time effectively. It keeps you updated about market open and close times by displaying the remaining time before the current candle closes and a new one forms. This powerful tool enables you to make well-informed trading decisions. Key Features: Asia Range: Comes with an option to extend the range. Broker Time, New York, London Time: Displays the current broker time
FREE

Shadow System Candles - AI Trend Visualization
Concept "Stop trading in the dark. Equip your chart with Night Vision."
Shadow System Candles is the visual core of the "Shadow Operation" project. It eliminates market noise and visualizes the true direction of the trend using AI-based logic (ADX + MA integration).
Note: This tool does not generate buy/sell arrows. It is designed to train your eyes to recognize "Active Trends" and "Dangerous Ranges.
Key Features ・AI Logic Coloring[/b]: Automat
FREE

Mostra a média móvel quando ADX > 20 e pinta de verde ou vermelho quando os valores de ADX estão subindo indicando tendência. Quando o ADX é menor que 20 indica movimento lateral consolidado. O indicador não define pontos de entrada, somente mostra a média colorida quando a tendência está se fortalecendo. Faz parte do grupo de indicadores do Indicador Tavim.
FREE

Key Price Levels Indicator Indicator that shows the highs and lows for the significant price levels for past periods that could be potentially considered as reaction levels. The indicator displays the following price levels: Yesterday high and low The day before yesterday high and low Two days back high and low Last week high and low Last month high and low Last three month high and low (Quarter) Last year high and low
FREE

Unlock the full potential of your Pro Thunder V9 indicator with our revolutionary new plugin - Auto Trend Lines! Are you looking for a competitive edge in today's dynamic market? Look no further. With Auto Trend Lines, you can harness the power of precise market trend analysis to make informed trading decisions. This innovative plugin seamlessly integrates with your Pro Thunder V9 indicator, providing you with real-time trend data and pinpointing exact entry and exit points for your trades. Key
FREE
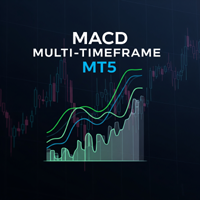
The Multi-Frame MACD Indicator is a robust MetaTrader 5 (MT5) indicator that utilizes the Moving Average Convergence Divergence (MACD) to analyze trends across multiple timeframes. This indicator synchronizes MACD-based trend signals from up to nine timeframes (M1, M5, M15, M30, H1, H4, D1, W1, MN1) and presents them with clear visual cues, including a colored MACD line, signal arrows, and a customizable dashboard. Perfect for traders seeking momentum and trend reversal insights. Features Multi-
FREE

BreakHarmony Multi-Timeframe Breakout Indicator for MT5
The BreakHarmony Multi-Timeframe Breakout Indicator for MT5 is a highly advanced tool providing information on breakout points across different timeframes, aiding traders in decision-making and understanding market movements. [ Features and Manual | MT4 version | All Products ] The indicator tracks breakout points on price charts across 6 timeframes. Breakout prices are indicated with the closing price of the correspondi
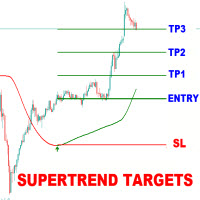
Supertrend Targets Signal is a powerful trend-following and breakout confirmation indicator designed to help traders identify high-probability entry points , visualize dynamic target zones , and receive clean, reliable signals across various market conditions. The core trend logic is built on a custom Supertrend that uses an ATR-based band structure with long smoothing chains—first through a WMA, then an EMA—allowing the trend line to respond to major shifts while ignoring noise. A key addition
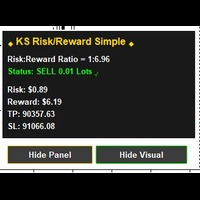
RR Ratio KS Simple Calculator Indicator Overview The RR Ratio KS Simple Calculator Indicator is a free, lightweight tool for MetaTrader 5 that automatically visualizes risk-reward (RR) ratios on your chart. Designed for manual traders and automated systems (EAs), it detects open positions with defined stop-loss (SL) and take-profit (TP) levels, then overlays clear visual zones to show potential risk and reward areas, including precise dollar amounts. This helps traders quickly assess trade setup
FREE

PREDATOR PULSE AI TRADER - ATHENA Quantum Neural Trading System Professional-Grade Institutional Trading Indicator** Overview
This advanced neural network trading system is designed to provide both institutional and retail traders with equal market insight. ATHENA combines deep institutional-level pattern recognition with proven traditional trading strategies, offering a comprehensive two-dimensional market view: standard technical analysis and advanced microanalysis powered by deep learning

This indicator has been developed to identify and display these trends quickly and easily, allowing you to see instantly, those currency pairs which are trending, and those which are not – and in all timeframes, with just one click. The 28 currency pairs are displayed as a fan as they sweep from strong to weak and back again, and this is why we call it the ‘currency array’. All 28 pairs are arrayed before you, giving an instant visual description of those pairs that are trending strongly, those

MT4 Version Most indicators draw lines.
This one draws the battlefield. If you ever bought an EA or indicator based on a perfect equity curve — and then watched it bleed out live — you’re not alone.
The problem? Static logic in a dynamic market. Fibonacci Bollinger Bands adapts.
It combines Bollinger structure with customizable Fibonacci levels to mark zones of control — where price reacts, pauses, or reverses. No magic. Just logic that follows volatility. Why this tool matters It
FREE

The indicator displays volume clusters or volume profiles to choose from. For trading symbols which contain the tape of deals, the indicator can perform calculations based on the tape of deals.
Input variables
StepPoint - cluster step in points, if the value is zero, the step is assigned automatically. HistoryTicks - size of tick history (for VolumeType in the mode TimeAndSales). AssociatedTimeframe - binding the indicator to the specified timeframe of the chart, if the value is equal to Cu

Revolution Martingale is an indicator designed for trading binary options on the M5 timeframe. Features: M5 Timeframe: It is recommended to use the indicator on the M5 timeframe for optimal trading. Trade Entry: Trades should only be opened on the first candle after a signal appears. Signals: A blue diamond indicates a buying opportunity for upward movement, while a red diamond indicates a buying opportunity for downward movement. Configured for Effective Binary Options Trading: The indicator i
FREE
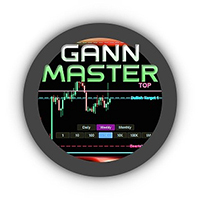
Efsanevi William Gann seviyelerini tam otomatik MT5 indikatöründe. GANN Master, günlük, haftalık ve aylık verilere dayanarak fiyatın en muhtemel dönüş veya trend devamı bölgelerini tespit eder. Temel Özellikler Tek tıkla zaman periyodu: “Daily”, “Weekly” veya “Monthly” düğmesine tıklayarak bugünün, bu haftanın veya bu ayın zonlarını anında çizin Otomatik ve Manuel Modlar Otomatik : GANN Master tüm seviyeleri sizin için hesaplar—manuel girdi gerekmez Manuel : “Top” ve “Bottom” çizgilerini sürükle
Important: The price will increase to 150$ after 8 more purchases Every buyer of this indicator also receives for free: The exclusive Signal Reacter EA, which automatically executes every Signal a step-by-step guide to help you install the Signal Capturer Note: To claim your free EA, just send me a quick message on MQL5.
I present to you the original, self-developed tool that grabs premium signals from top services like the Divergence Bomber, Algo Pumping and Grabber System.
Instructional vid

Identification of support and resistance areas
A useful indicator for traders
completely free
Can be used in all symbols
Can be used in all time frames
It has three different trends: short term, medium term, long term
Settings:
Clr1,2: You can change the color of the lines
Type Trend: You can determine the trend
Message me for questions, criticism and suggestions
FREE
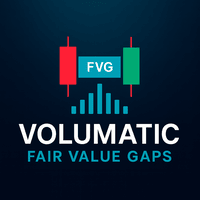
Volumatic Fair Value Gaps is a precision-engineered indicator for identifying, analyzing, and visualizing Fair Value Gaps (FVGs) backed by volume intelligence. This tool goes beyond standard FVG plotting by dissecting volume dynamics inside each gap using lower-timeframe sampling , offering clear insight into whether bulls or bears dominate the imbalance. Designed for technical traders, this indicator overlays high-probability gaps only, visualizes bullish vs. bearish volume composition , and pr

Blahtech Fisher Transform indicator is an oscillator that displays overbought and oversold locations on the chart. The Fisher Transform algorithm transforms prices with any distribution shape into a normal distribution. The end result is a curve with sharp turning points that may help to identify bullish or bearish trends. Fisher Transform values exceeding 1.66 on the daily chart are considered to be good areas for reversal trades. Links [ Install | Update | Training | All Products ]
F

The RSI Divergence Indicator is a powerful tool designed to identify potential reversals in the market by spotting discrepancies between the Relative Strength Index (RSI) and price movement. Divergences can be a significant indication of an impending trend change, either from bullish to bearish or vice versa. This indicator is built for making the task of identifying potential trade opportunities more straightforward and efficient.
Features: Automatic Detection: The indicator scans the chart
FREE

L'indicatore SMC Venom Model BPR è uno strumento professionale per i trader che operano nell'ambito del concetto di Smart Money (SMC). Identifica automaticamente due modelli chiave sul grafico dei prezzi: FVG (Fair Value Gap) è una combinazione di tre candele, in cui c'è un gap tra la prima e la terza candela. Forma una zona tra livelli in cui non c'è supporto di volume, il che spesso porta a una correzione dei prezzi. BPR (Balanced Price Range) è una combinazione di due modelli FVG che for
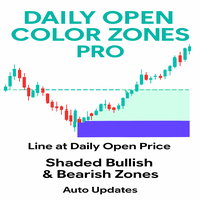
This indicator is a professional tool designed to plot the Daily Open Line and instantly shade the bullish and bearish price zones around it. Instead of leaving traders guessing, it delivers a clear visual map of market sentiment from the very first of the day. Its goal: to help you instantly identify whether the market is trading above or below the daily open — a key reference point for intraday strategies.
The indicator automatically draws a horizontal line at the daily open price and shades
FREE

SAR Colored Indicator with Alarm – Enhance Your Trading Strategy Are you tired of constantly monitoring charts for trend reversals? Introducing the SAR Colored Indicator with Alarm – a powerful, user-friendly tool designed to transform the classic Parabolic SAR (Stop and Reverse) into a dynamic, visually intuitive, and alert-driven system. Perfect for traders of all levels, this indicator is now available in the MQL Market and ready to elevate your trading experience.
What is the SAR Colored In
FREE
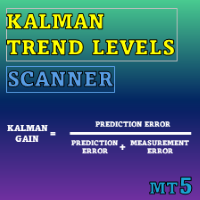
Special offer : ALL TOOLS , just $35 each! New tools will be $30 for the first week or the first 3 purchases ! Trading Tools Channel on MQL5 : Join my MQL5 channel to update the latest news from me Kalman Trend Levels , ileri düzey Kalman filtre teknolojisini kullanan, trend takipli bir gösterge olup traderlara güçlü analitik sinyaller sunar. Hassasiyet ve uyarlanabilirlik için tasarlanmış bu araç, yalnızca kritik destek ve direnç bölgelerini belirlemekle kalmaz, aynı zamanda piyas

Tillson's T3 moving average was introduced to the world of technical analysis in the article ''A Better Moving Average'', published in the American magazine Technical Analysis of Stock Commodities. Developed by Tim Tillson, analysts and traders of futures markets soon became fascinated with this technique that smoothes the price series while decreasing the lag (lag) typical of trend-following systems.
FREE

Moving Average RAINBOW Forex traders use moving averages for different reasons. Some use them as their primary analytical tool, while others simply use them as a confidence builder to back up their investment decisions. In this section, we'll present a few different types of strategies - incorporating them into your trading style is up to you! A technique used in technical analysis to identify changing trends. It is created by placing a large number of moving averages onto the same chart. When a
FREE
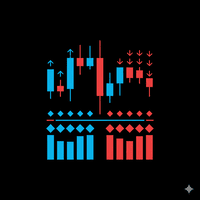
TrendPower All-In-One Strict v1.00 Description TrendPower All-In-One Strict is a comprehensive trend-following trading system designed for MetaTrader 5. It acts as a "confluence detector," meaning it filters market noise by requiring multiple technical indicators to agree before generating a signal. The indicator utilizes a "Strict" logic engine, meaning a signal is only generated when momentum, trend direction, and volatility filters all align perfectly. It displays data in a separate sub-win
A Renko Tick chart based on continuously adjusting percentage.
Live Renko bricks formed by tick data
Adjustable brick width expert for indicator attached Scalp with a Renko, get weird.
The settings can and will break the script if you turn them up too high. Turning off outline mode will not look as nice, but can potentially allow for a larger number of bricks.
FREE
MetaTrader mağazası, geliştiricilerin alım-satım uygulamalarını satabilecekleri basit ve kullanışlı bir sitedir.
Ürününüzü yayınlamanıza yardımcı olacağız ve size Mağaza için ürününüzün açıklamasını nasıl hazırlayacağınızı anlatacağız. Mağazadaki tüm uygulamalar şifreleme korumalıdır ve yalnızca alıcının bilgisayarında çalıştırılabilir. İllegal kopyalama yapılamaz.
Alım-satım fırsatlarını kaçırıyorsunuz:
- Ücretsiz alım-satım uygulamaları
- İşlem kopyalama için 8.000'den fazla sinyal
- Finansal piyasaları keşfetmek için ekonomik haberler
Kayıt
Giriş yap
Gizlilik ve Veri Koruma Politikasını ve MQL5.com Kullanım Şartlarını kabul edersiniz
Hesabınız yoksa, lütfen kaydolun
MQL5.com web sitesine giriş yapmak için çerezlerin kullanımına izin vermelisiniz.
Lütfen tarayıcınızda gerekli ayarı etkinleştirin, aksi takdirde giriş yapamazsınız.