Conheça o Mercado MQL5 no YouTube, assista aos vídeos tutoriais
Como comprar um robô de negociação ou indicador?
Execute seu EA na
hospedagem virtual
hospedagem virtual
Teste indicadores/robôs de negociação antes de comprá-los
Quer ganhar dinheiro no Mercado?
Como apresentar um produto para o consumidor final?
Indicadores Técnicos para MetaTrader 5 - 24

O indicador VR ATR Pro é uma poderosa ferramenta profissional para determinar níveis planejados num instrumento financeiro. A eficiência do indicador foi provada com milhares de testos nas contas demo e reais. O indicador VR ATR Pro funciona usando dados reais e estatísticas vivas no tempo real. As estatísticas são uma ciência exata por isso os dados reais das estatísticas usados nos cálculos matemáticos permitem determinar níveis planejados exatos dum instrumento financeiro. Para um conjunto de

For traders, monitoring price movements is a constant activity, because each price movement determines the action that must be taken next.
This simple indicator will helps traders to display prices more clearly in a larger size.
Users can set the font size and choose the color that will be displayed on the chart. There are three color options that can be selected to be displayed on the chart.
FREE
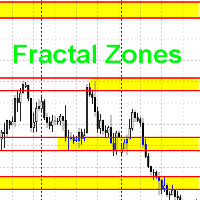
Данный индикатор рисует торговые зоны по фракталам со старших периодов, что упрощает торговлю по уровням.
На одном графике данный индикатор рисует два типа торговых зон. Например если текущий период - H1, то торговые зоны будут искаться по фракталам с H4 и с D1. В стандартных настройках фрактальные зоны с H4 будут рисоваться желтым цветом, а с D1 - зеленым. При наложении зон, происходит смешивание цветов в месте пересечения зон. Как данную вещь поправить, я не знаю в данный момент.
Принцип пои
FREE
Indicador de sinais para opções binárias, que também é usado de forma eficaz no Forex e em outros mercados. É adequado para operações de grid de curto prazo em M1–M5 e inclui sinais para aumento gradual das posições. A versão gratuita funciona apenas no par XAUUSD. A versão completa para MetaTrader 5 está aqui: https://www.mql5.com/en/market/product/156185 O indicador utiliza uma adaptação em dois níveis: um perfil de velocidade básico (configuração “rápido/suave” desde o início) e uma auto-adap
FREE

INDICATOR: GEN RSI Hunter Developer: gedeegi General Description GEN RSI Hunter is a technical indicator based on the Relative Strength Index (RSI) that automatically detects potential BUY and SELL signals based on overbought/oversold conditions and price reversal patterns. This indicator is perfect for traders who want to capture short-term swing opportunities using price action confirmation and price patterns like Double Top and Double Bottom. Signals are confirmed by breakout candles and val
FREE
Descrição: O NR4 & NR7 Inside Bar Highlighter é um indicador que detecta automaticamente padrões de compressão de preços com base na combinação dos padrões NR4 ou NR7 com um Inside Bar. O padrão NR4 (Narrow Range 4) identifica a vela com o menor intervalo das últimas 4 velas, enquanto o NR7 analisa as últimas 7. Quando esses padrões coincidem com um Inside Bar (uma vela totalmente contida dentro da anterior), indicam uma fase de baixa volatilidade , muitas vezes seguida por um forte movimento de
FREE
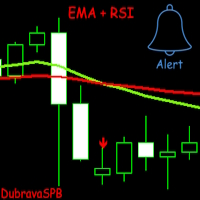
Introducing EMA + RSI – A Trading Indicator Combining Exponential Moving Average (EMA) and Relative Strength Index (RSI) Analysis. The indicator signals trade entries with arrows on the chart when two EMAs cross and the RSI meets the specified conditions.
It is initially optimized for the GBPUSD currency pair on the 1H timeframe, but users can customize it to fit their strategy. Key Features: Flexible settings: Users can adjust EMA length, choose the price for calculation, and configure RSI para
FREE

Candle Countdown Pro – Real-Time Timeframe & Spread Tracker Love it? Hate it? Let me know in a review! Feature requests and ideas for new tools are highly appreciated. :) Try "The AUDCAD Trader":
https://www.mql5.com/en/market/product/151841 Never miss a candle close again! Candle Countdown Pro is an essential trading tool that displays real-time countdowns for multiple timeframes,
live spread monitoring , and key trading information—all in one clean, customizable panel.
Key Features:
FREE

This indicators automatically draws the support and resistances levels (key levels) for you once you've dropped it on a chart. It reduces the hustle of drawing and redrawing these levels every time you analyse prices on a chart. With it, all you have to do is drop it on a chart, adjust the settings to your liking and let the indicator do the rest.
But wait, it gets better; the indicator is absolutely free! For more information: https://youtu.be/rTxbPOBu3nY For more free stuff visit: https:
FREE

The Simple Market Sessions Indicator helps traders visualize the current status of major forex market sessions: Asian , London , New York , and Sydney . It shows whether each market is Open , Active (based on volume) , or Closed directly on the chart. With customizable session times and a volume threshold, this tool helps traders monitor session activity and volume strength, making it easier to decide the best times to trade.
Key features: Displays status: Open, Active (High Volume), or Closed
FREE

VR Sync Charts é uma utilidade para sincronizar o layout entre as janelas. Com ajuda de VR Sync Charts Vossos níveis de tendência, níveis horizontais, e marcação Fibonachi serão sincronizados com todos os gráficos. Esta utilidade permite sincronizar todos os objectos padrão gráficos no terminal MetaTrader, todas vossas tendências, linhas de Gunn e outros objectos serão copiados com precisão para os gráficos adjacentes. Você não precisa mais copiar manualmente suas linhas reguladas e marcações. A

RITZ – 8 Main Market Zones & Smart Candle Timer is an advanced market-timing and session-analysis indicator designed to enhance intraday trading precision. The indicator features an adaptive candle countdown timer with dynamic time format, color warnings, blinking effects, size scaling, and multi-level sound alerts to help traders anticipate candle close and critical market moments accurately. It includes a global market session panel covering 8 major trading zones worldwide , displaying real-t
FREE

RITZ SMART TREND ADAPTIVE FINDER Precision Trend Intelligence. Adaptive. Insightful. Real-Time. Ritz Smart Trend Adaptive Finder is an advanced market intelligence indicator engineered to detect and adapt to evolving market structures with dynamic precision.
It automatically calibrates its analytical period based on real-time volatility, price momentum, and correlation strength — delivering true adaptive trend detection rather than static or lagging signals. By combining Pearson correlation , sl
FREE

When prices breakout resistance levels are combined with momentum oscillator breaks out its historical resistance levels then probability emerges to record farther higher prices. It's strongly encouraged to confirm price breakout with oscillator breakout since they have comparable effects to price breaking support and resistance levels; surely, short trades will have the same perception. Concept is based on find swing levels which based on number of bars by each side to confirm peak or trough
FREE

Transform your MetaTrader 5 chart into a professional trading cockpit. Apex Dashboard is a high-performance utility designed for serious traders who need complete situational awareness. It moves beyond simple monitoring by providing a comprehensive overview of your account's solvency, performance, and risk exposure in real-time. Unlike standard indicators, Apex Dashboard features a Persistent Data Engine . It records your historical Peak Drawdown to a local file, ensuring your risk metrics r
FREE

O indicador que mostra o tempo atual nos principais mercados do mundo. Ele também exibe a sessão atual. Muito fácil de usar. Ele não ocupa muito espaço em um gráfico. Ele pode ser usado em conjunto com Expert Advisors e outros painéis, como o VirtualTradePad . A versão do estilo clássico. Outras características: Há uma opção nos parâmetros de entrada: exibir/esconder dicas quando o mouse está sobre um botão, você também pode selecionar o idioma das dicas Inglês/Russo; O botão Close pára a aplic
FREE

Developed by Charles Le Beau and featured in Alexander Elder's books, the Chandelier Exit sets a trailing stop-loss based on the Average True Range (ATR). The indicator is designed to keep traders in a trend and prevent an early exit as long as the trend extends. Typically, the Chandelier Exit will be above prices during a downtrend and below prices during an uptrend.
Calculation
The original Chandelier Exit formula consists of three parts: a period high or period low, the Average True Rang
FREE
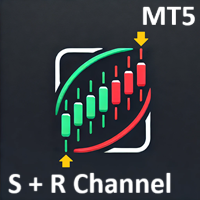
Support Resistance Channel MT5 The Support Resistance Channel MT5 indicator plots dynamic support and resistance levels based on a configurable lookback period, displaying them as green and red lines respectively. It optionally shows goldenrod-colored arrows when price touches these levels, indicating potential trend changes (not explicit buy/sell signals) , along with customizable "RES" and "SUP" labels. With adjustable parameters like lookback period, arrow size, and label offset, it offers t
FREE
WYSIWYG OPEN RANGE BREAKOUT - PRO EDITION
Ultra-precise ORB indicator with smart line-breaking, dynamic ATR-based targets, and multi-session adaptability. Perfect for day, swing, and algorithmic traders seeking clear visuals and actionable levels . Trade with confidence – see what you trade, trade what you see . "What You See Is What You Get" "What You See Is What You Get" – The ultimate ORB indicator delivering ultra-precise trading range visualization with a smart line-breaking system. Built
FREE

Presentation
Another indicator that makes scalping on tick charts easier, it displays an Heiken Ashi graph in Ticks.
It allows to detect entry points and trend reversals. Recommended number of ticks in a candle : 5, 13 or 21.
Parameters Ticks in candle: Number of ticks in a candle (default 5), Displays Trend arrows : displays a trend arrow based on EMA8 and EMA20 crossing, Displays MM50, Displays MM100, Max Candle (CPU): number of candles max to manage, low value will save ressources of your
FREE
This is a simple RSI indicator, but unlike the original one, it sends alerts when volume falls below the upper level or rises above the lower level, so you never miss a trading opportunity. Combined with support and resistance levels, it can provide strong entry opportunities into the market. I recommend keeping the levels as they are, i.e. 75 above and 25 below Check out my signal " PipStorm Invest ", save it to your favorites and come back from time to time to check it again :)
FREE

Trading Exporter for AI Assistant Trading Exporter for AI Assistant é um indicador profissional para MetaTrader 5, projetado para exportar dados de trading completos e estruturados em formato JSON. Seu objetivo é permitir que qualquer assistente de Inteligência Artificial (IA) — seja gratuito ou pago, como ChatGPT, Gemini, Copilot, Claude ou DeepSeek — possa analisar as informações e oferecer recomendações, estratégias e explicações personalizadas. Recomendação Especial: DeepSeek Embora este exp
FREE
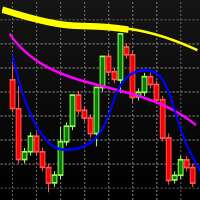
Baseado no indicador MIMA SAR, que é uma combinação dos indicadores MIMA Consolidação e MIMA Tendência, da metodologia Phicube. O indicador é composto pelos 8 fractais, 17,34.72.144.305,610.1292,2554. Sendo a tendência indicada pelas linhas finas e a consolidação pelas linhas mais espessas. Para usar o indicador de maneira adequada deve-se partir do princípio de que tudo na natureza segue o caminho que oferece menor resistência. Isso significa que para uma reversão da tendência ocorrer nesse mod
FREE

When trading price action or using price action triggers such as Pbars, Inside Bars, Shaved Bars, etc. it is important to always wait for the bar/candle to close more than anything else.It is often the case (whether it’s the 4H, hourly, etc) that price action will be dominant in one direction for the majority of the candle only to reverse strongly at the end of the candle. Institutional traders know retail traders are less disciplined than they are. They know a good trading candle pattern coul
FREE
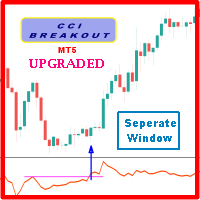
Probability emerges to record higher prices when Commodity Channel Index breaks out oscillator historical resistance level when exhibit overbought values. Since, oscillator breakout of support and resistance have similar effect as price breaks support and resistance levels, therefore, its highly advised to confirm price breakout with oscillator breakout; certainly, will have the same output in short trades. Concept is based on find swing levels which based on number of bars by each side of peak
FREE
Engulfing Pattern is a free indicator available for MT4/MT5 platforms, its work is to provide "alerts" when a "Bullish" or "Bearish engulfing pattern forms on the timeframe. This indicator comes with alerts options mentioned in the parameter section below. Join our MQL5 group , where we share important news and updates. You are also welcome to join our private channel as well, contact me for the private link. Engulfing Pattern Indicator MT4 Other Products Try our Martini EA with 2 years of liv
FREE
If you like this product, please give it a 5 star rating as a token of appreciation.
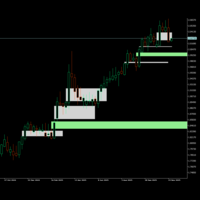
This indicator identifies and displays Fair Value Gaps (FVG) on price charts.
Fair Value Gaps are price zones where there's a significant imbalance between buying and selling pressure, creating "gaps" in price action. The indicator detects two types and when they are mitigated(touched):
Bullish FVG: When a candle's low is above the high of a candle two periods earlier.
Bearish FVG: When a candle's high is bel
FREE

A tool for on-chart strategy backtesting and performance analysis.
A utility for developing, debugging, and testing custom trading ideas and indicator functions.
An indicator designed to quickly test trading concepts and visualize the effectiveness of different input parameters.
An all-in-one sandbox for testing everything from simple crossovers to complex, multi-condition trading systems.

O Indicador de Pressão Compradores-Vendedores exibe sentimento de mercado em múltiplos timeframes de M1 a D1. Calcula percentuais de pressão de compra e venda usando análise de momentum de médias móveis durante um período configurável. O painel visual mostra barras de progresso com força compradora em verde-azulado e domínio vendedor em vermelho, junto com valores percentuais quando significativos. Cada timeframe inclui medição de força de tendência ADX com indicadores direcionais mostrando tend

Async Charts is an indicator to synchronize charts and display a customized crosshair (cursor) on all selected charts. This is a useful utility for traders using multiple timeframes of analyzing multiple symbols for trade entry or exit.
Main Features : Real time Crosshair Synchronization on All Selected Charts
Supports Multiple Timeframes and Multiple Symbols at the same time
Auto Scroll Option
Graphical Adjustment of Color, Font, Size, ...
Locking All or Locking Specific Charts
More and More .
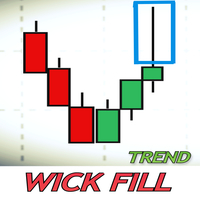
-Conceito de Tendência de preenchimento de pavio
Durante um evento de alta volatilidade no mercado, as velas tendem a criar pavios ao longo dos seus movimentos. Um pavio num candelabro reflecte uma rejeição no preço. A maioria das vezes, estes pavios são preenchidos porque têm um enorme volume a empurrar nessa direcção. O Wick Fill Trend examina as oportunidades centrando-se nos mercados de tendências.
Tem um painel de simulação de taxa de sucesso que exibe sinal ao vivo com ponto de entrada,
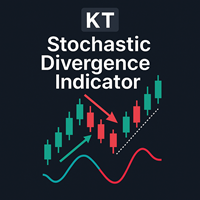
A divergência é um dos sinais mais importantes para indicar uma possível reversão de preço no mercado. O indicador KT Stoch Divergence identifica divergências regulares e ocultas entre o preço e o oscilador estocástico.
Limitações do KT Stoch Divergence
Usar divergência estocástica como único sinal de entrada pode ser arriscado. Nem toda divergência representa uma reversão forte. Para melhores resultados, combine com ação do preço e direção da tendência.
Recursos
Identifica divergências regul

O KT Heiken Ashi Alert exibe setas de compra e venda e gera alertas com base nas velas padrão de Heiken Ashi. É uma ferramenta essencial para traders que desejam incorporar Heiken Ashi em sua estratégia de negociação. Uma seta de compra é exibida quando o Heiken Ashi muda de estado de baixa para alta. Uma seta de venda é exibida quando o Heiken Ashi muda de estado de alta para baixa. Inclui notificações por celular, e-mail, som e alertas pop-up.
O que é exatamente o Heiken Ashi? Em japonês, "He
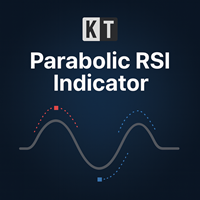
O KT Parabolic RSI sobrepõe o Parabolic SAR diretamente na linha do RSI para destacar possíveis pontos de reversão do mercado. As leituras clássicas de sobrecompra e sobrevenda do RSI já indicam potenciais mudanças, mas com o filtro adicional do PSAR grande parte do ruído é eliminada, tornando os sinais mais claros e confiáveis, oferecendo configurações de trade mais seguras. Sinais de Quadrado Grande: Uma virada do Parabolic SAR em um RSI que está em zona de sobrecompra ou sobrevenda. Estes mar

KT Bollinger Bands Alert é uma versão modificada do clássico indicador Bandas de Bollinger, com alertas ao tocar o preço e etiquetas de preço visíveis para cada banda separadamente.
Eventos de Alerta
Quando o preço atual toca a banda superior de Bollinger. Quando o preço atual toca a banda média de Bollinger. Quando o preço atual toca a banda inferior de Bollinger.
Recursos Eventos de alerta separados para cada banda. Capacidade de definir um intervalo personalizado entre alertas para evitar r
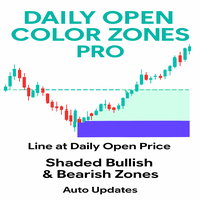
This indicator is a professional tool designed to plot the Daily Open Line and instantly shade the bullish and bearish price zones around it. Instead of leaving traders guessing, it delivers a clear visual map of market sentiment from the very first of the day. Its goal: to help you instantly identify whether the market is trading above or below the daily open — a key reference point for intraday strategies.
The indicator automatically draws a horizontal line at the daily open price and shades
FREE
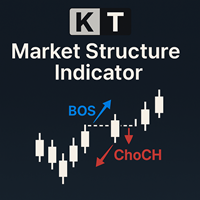
The KT Market Structure intelligently detects and displays Break of Structure (BOS) , Change of Character (CHoCH) , Equal Highs/Lows (EQL) , and various significant swing high/low points using our proprietary algorithm for accurate pattern detection. It also offers advanced pattern analysis by effectively demonstrating the captured profit for each pattern. A fully automated EA based on this indicator is available here: KT Market Structure EA MT5
Features
Accurate Pattern Detection: Our advance

Highly configurable Bollinger Bands indicator. Features: Highly customizable alert functions (at levels, crosses, direction changes via email, push, sound, popup) Multi timeframe ability Color customization (at levels, crosses, direction changes) Linear interpolation option Works on strategy tester in multi timeframe mode (at weekend without ticks also) Parameters:
Bollinger Bands Timeframe: You can set the lower/higher timeframes for Bollinger Bands. Bollinger Bands Bar Shift: Y ou can set th
FREE
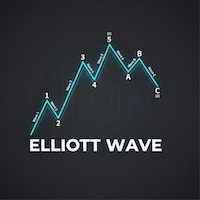
Teoria das Ondas de Elliott Automatizada 1. Contagem automática e redução de viés (Objetividade) Normalmente, a contagem das Ondas de Elliott envolve muita "imaginação" ou opinião pessoal. Este indicador ajuda: Encontrando Ondas de Impulso (1-2-3-4-5): Usa regras estritas (ex: a onda 3 não pode ser a mais curta, a onda 4 não deve sobrepor a onda 1) para mostrar a estrutura correta. Encontrando Ondas Corretivas (A-B-C): Ajuda a identificar retrações para encontrar oportunidades de reentrada na te
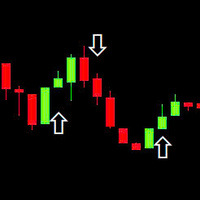
This indicator is based on the RSI (Relative Strength Index) to identify potential Breakout points and draw arrows on the chart to suggest buy/sell signals. Use RSI to find breakout signals. Draw Buy/Sell arrows on the chart. Send alerts when there is a trading signal. Buy (Orange Arrow - 0xFFAA00): When a buy signal appears. Sell (Blue Arrow - 0x0000FF): When a sell signal appears. DRAW_ARROW: Used to draw arrows on the chart.
FREE
Descrição
Candlestick Pattern Analyzer é uma ferramenta avançada para traders discricionários e sistemáticos, projetada para identificar automaticamente os principais padrões de velas japonesas e fornecer uma análise estatística detalhada de seu desempenho histórico. O indicador é ideal para quem deseja verificar a eficácia real dos padrões e utilizá-los em combinação com filtros de confirmação (tendência, níveis-chave, volume etc.) e uma estratégia de gestão de risco bem definida. Funcionalida
RSI Bollinger DualStrike Signals offers a clear and structured approach to identifying areas that may be favorable for potential trend reversals. By combining the RSI with Bollinger Bands, the indicator highlights moments when price shows signs of pressure or loss of momentum. The BUY/SELL signals help traders make more organized and disciplined decisions. It is a useful tool for scalping, day trading, or swing trading not to predict the market, but to improve the reading and understanding of pr
FREE

Haven Fibonacci Volume Profiles — Seu Analista Automático de Faixas de Mercado Apresentando o Haven Fibonacci Volume Profiles — uma ferramenta poderosa que leva a análise de mercado para o próximo nível. Este indicador identifica automaticamente as principais faixas de preço, construídas em pontos de pivô significativos, e sobrepõe em cada uma delas um Perfil de Volume detalhado juntamente com os níveis de Fibonacci. Isso permite que os traders vejam instantaneamente onde a liquidez está concent
Multi-Currency Strength Dashboard PRO MT5 (v2.6) – Medidor de força de moedas com painel visual Multi-Currency Strength Dashboard PRO é um indicador para MetaTrader 5 que mede em tempo real a força relativa de 8 moedas principais (USD, EUR, GBP, JPY, CHF, CAD, AUD, NZD) analisando até 28 pares Forex (dependendo dos símbolos disponíveis no seu broker). O objetivo é fornecer uma visão rápida e estruturada da força/fraqueza das moedas, ajudando a selecionar pares para análise (moeda forte contra mo
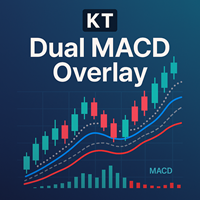
O KT Dual MACD Overlay plota dois osciladores MACD completos no próprio gráfico de preços: um referente ao timeframe atual e outro de um timeframe superior. O MACD rápido capta o impulso de curto prazo, enquanto o MACD lento mantém você alinhado à tendência mais ampla. Com ambos sobrepostos às velas, você obtém uma visão total do momentum sem alternar janelas ou chartframes.
Entradas de compra
Entrada principal: Uma linha vertical azul surge quando começa uma tendência de alta. Entradas adicion

https://www.mql5.com/en/users/gedeegi/seller
GEN (Trend Fib Zones) GEN (Trend Fib Zones) is a professional technical analysis indicator that automatically detects trend structure shifts using swing highs/lows and dynamically plots key Fibonacci retracement and extension zones. Key Features: Automatic Trend Structure Detection Identifies market structure changes using CHoCH (Change of Character) and BOS (Break of Structure) logic. Highlights trend direction based on real swing high/low pivo
FREE

This indicator displays volume delta (of either tick volume or real volume) encoded in a custom symbol, generated by special expert advisers, such as RenkoFromRealTicks . MetaTrader does not allow negative values in the volumes, this is why we need to encode deltas in a special way, and then use CustomVolumeDelta indicator to decode and display the deltas. This indicator is applicable only for custom instruments generated in appropriate way (with signed volumes encoded). It makes no sense to ap
FREE

Cycle Sniper MT5 Cycle Sniper MT4 Version and definitions : https://www.mql5.com/en/market/product/51950 Important Notes: MT5 Version does not include Breakout Mode and Late Entry Mode Features.
MT5 Version does not include RSI and MFI filter. **Please contact us after your purchase and we will send you the complimentary indicators to complete the system.**
This indicator does not send any signal without a reason...You can observe and analyze the indicator and the signals it sends Cycle Sni

Este indicador combina os indicadores clássicos MACD e Zigzag para detectar divergências entre preços e indicadores. Ele também usa tecnologia avançada de inteligência artificial (IA) para detectar a validade da divergência.
O MACD é conhecido como o “rei dos indicadores” e o Zigzag também é um indicador muito útil. Ao combinar estes dois indicadores, este indicador aproveita os pontos fortes de ambos.
A detecção de divergência é um problema probabilístico. Freqüentemente, as divergências oco

The indicator shows your profit and loss (PnL) for the current day right on your trading chart. Anchored at the top-right corner, it displays "PnL: [amount]"—green if you’re up, red if you’re down, white if it’s zero. Every time you close a trade, it updates instantly, adding up your profits, commissions, and swaps from all buys and sells trades since midnight. No fuss, no extra charts—just real-time feedback on how your day’s going.
FREE

Raymond Cloudy Day Indicator for MT5 – Pivot-Based Reversal and Trend Levels Raymond Cloudy Day Indicator is a pivot-based level indicator for MetaTrader 5 (MT5). It was developed by Ngo The Hung based on Raymond’s original idea and is designed to give a structured view of potential reversal zones, trend extensions and support/resistance levels directly on the chart. The default settings are optimised for XAUUSD on the H1 timeframe, but the indicator can be tested and adjusted for other symbols
FREE
AI Volatility Map The AI Volatility Map is a professional indicator designed to analyze market activity by measuring spread and tick velocity. It provides traders with a clear view of market energy levels, helping to identify periods of high volatility, low activity, or sudden changes in momentum. This indicator is especially useful for spotting potential breakouts, trend continuations, or dead market conditions. Key Features: Volatility Score (Blue Line): Represents the normalized market volat
FREE

2025 Spike Killer Dashboard - Advanced Trading Signals & Market Analytics Transform Your Trading with Intelligent Market Insights! The 2025 Spike Killer Dashboard is a powerful MQL5 indicator that combines cutting-edge signal generation with an intuitive crystal dashboard for real-time market analysis. Designed for traders who demand precision and clarity, this all-in-one tool delivers actionable signals and comprehensive market metrics at a glance. Key Features: Dual Signal System Shved S

RSI Momentum Shift Detector - Momentum Change Indicator Maximize your accuracy: Divergences are powerful, but they are even stronger when combined with professional volume analysis. If you like the logic behind this indicator, you will love the Volume Structure Nexus , which identifies where the big players are entering. For fast-paced traders, pair these divergences with Accuracy M1 Scalper to catch explosive moves in lower timeframes.
RSI Momentum Shift Detector is a technical indicator desi
FREE
https://www.mql5.com/en/users/gedeegi/seller
GEN FXTrendZones GEN FXTrendZones is a technical analysis indicator designed to identify key price zones using Fibonacci retracement and extension levels, while also detecting market structure changes such as Break of Structure (BoS) and Change of Character (CHoCH). The indicator helps traders visualize critical swing areas and potential trend continuation or reversal zones. It includes a visual info panel and optional price alert system.
FREE
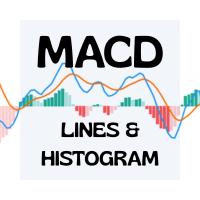
Advanced MACD Indicator with 6 Colors & Adjustable Line Thickness Elevate your trading charts with this fully customizable MACD indicator for MetaTrader 4/5. With six independent color slots and per-line thickness controls, you can tailor every element to your exact preferences. Key Features Six Separate Color Slots
Customize each component with its own color: MACD Line Signal Line Histogram Bars (Bullish) Histogram Bars (Bearish) Zero Line Adjustable Line Thickness
Choose any thickness—from e
FREE

EMA SMA Gold Scalper is a precision scalping indicator developed for XAUUSD (Gold) traders. It combines the dynamic responsiveness of the 55 EMA (High/Low) with the broader market direction filter of the 200 SMA , delivering clean and actionable Buy/Sell signals. The indicator also includes real-time "Live Blue Arrows" , which notify traders when an entry setup is forming—giving you a critical edge before the candle closes. This tool is optimized and recommend for M5 scalping a
FREE

DoubleMACD DoubleMACD DoubleMACD DoubleMACD DoubleMACD DoubleMACD DoubleMACD DoubleMACD DoubleMACD DoubleMACD DoubleMACD DoubleMACD DoubleMACD DoubleMACD DoubleMACD DoubleMACD DoubleMACD DoubleMACD DoubleMACD DoubleMACD DoubleMACD DoubleMACD DoubleMACD DoubleMACD DoubleMACD DoubleMACD DoubleMACD DoubleMACD DoubleMACD DoubleMACD
FREE

Quando se trabalha com vários ativos e tem várias posições abertas em ativos diferentes é um pouco complicado de visualizar quanto de lucro ou prejuízo está em cada ativo, então com esse problema em mente desenvolvi esse indicador onde ele facilita a visualização das operações abertas em cada ativo, onde você poderá abrir vários ativos diferentes e poderá visualizar o resultado individual de cada ativo e agilizar a sua tomada de decisão nos seus trades.
FREE
AP VWAP Bands Pro (MT5) Volume-weighted average price with ±σ bands for clear intraday bias, mean-reversion zones, and dynamic support/resistance. Works on crypto (incl. BTC) , FX , indices , and metals . Uses tick-volume when real volume isn’t available. What it shows VWAP line (volume-weighted mean price). Two envelopes around VWAP (default ±1σ and ±2σ) to highlight balance vs. extension. Reset modes : Day , Week , or Anchor Time (HH:MM) to start VWAP where you need it (e.g., exchange open).
FREE

Excellent tracking performance and minimal noise! This trend detection indicator that avoids whipsaws and uncertain market noise and is also agile enough to react to changes in trend.
It is also designed to adapt to dynamic markets.
Functions mainly as a filter to help you trade in the direction of the trend.
Features.
Simple and easy to use. Low load and easy to try out The excellent tracking performance and smooth lines that make it ideal for market analysis Can be used as a trend filter for
FREE

Thermo MAP is a multicurrency and multitimeframe indicator that display a smart heat map based on proprietary calculations. Watch how Forex market moved and is currently moving with a single dashboard and have a consistent and good idea of what is happening!
It can be suitable for both scalping or medium/long term, just select options that better fit your trading style Symbols list are automatically sorted based on the preferred column. There is the possibility to click on: First row, timeframe
FREE

UT Bot Alerts is a technical indicator for MetaTrader 5 that highlights potential directional changes based on momentum conditions.
The indicator marks signal points directly on the chart and can generate optional notifications for convenience. The signal generation logic can operate in two modes: Closed-bar mode: signals are confirmed only after the bar closes. Live-bar mode: signals are displayed during the formation of the current bar. Both modes are available depending on the user's preferr

El **Heiken Ashi Smoothed** es una versión suavizada del indicador técnico Heiken Ashi, que se utiliza en el análisis de gráficos de velas para identificar tendencias del mercado y pronosticar movimientos de precios. Este indicador se basa en el promedio de datos de precios para formar un gráfico de velas que ayuda a los traders a filtrar el ruido del mercado.
**¿Para qué sirve?** Este indicador se utiliza para identificar cuándo los traders deben permanecer en una operación y cuándo está por
FREE

Prior Cote – Níveis da Sessão Anterior (PT-BR) O indicador Prior Cote traça automaticamente os principais níveis de preços da sessão anterior. Ele é útil como referência visual para análises de suporte, resistência ou estrutura de mercado.
Níveis Traçados: Abertura Máxima Mínima Fechamento Preço Ajustado (média de Máxima, Mínima e Fechamento)
Funcionalidades: Permite ativar ou desativar cada linha separadamente Possibilita personalização da cor de cada nível Atualiza os níveis automaticamente
FREE
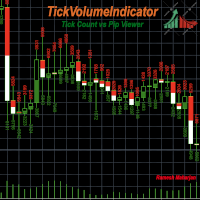
Existem vários indicadores e métodos para identificar tendências num gráfico. O TickVolumeIndicator é um deles. Ajuda a identificar e prever tendências futuras, exibindo tendências passadas utilizando dados de ticks.
O TickVolumeIndicator é um indicador que desenha cores em candles visíveis no gráfico utilizando os volumes dos ticks. Os volumes de ticks são valores de compra e venda. Os utilizadores podem escolher entre as contagens de compra e venda do tick ou as alterações de pips para o per
FREE

The Investment Castle Chances indicator will show signals on the chart for entering a buy or sell trade. There are 2 types of signals for each direction as follows: Buy / Sell (Orange colored candlesticks) Strong Buy (Green colored candlesticks) / Strong Sell (Red colored candlesticks) You may place a buy trade once you see the Buy arrow or vise versa, or you might prefer to wait for a further confirmation “Strong Buy” / “Strong Sell”. This indicator works best with the high time frames H1,
FREE

Swiss CandleTime What ist CandleTime for This indicaor just displays the remaining time for a candle to build. It is best used if you trade with timframes from 3 minutes. I use it in M3 to keep postions. If I have two following red candles i usually liquidate the position. Timeframes M1 to H1 Inputs Arrow displayed => Edit your arrow string Arrow for waiting conditions => Arrow if chart is offline Text Color => color of the text Tell if there is a trend change => tells you, if the two preciding
FREE
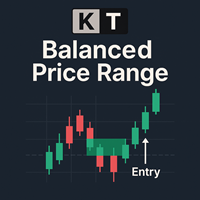
O KT Balanced Price Range destaca a área de sobreposição entre dois Fair Value Gaps (FVGs) consecutivos e opostos. Esse conceito, conhecido como Faixa de Preço Balanceada (BPR), é amplamente utilizado por traders de price action, especialmente os que seguem os métodos de Smart Money Concepts (SMC) e Inner Circle Trader (ICT). Traders frequentemente usam essas zonas BPR para encontrar oportunidades de trade com alta probabilidade, especialmente durante pullbacks ou em momentos de continuação de t
If you love this indicator, please leave a positive rating and comment, it will be a source of motivation to help me create more products <3 Key Takeaways StochRSI is an oscillator that measures the RSI level relative to its high-low range over a period of time. It is more sensitive than the traditional RSI and can highlight overbought or oversold conditions in the market. StochRSI is typically used to generate more frequent and timely trading signals compared with the traditional RSI. StochRSI
FREE
Você sabe por que o mercado MetaTrader é o melhor lugar para vender as estratégias de negociação e indicadores técnicos? Não há necessidade de propaganda ou software de proteção, muito menos problemas de pagamentos. Tudo é providenciado no mercado MetaTrader.
Você está perdendo oportunidades de negociação:
- Aplicativos de negociação gratuitos
- 8 000+ sinais para cópia
- Notícias econômicas para análise dos mercados financeiros
Registro
Login
Se você não tem uma conta, por favor registre-se
Para login e uso do site MQL5.com, você deve ativar o uso de cookies.
Ative esta opção no seu navegador, caso contrário você não poderá fazer login.