YouTubeにあるマーケットチュートリアルビデオをご覧ください
ロボットや指標を購入する
仮想ホスティングで
EAを実行
EAを実行
ロボットや指標を購入前にテストする
マーケットで収入を得る
販売のためにプロダクトをプレゼンテーションする方法
MetaTrader 5のためのテクニカル指標 - 24

VR ATR Pro インジケーターは、金融商品を使用して目標レベルを設定するための強力なプロフェッショナル・ツールです。 インジケーターの有効性は、実際のデモ・アカウントと特別なデモ・アカウントでの何千ものテストによって証明されています。 VR ATR Pro は、実際の統計を使用したデータを利用しているインジケーターです。 統計では、数学計算で実際のデータを使用して、金融商品の正確な目標レベルを計算します。 ファイルのセット、指示、素晴らしいボーナス 私に書いてください メリット インジケーターには、下記のように、いくつかの利点があります。 インジケーターの高精度だとなります。 異常なバーを計算から除外する機能があります。 目標レベルをチャート上に直接表示するシンプルな機能です。 あらゆる金融商品(Forex、Metals、CFD、Futures、Crypto)で動作が可能です。 再描画せず、読み取り値を永久に保存します。 Stop LossやTake Profitのレベルを決めるのに有効です。 Meta Traderでのスマートフォン、電子メール、アラートによる通知の可用性があり

When prices breakout resistance levels are combined with momentum oscillator breaks out its historical resistance levels then probability emerges to record farther higher prices. It's strongly encouraged to confirm price breakout with oscillator breakout since they have comparable effects to price breaking support and resistance levels; surely, short trades will have the same perception. Concept is based on find swing levels which based on number of bars by each side to confirm peak or trough
FREE

Revolution Martingale is an indicator designed for trading binary options on the M5 timeframe. Features: M5 Timeframe: It is recommended to use the indicator on the M5 timeframe for optimal trading. Trade Entry: Trades should only be opened on the first candle after a signal appears. Signals: A blue diamond indicates a buying opportunity for upward movement, while a red diamond indicates a buying opportunity for downward movement. Configured for Effective Binary Options Trading: The indicator i
FREE
NtickChart-BVcandle 特徴 機能を限定した無料版です。
サブウインドウに表示するタイプのティックチャートインジケーターです。 Bob Volman(BV)のスキャルピング手法を参考にしており、シンプルかつ効果的なトレードを実現するためのツールとして設計されています。1 pipette の変化にもこだわるデイトレ・スキャルピング専用のティックチャートです。通常の単位時間ベースのローソク足ではなく、指定されたティック数(ticks_in_candle)ごとにローソク足を生成します。これにより、短期的な価格変動をより詳細に観察することが可能です。 このインジケーターは、特にEUR/USDなどの流動性が高い通貨ペアで、スプレッドが低い環境でのスキャルピングに適しています。 市場の急激な動きを捉え、短期的な利益を狙う。 トレンドの転換点やブレイクアウトポイントを迅速に判断する。 シンプルなチャート構成で、余計な情報に惑わされずにトレードを行う。
次の機能があります。 ティック数の設定が可能 BVは70に設定していますが、現代の大量取引環境下では144の設定をお勧
FREE

Megatron Shark Indicator – MT5 Harmonic Pattern Detection Tool The Megatron Shark Indicator is a MetaTrader 5 tool for detecting and displaying Shark harmonic patterns directly on the chart. It automatically identifies bullish and bearish Shark formations, calculates entry, stop-loss, and take-profit levels, and provides real-time alerts. This allows traders to quickly integrate harmonic pattern analysis into their trading process without manual drawing. Advantages * Automatic Pattern Detection
FREE

AP Day-Week-Month High-Low overlay that draws the prior Day, Week, and Month highs/lows on any chart. Great for session planning, confluence, and alerting when price comes back to important swing levels. What it does Plots 6 lines: Day High/Low , Week High/Low , Month High/Low (from the previous completed sessions). Touch/near alerts when price reaches a selected line (with a user-set tolerance). Works on any symbol and timeframe. Zero external libraries. How to use Drop it on the chart you trad
FREE

A professional tool for trading - the divergence indicator between the AO and the price, which allows you to receive a signal about a trend reversal in a timely manner or catch price pullback movements (depending on the settings). The indicator settings allow you to adjust the strength of the divergence due to the angle of the AO peaks and the percentage change in price, which makes it possible to fine-tune the signal strength. The indicator code is optimized and is tested very quickly as part
FREE

RSI Momentum Shift Detector - Momentum Change Indicator Maximize your accuracy: Divergences are powerful, but they are even stronger when combined with professional volume analysis. If you like the logic behind this indicator, you will love the Volume Structure Nexus , which identifies where the big players are entering. For fast-paced traders, pair these divergences with Accuracy M1 Scalper to catch explosive moves in lower timeframes.
RSI Momentum Shift Detector is a technical indicator desi
FREE

Combining the best of Price Action , Directional Movement , and Divergence/Convergence analysis, Candle Color Trend is a easy and reliable way to identify trend direction. The indicator automatically paints the candles according to the assumption that an uptrend is defined by prices that form a series of higher highs and higher lows. In contrast, a downtrend is defined by prices that form a series of lower highs and lower lows. Additionally, ADX Wilder indicator is used to measure trend weakness
FREE
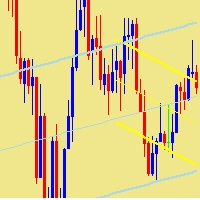
This indicator plots two linear regression channels on the chart for any currency pair or financial instrument, supporting the use of two different timeframes. The first channel uses a shorter period to identify local trends. The second channel uses a longer period to identify overall trends. Each channel displays a main regression line and two lines representing the deviation range. Users can adjust the period of each channel and select the desired timeframe. The indicator helps monitor price m
FREE

Welcome to Ultimate MA MTF , a multi-functional Moving Average (MA) indicator converted from the original TradingView version by ChrisMoody and upgraded with many powerful features. This is not just a typical MA line. It is a comprehensive technical analysis tool designed to provide traders with deep insights into trends, volatility, and potential trading signals, all within a single indicator. Key Features 8 Moving Average Types: Full support for the most popular MA types (SMA, EMA, WMA, HullMA
FREE

Cybertrade ATR Trend Zone - MT5 The indicator shows, by calculating the ATR (Average True Range), the zone of probable price resistance. Indicated to be used as a probable exit point of an operation.
It works on periods longer than the period visible on the chart. All values are available in the form of buffers to simplify possible automations. This indicator is the same one we use in our EA. Also check out our other products.
FREE

A personal implementation of a famous trend principle known as higher high, higher close, lower low, lower close (HHHC - HHHL). It uses price action alone to determine trend direction, trend changes and pullback zones. [ Installation Guide | Update Guide | Troubleshooting | FAQ | All Products ] Customizable breakout period Customizable colors and sizes It is non-repainting and non-backpainting It implements alerts of all kinds The indicator defines three price zones: Buy zones are blue Sell zon
FREE

Mahdad Candle Timer は軽量かつ高精度な MetaTrader 5 用インジケーターで、現在のローソク足がクローズするまでの残り時間を、最新のバーのすぐ横に表示します。スキャルピング、デイトレード、あるいはスイングトレードでローソク足の確定を待つトレーダーなど、正確なタイミングを重視する方に最適です。 主な機能 正確なカウントダウン – 残り時間を HH:MM:SS 形式で表示(ミリ秒もオプションで対応) ダイナミックな配置 – ズームやスケールに関係なく常に最新ローソク足に揃えて表示 スマートなカラー適応 – 背景色やローソク足の方向(上昇/下降)に応じて自動的に文字色を調整 カスタムアラート – ローソク足クローズの数秒前にサウンドまたはポップアップで通知 完全カスタマイズ可能 – フォント、サイズ、色、更新速度、アラーム設定を自由に調整可能 軽量で効率的 – CPU使用率は最小限、他のインジケーターやEAに干渉しない設計 ️ 入力パラメータ Show Milliseconds (true/false) Update Interval (ms) Bull
FREE

VR Sync Chartsは、ウィンドウ間レイアウトを同期するためのツールです。 VR Sync Chartsではトレンドレベル、水平レベルとフィボナッチレイアウトが全チャートと同期できます。 本ソフトウェアでMetaTraderターミナルでの各種標準グラフィックオブジェクトを同期し、全てのトレンドやガーン線などを正確に隣接のチャートへコピーできます。 線とレイアウトを手動ではなく、自動的にコピーできます。以下の図とビデオでは、VR Sync Chartsの動作を評価できます。 推薦: インジケーターを全チャートにセットしてください。 ターミナル設定で「ダブルクリックでオブジェクトを選択」を有効にしてください。 ストラテジーテスターではプログラムをテストできないため、以下のビデオをご覧ください。 メリット 各種グラフィックオブジェクトを同期できます チャートを各種時間枠と同期できます 全てのアップデートは無料です 初心者でもプロでもご利用できます 設定が少なく、同期アイテムを選択できます Forex、CFD、Crypto、Metallis、Futuresなどの各種金融ツールがサポート
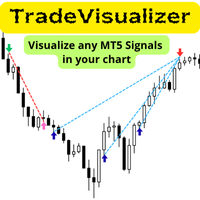
Trade Visualizer インジケーターは、取引データを視覚化し、MT5チャート上にすべての取引履歴を直接表示します。自分のパフォーマンスを分析する場合も、MQL5のシグナル提供者の取引を研究する場合も、このツールは生データを分かりやすいビジュアルに変換します。各トレードはエントリーとエグジットの矢印、接続ライン、価格・利益・ロット数・pipsなどのツールチップで示されます。 注: インジケーターをダウンロードした方は、メールアドレスを添えてご連絡ください。 Trade Visualizer Template を無料でお送りします。 特徴:
• 最新版 ProTrading Analytics Excel Template v1.7 と完全連携。
• 複数トレーダー・戦略を同一銘柄上で比較可能。
• 売買ごとの色・線のスタイル・矢印サイズを自由に設定。
• CSVとブローカーのGMT差を自動調整。
• 複数ブローカーのシンボル接尾辞に対応。
• 戦略ロジックやエントリー精度の可視分析に最適。
FREE

The Daily Highs and Lows Indicator is a versatile tool that combines support and resistance levels with real-time market dynamics. By incorporating previous daily highs and lows, it provides valuable insights into market psychology and identifies potential areas of price reversals or breakouts. With its ability to adapt to changing market conditions and customizable options, traders can stay ahead of trends and make informed decisions. This indicator is suitable for various trading styles and ti
FREE
Hi Traders, The Volume Spike Alert Indicator is a lightweight, non-lagging tool designed to help traders identify unusual volume activity in real time . This indicator calculates the average tick volume over a user-defined number of previous bars and compares it with the current candle’s volume . When the current volume exceeds the average by a specified percentage, the indicator triggers alerts, allowing traders to quickly spot potential breakouts, institutional activity, or strong market inter
FREE

This auxiliary indicator displays time left before closing on the current timeframe with continuous update . It also shows the last trade price and variation from a previous day close in percentage and points. This indicator is pretty handy for daytraders and scalpers who want to precisely monitor closing and opening of candles.
Indicator parameters Show in shifted end - Default: False. Display time and values on screen. If True, Displays only time to close aside last candle. Distance from the
FREE

Bem-vindo a uma nova era de trading com o indicador AI Moving Average, um avançado indicador do MetaTrader 5 projetado para fornecer aos traders insights preditivos sobre os movimentos do mercado. Esta ferramenta combina o poder da IA com a confiabilidade de uma média móvel exponencial sem atraso para oferecer previsões precisas e oportunas das tendências futuras dos preços. Modelo Inovador de Regressão Linear O AI Moving Average aproveita um modelo de aprendizado de máquina de regressão linear
FREE
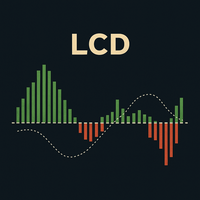
LCDラゲール収束・発散(Laguerre Convergence Divergence):クラシックMACDの高度な改良版 LCDラゲール収束・発散(Laguerre Convergence Divergence) は、古典的なMACDを改良するために設計された、高度なテクニカル指標です。より速く、より感度が高く、適応性の高いモメンタム検出を提供します。主な利点は、従来の移動平均線よりも価格変化に正確に反応する ラゲールフィルター を使用している点です。 主な利点 高い感度と少ない遅延: ラゲールフィルターは、ボラティリティの高い市場で非常に重要な、より早期の売買シグナルを生成します。 ボラティリティへの適応性: **ATR(Average True Range、平均真の範囲)**に基づいて動的に調整され、低ボラティリティ時にはノイズをフィルタリングし、高ボラティリティ時には素早く反応します。 強化されたノイズフィルタリング: 偽のシグナルを減らすために、**決定ゾーン(Decision Zone)**と追加のスムージング(ヒストグラムのEMA)が含まれています。 オプションの出来高
FREE
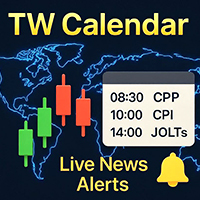
このニュースアシスタントは、トレーダーが必要とする経済イベントを主要な出版ソースから取得するように設計されており、さまざまで簡単なフィルターを備えた端末のマーケットウォッチに基づいてリアルタイムでニュースを発行します。
外国為替トレーダーはマクロ経済指標を使用して、通貨の売買に関する情報に基づいた意思決定を行います。たとえば、トレーダーが米国経済が日本経済よりも速く成長すると信じている場合、米ドルを買って日本円を売るかもしれません。
この製品の特徴: ブローカーのマーケットウォッチに基づいて商品を表示します 値は公開され次第 イベント発行者の主要な情報源から情報を受け取る イベント値解放時の警告 簡単なフィルタリングの可能性 最も近いイベントを表示する イベント値がリリースされる X 分前にアラートを送信 イベントに関する役立つ説明 現在の値と予測、イベントの重要性を表示します 使いやすいグラフィカル ユーザー インターフェイス ライト&ダークのテーマ パネルを最小化および移動する機能 簡単インストール この基本的なツールを使用して、専門的なシグナル指標とともにトレンドを分析でき
FREE

The Investment Castle Chances indicator will show signals on the chart for entering a buy or sell trade. There are 2 types of signals for each direction as follows: Buy / Sell (Orange colored candlesticks) Strong Buy (Green colored candlesticks) / Strong Sell (Red colored candlesticks) You may place a buy trade once you see the Buy arrow or vise versa, or you might prefer to wait for a further confirmation “Strong Buy” / “Strong Sell”. This indicator works best with the high time frames H1,
FREE

RITZ Candle Kaufman’s AMA is a precision market-flow indicator built around Kaufman’s Adaptive Moving Average (KAMA / AMA) — a dynamic smoothing algorithm that automatically adjusts to changing volatility.
This enhanced version interprets AMA momentum directly into smart candle-color signals , giving traders a clean, noise-filtered view of trend strength and directional bias. Where most indicators repaint or react too slowly, RITZ Candle AMA delivers stable, non-repainting color shifts based on
FREE

All traders should know the trend before making their decision when placing the buy or sell orders. The first step always starts with supply and demand , rising and falling channels , trend lines, engulfing candles etc. All the above contribute to what is called “Price Action” and that is the best and most reliable way in trading and catching the trend and making profits, without stress. The Investment Castle Trend Line Indicator will automatically draw the trend lines on the MT5 for you.
FREE

親愛なる友人、ご清聴ありがとうございました。 異なる通貨ペアの動きが相互に関連していることを観察したい場合は、インジケーター Visual Correlation に注目してください。 異なる通貨ペアの動きは相互に関連しています。 Visual Correlation インジケーターを使用すると、スケールを維持しながら 1 つのチャート上にさまざまな金融商品を表示できます。 正の相関、負の相関、または相関なしを定義できます。
親愛なる友人、あなたは、いくつかの楽器が他の楽器よりも先に動くことをご存知でしょう。 このような瞬間は、グラフを重ね合わせることで判断できます。
親愛なる友人へ、チャート上に商品を表示するには、Symbol フィールドに商品名を入力する必要があります。
Version for MT4 https://www.mql5.com/ja/market/product/33063
FREE

Volume Weighted Average Price (VWAP) is a trading benchmark commonly used by Big Players that gives the average price a Symbol has traded throughout the day. It is based on both Volume and price. This indicator contains Daily VWAP and MIDAS' VWAP, which means you are able to anchor the beggining of MIDAS' calculations and, therefore you will be able to use this methodology to study price versus volume moves after anchor point. You will be able to anchor up to 3 HIGH MIDAS VWAP's and 3 LOW.
Wish
FREE
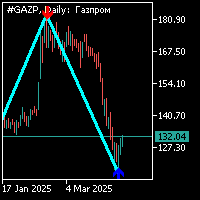
ジグザグ表示器は付加的な矢信号との34の期間と標準的である。 追加の信号は、ジグザグインジケータとは別に計算されます。この指標の作業は次のとおりです。 ジグザグインジケータのセグメントを形成し、追加の矢印信号が表示されるときは、矢印の方向に位置を開く必要があります。 前のアームの上部にある追加の信号(矢印)の反対方向にジグザグインジケータの別のアームを形成すると、保留中の注文の位置を確立することが可能になります。 形成が反対側のジグザグの肩から追加の信号(矢印)に完了した後、以前に開いた位置に追加するか、ストップロスをこのレベルに移動することができ;4. 保守的な取引モードで取引している場合、価格の動きの最初のプルバックの前に追加のポジションを開くことはできません。 市場に正確に参入するには、オープンポジションから40ポイント以下のストップを配置しながら、ジグザグインジケータセグメントの形成とシニアタイムフレーム上の追加信号の出現を待つことができます。 6. あなたが貿易に追加のポジションを追加した後、オープンポジションのストップは同じ価格レベルに保たれるべきです、ポジションがストップ

買い手・売り手圧力インジケーターは、M1からD1までの複数の時間枠で市場センチメントを表示します。設定可能な期間にわたって移動平均モメンタム分析を使用して売買圧力の割合を計算します。ビジュアルパネルは、買い手の強さをティール色で、売り手の優勢を赤色で示すプログレスバーを、重要な場合はパーセンテージ値と共に表示します。各時間枠には、上昇トレンド、下降トレンド、またはレンジ相場を示す方向指標を持つADXトレンド強度測定が含まれます。レンジ期間中(ADX 23以下)、トレーダーはサポートレベルで買い、レジスタンスゾーンで売ることでレンジ戦略を実行できます。色分けされたシグナルドットは、最適なエントリータイミングのため市場状況の迅速な視覚確認を提供します。 成功メッセージ- 分析完了!戦略的取引決定のためのマルチタイムフレームセンチメントデータが準備できました。

TurnPoint Indicator – Market Reversal & Trend Signal Tool The TurnPoint Indicator is designed to help traders identify potential turning points and key levels in the market. By analyzing price action, it highlights areas where reversals or continuations are likely to occur, allowing traders to anticipate trend changes more effectively. This tool incorporates advanced logic to filter signals, reducing noise and false alerts. Users can choose between breakout and pullback modes, depending on their
FREE

Async Charts is an indicator to synchronize charts and display a customized crosshair (cursor) on all selected charts. This is a useful utility for traders using multiple timeframes of analyzing multiple symbols for trade entry or exit.
Main Features : Real time Crosshair Synchronization on All Selected Charts
Supports Multiple Timeframes and Multiple Symbols at the same time
Auto Scroll Option
Graphical Adjustment of Color, Font, Size, ...
Locking All or Locking Specific Charts
More and More .
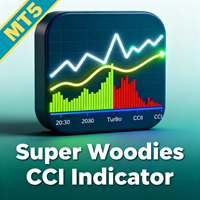
取引の精度を向上させるために、Super Woodies CCI Indicator MT5 を使用してください。これは、ケン・ウッドの有名な Woodies CCI システムに着想を得た先進的なモメンタムオシレーターで、2000年代初頭にデイトレーダー間で人気を博したデュアル CCI アプローチにより、循環パターンと高確率セットアップを検出します。小売および機関トレーダーに広く採用され、強固なトレンドの特定、反転のピンポイント, ブレイクアウトの検出に優れており、研究ではコンフルエンス戦略がRSI, MACD, ADXなどのインジケーター間のコンセンサスを要求することで勝率を20-30%向上させる可能性を示しています。これにより感情的な意思決定を減らし、偽信号からのドローダウンを最小限に抑え、ボラティルな環境でのスキャルピング、デイトレード, またはスイングポジションでの一貫した収益性を強化します. Super Woodies CCI Indicator MT5 は、カラーコードされたヒストグラムを通じてコンフルエンスを視覚化します: ブル信号のためのグリーンシェード(強いグリーン,

-ウィックフィルトレンドの考え方
市場のボラティリティが高い時、ローソク足はその移動の途中で芯を作る傾向があります。ローソク足の芯は、価格の反発を反映しています。これらのウィックは、その方向に押す巨大なボリュームを持っているので、時間の大半は満たされています。Wick Fill Trendは、トレンド相場に焦点を当て、そのチャンスをスキャンします。
エントリーポイント、利益確定、損切りなどのライブシグナルを表示する成功率シミュレーターダッシュボードを備えています。この成功率シミュレーターはバックテストとして使用することができ、過去にどのインプットがより良い利益を上げたかを確認することができます。この成功率シミュレーターは、バックテストとして使用することができ、過去にどの入力がより良い利益を上げたかを確認することができます。
-インプット
-トレンドウィック。この入力は、インディケータがスキャンしなければならないウィックの大きさを決定します。この値は%で測定されます。デフォルトでは20%です。
-シグナル数 シグナル数:成功率シミュレーターでスキャンするシグナルの数を指定しま
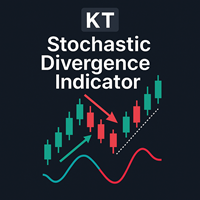
ダイバージェンス(乖離)は、市場における価格の反転を示す重要なシグナルのひとつです。KT Stoch Divergence は、価格とストキャスティクスオシレーターの間に発生するレギュラーおよびヒドゥンダイバージェンスを視覚的に表示します。
KT Stoch Divergence の注意点
ストキャスティクスのダイバージェンスだけをエントリーシグナルにするのはリスクがあります。すべてのダイバージェンスが反転を意味するわけではありません。プライスアクションやトレンドの方向と組み合わせて使用するのがおすすめです。
特徴
価格とストキャスティクス間のレギュラーおよびヒドゥンダイバージェンスをマーク。 トレンドの反転・継続両方に対応した戦略に使用可能。 エキスパートアドバイザー(EA)への組み込みに完全対応。 非対称なダイバージェンスは除外し、精度を向上。 エントリーだけでなく、エグジットにも利用可能。 すべてのMTアラート機能に対応。
そもそもダイバージェンスとは? 一般的に、価格が高値を更新するとき、オシレーターも高値を更新すべきです。同様に、安値を更新するときは、オシレーターも安

KT Heiken Ashi Alert は、標準的な平均足(Heiken Ashi)ローソク足に基づいて、買い・売りの矢印を表示し、アラートを生成するインジケーターです。Heiken Ashi をトレード戦略に取り入れたいトレーダーにとって、必須のツールです。 平均足が弱気から強気に変わったときに買い矢印が表示されます。 平均足が強気から弱気に変わったときに売り矢印が表示されます。 モバイル通知、メール通知、サウンド、ポップアップアラートを搭載。
Heiken Ashiとは? 日本語で「Heiken Ashi(平均足)」は「平均バー」を意味し、ローソク足チャートをより見やすくし、トレンドの把握をしやすくします。トレーダーは Heiken Ashi をエントリー・エグジットの両方に活用できます。色の変化は、相場の方向転換を示すことがよくあります。
覚えておきたいポイント
Heiken Ashi Alert を単体で使うのではなく、他のインジケーターと組み合わせて使用することで精度が向上します。 トレンド転換は、上下ヒゲのある小さなローソク足から始まることが多いです。 上ヒゲのない赤
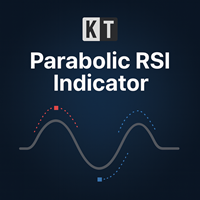
KT Parabolic RSI は、RSI ラインの上にパラボリックSARを直接重ねて表示し、市場の転換点をわかりやすく強調します。従来のRSIの買われすぎ・売られすぎ水準はすでに反転を示唆しますが、PSARフィルターを追加することで不要なノイズを取り除き、シグナルをより明確かつ信頼できるものにし、取引機会をより精度の高い形で提供します。 大きな四角シグナル: RSIが買われすぎまたは売られすぎゾーンにあるときにパラボリックSARが反転。このサインは高い確率で市場の転換を示します。 小さな四角シグナル: RSIが中立帯の範囲にあるときのSAR反転。これらは低確率のシグナルとして扱い、部分的な利確や既存トレンドの継続に活用できます。
特徴 RSIのモメンタムとパラボリックSARのトレンド反転を1つの画面に統合し、2つのインジケーターを別々に管理する必要がなくなります。 RSIウィンドウに表示される四角マーカーはメインチャート上にも反映されるため、価格の動きを見ながらシグナルを確認できます。 ローソク足分析とRSI-SARの定量シグナルを組み合わせ、エントリー前にチャートパターンを確認
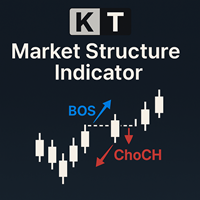
The KT Market Structure intelligently detects and displays Break of Structure (BOS) , Change of Character (CHoCH) , Equal Highs/Lows (EQL) , and various significant swing high/low points using our proprietary algorithm for accurate pattern detection. It also offers advanced pattern analysis by effectively demonstrating the captured profit for each pattern. A fully automated EA based on this indicator is available here: KT Market Structure EA MT5
Features
Accurate Pattern Detection: Our advance

Key Price Levels Indicator Indicator that shows the highs and lows for the significant price levels for past periods that could be potentially considered as reaction levels. The indicator displays the following price levels: Yesterday high and low The day before yesterday high and low Two days back high and low Last week high and low Last month high and low Last three month high and low (Quarter) Last year high and low
FREE
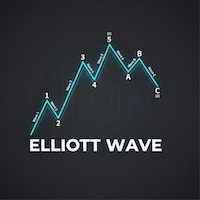
自動エリオット波動理論 (Automated Elliott Wave) 1. 自動波動カウントとバイアスの排除(客観性) 通常、エリオット波動のカウントには「主観」や個人の意見が入りがちです。このインジケーターは以下のように役立ちます: 推進波(インパルス 1-2-3-4-5)の検出: 厳格なルール(例:3波は最短であってはならない、4波は1波と重なってはならない)を使用し、理論的に正しい価格構造を表示します。 修正波(A-B-C)の検出: トレンド方向への再エントリー機会を見つけるために、価格の調整局面を捉えます。 2. マルチ・ディグリー分析 (Multi-Degree Analysis) 単一の時間枠だけでなく、3つの深度レベルを同時に分析し、市場を立体的(3D)に捉えます: マイナー (Minor): 短期的な素早い動き。 インターミディエイト (Intermediate): 主要なトレンド。 プライマリー (Primary): 市場の大きな全体像。 メリット: トレードスタイルに合わせて各レベルの表示/非表示を切り替え可能です。 3. ターゲット価格とエントリーポイント (
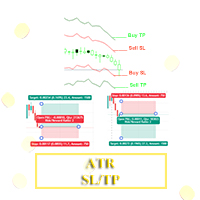
Hello, Traders! I have developed something for traders who uses Average True Range aka ATR value to determine their trade's Stoploss and Takeprofit. With this indicator you can easily set the Takeprofit and Stoploss with the multiplier of your choice.
To use this, kindly adjust the ATR Period to your trading style, then adjust the Stoploss Multiplier and Takeprofit Multiplier accordingly.
Happy Trading. Goodluck and Goodtrading!!!
FREE

Pivot Point Super trend it can be used to catch price turning points and can show arrows for buying and selling. calculations are based on price peaks . you can control the price turning points by increasing the Pivot point period input on the indicator the ATR factor is for how far apart do you want the bands to be spread apart price break outs are also spotted in their early stages which will make trading much better
FREE
説明
Candlestick Pattern Analyzer は、裁量トレーダーおよびシステムトレーダー向けに設計された高度なツールで、日本のローソク足パターンを自動的に検出し、それらの過去のパフォーマンスを詳細に統計分析します。 本インジケーターは、パターンの実効性を確認し、トレンド、重要な価格帯、出来高などの確認フィルターや、明確に定義されたリスク管理戦略と組み合わせて利用したいトレーダーに最適です。 主な機能 20種類以上のローソク足パターン(エンゴルフィング、ドジー、マルボーズ、ハンマー、スター、ハラミ など)の自動検出 各パターン発生後の指定バー数にわたる平均および累積利益の計算 検出されたパターンの総数を表示し、出現頻度を客観的に評価 チャート上にカラー枠とテキストで各パターンを可視化 新しいパターン検出時にリアルタイムでプッシュ通知およびアラートを送信 アクティブにするパターン、カラー設定、分析期間、データ表示位置などを自由にカスタマイズ可能 メリット
多くのトレーダーはローソク足を直感的・主観的に解釈しますが、Candlestick Pattern Analyze

This indicators automatically draws the support and resistances levels (key levels) for you once you've dropped it on a chart. It reduces the hustle of drawing and redrawing these levels every time you analyse prices on a chart. With it, all you have to do is drop it on a chart, adjust the settings to your liking and let the indicator do the rest.
But wait, it gets better; the indicator is absolutely free! For more information: https://youtu.be/rTxbPOBu3nY For more free stuff visit: https:
FREE

Haven Fibonacci Volume Profiles — あなたの自動マーケットレンジアナリスト Haven Fibonacci Volume Profiles をご紹介します。これは、市場分析を次のレベルに引き上げる強力なツールです。このインジケーターは、重要なピボットポイントに基づいて構築された主要な価格レンジを自動的に特定し、それぞれに詳細な出来高プロファイルとフィボナッチレベルを重ねて表示します。これにより、トレーダーは流動性がどこに集中しているか、そして真のサポートレベルとレジスタンスレベルがどこにあるかを即座に確認できます。 その他の製品 -> こちら . どのレンジが関連性があるかを推測するのはやめましょう。インジケーターがすべての複雑な作業を代行し、過去と現在の価格レンジの両方を表示することで、市場の状況を完全に理解することができます。 インジケーターの主な機能 自動レンジ検出: インジケーターは重要な高値と安値(ピボット)を自動的に見つけ、それらの間に価格レンジを構築します。 詳細な出来高プロファイル: 各レンジに対して出来高プロファイルが計算・表示され、取

The main purpose of the indicator is to determine and mark trade signals on the histogram of the Accelerator Oscillator, which were described by Bill Williams in his book "New Trading Dimensions". The list of signals: The buy signal when the indicator histogram is below the zero line. The sell signal when the indicator histogram is below the zero line. The sell signal when the indicator histogram is above the zero line. The buy signal when the indicator histogram is above the zero line. The buy
FREE
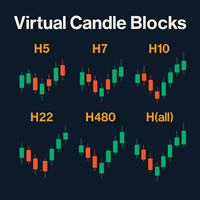
バーチャル・キャンドル・ブロック – 境界のない市場を視覚化 Virtual Candle Blocks は、MetaTrader 5向けの高度なインジケーターで、プラットフォームに本来存在しないカスタム時間足のローソク足を作成し、表示することができます。 主な特徴: カスタム時間足: 基本となるローソク足を、任意の期間(例:5時間、14時間、28時間、72時間など)のブロックにまとめ、新しいバーチャルローソク足を作成します。これにより、TradingViewなどのプレミアムプラットフォームでしか利用できない独自の時間足にアクセスできます。 クリアな表示: バーチャルローソク足を、実体とヒゲ付きでチャート上に直接描画します。色や実体の幅をカスタマイズでき、純粋なプライスアクション分析のためにヒゲを表示するかどうかも選択できます。 完全にカスタマイズ可能: このインジケーターには、選択されたバーチャル時間足を表示するミニマルなパネルが含まれています。MT5のすべての描画ツールと互換性があり、バーチャルローソク足の上にサポートライン、レジスタンスライン、トレンドラインをマークできます。 高
FREE
Multi-Currency Strength Dashboard PRO MT5 (v2.6) – 通貨強弱メーター(視覚ダッシュボード付き) Multi-Currency Strength Dashboard PRO は MetaTrader 5 用のインジケーターで、 8つの主要通貨 (USD, EUR, GBP, JPY, CHF, CAD, AUD, NZD)の相対的な強弱をリアルタイムに算出し、最大 28 通貨ペア (ブローカーで利用可能なシンボルに依存)を分析します。 本ツールの目的は、通貨の強さ/弱さを素早く整理して表示し、 分析対象のペア選定 (強い通貨 vs 弱い通貨)をサポートし、強弱差が小さい組み合わせをフィルタリングしやすくすることです。 主な機能 チャート上の視覚ダッシュボード (0–100 に正規化された強弱バー表示)。 最大 28 ペアの分析 (自動リスト作成、必要に応じてブローカー接尾辞にも対応)。 Best Pairs (注目ペア)を、設定可能な最小強弱差に基づいて表示。 Worst Pairs (強弱差が小さいペア)を表示し、フィルタリングを補助。
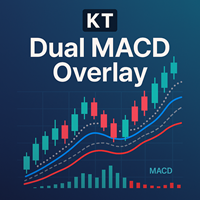
KT Dual MACD Overlay は、現在足と上位足の 2 本の完全な MACD オシレーターを価格チャート上に重ねて表示します。高速 MACD は短期モメンタムを捉え、低速 MACD は大局的なトレンドとの整合性を保ちます。 2 本をローソク足に重ねることで、ウインドウを切り替えることなく市場モメンタムを一望できます。
買いエントリー
メイン買い: 上昇トレンド開始時に青い縦線を表示。 追撃買い: 高速 MACD がシグナルラインを上抜け、低速 MACD と上昇トレンドが一致したときに発生。 売りエントリー メイン売り: 下降トレンド開始時にオレンジの縦線を表示。 追撃売り: 高速 MACD がシグナルラインを下抜け、低速 MACD と下降トレンドが一致したときに発生。
特徴 高速+低速の 2本 MACD で構成され、単体 MACD より文脈が明確。 新トレンド開始を示す縦線をチャートに描画。 メインサインを逃しても、複数回の再エントリー機会を提供。 標準 MACD クロスと比べて精度と視認性が大幅に向上。 3 つの主要イベントでアラート送信:トレンド変化・高速 MACD

Hull Moving Average is more sensitive to the current price activity than a traditional Moving Average. It faster responds to trend change and more shows the price movement more accurately. This is a color version of the indicator. This indicator has been developed based in the original version created by Sergey <wizardserg@mail.ru>. Suitable for all timeframes.
Parameters Period - smoothing period, recommended values are 9 to 64. The larger the period, the softer the light. Method - smoothing m
FREE
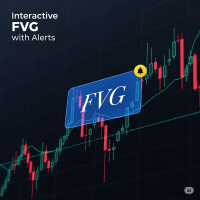
FVG Indicator with Alerts Description: This is a simple and effective indicator for identifying and displaying Fair Value Gaps (FVGs) on any timeframe. The indicator helps you see important price imbalances and provides powerful interactive tools for your analysis. Key Features: Detects FVGs: Clearly identifies and draws boxes around Bullish and Bearish Fair Value Gaps. Midline Level: Displays the 50% equilibrium level inside each FVG box, a critical point of interest. Complete Alert System: Rec
FREE

Cycle Sniper MT5 Cycle Sniper MT4 Version and definitions : https://www.mql5.com/en/market/product/51950 Important Notes: MT5 Version does not include Breakout Mode and Late Entry Mode Features.
MT5 Version does not include RSI and MFI filter. **Please contact us after your purchase and we will send you the complimentary indicators to complete the system.**
This indicator does not send any signal without a reason...You can observe and analyze the indicator and the signals it sends Cycle Sni

このインジケーターは、古典的な MACD インジケーターとジグザグ インジケーターを組み合わせて、価格とインジケーターの間の乖離を検出します。 また、高度な人工知能 (AI) テクノロジーを使用して、乖離の妥当性を検出します。
MACDは「インジケーターの王様」として知られていますが、ジグザグも非常に便利なインジケーターです。 この 2 つのインジケーターを組み合わせることで、このインジケーターは両方の長所を活用します。
発散の検出は確率論的な問題です。 多くの場合、乖離が発生した後に同じ方向へのさらなる価格変動が発生します。 そこで、高度なAI技術を活用して乖離の正当性を判断し、不正な乖離を排除し、さまざまな方法でユーザーに警告することを試みています。 割引価格:59$ 特徴 * MACD形式のジグザグインジケーター * 価格とMACDインジケーターの間の乖離を検出します ※AI技術を活用して乖離の妥当性を検知 * ユーザーに発散信号を警告します * 携帯電話を介してユーザーに発散信号を警告します * 電子メールで発散シグナルをユーザーに警告します * 複数の時間枠をサポート
This is a simple RSI indicator, but unlike the original one, it sends alerts when volume falls below the upper level or rises above the lower level, so you never miss a trading opportunity. Combined with support and resistance levels, it can provide strong entry opportunities into the market. I recommend keeping the levels as they are, i.e. 75 above and 25 below Check out my signal " PipStorm Invest ", save it to your favorites and come back from time to time to check it again :)
FREE

MT4 version Overview The Lowess Channel indicator is a smoothed trend-following tool designed to help traders identify the direction of the trend , detect flat or ranging markets , and spot breakouts from consolidation zones. It creates a central smoothed line with upper and lower channel boundaries, adapting to market noise while maintaining clarity. How It Works The indicator builds a channel around a smoothed price line. The central line reflects the current trend. The upper and lower bounda
FREE

1. Overview Thank you for choosing the SuperTrend Suite for MT5. This package provides a set of powerful tools for trend analysis, designed to integrate seamlessly into your MetaTrader 5 platform. This suite includes two components: SuperTrend Indicator : A robust trend-following indicator that displays the current market trend directly on your chart, complete with entry signals and alerts. SuperTrend Screener EA : A multi-symbol dashboard that scans a user-defined list of instruments in the bac
FREE
Highest High and Lowest Low (HH_LL) Indicator Description: The HH_LL Indicator is a trading tool designed to help traders identify key market points by automatically drawing Higher High (HH) and Lower Low (LL) lines across multiple timeframes. This indicator allows traders to easily spot significant levels on the chart, facilitating more accurate trading decisions. Key Features: Multi-Timeframe Analysis: The indicator supports various timeframes, including M30, H1, and H4. This enables traders t
FREE

EMA Multi Timeframe (MTF) – MT5 Indicator Description: The EMA Multi Timeframe (MTF) indicator for MT5 allows you to display an Exponential Moving Average (EMA) from a higher (or lower) timeframe directly on your current chart. Example: You can see the Daily (D1) EMA 9 plotted directly on your H1 chart, or even on an M5 chart, helping you align your entries with higher timeframe trends without switching between charts. Key Features: Display EMA from selectable timeframes (M1, M5, M15, M30, H1
FREE

2025 Spike Killer Dashboard - Advanced Trading Signals & Market Analytics Transform Your Trading with Intelligent Market Insights! The 2025 Spike Killer Dashboard is a powerful MQL5 indicator that combines cutting-edge signal generation with an intuitive crystal dashboard for real-time market analysis. Designed for traders who demand precision and clarity, this all-in-one tool delivers actionable signals and comprehensive market metrics at a glance. Key Features: Dual Signal System Shved S
MSX Hybrid Heiken Scalper v1.00 Elevate Your Scalping Precision with a Next-Generation Non-Repaint Heiken Ashi Indicator The MSX Hybrid Heiken Scalper is a scientifically designed, non-repainting Heiken Ashi indicator optimized for M5 to H1 scalping on MetaTrader 5. It introduces a robust closed-bar smoothing method that preserves trend clarity while filtering minor price noise — all without using traditional EMA/WMA/HMA smoothing that causes repainting. Reliable Closed Candle Logic
Each can
FREE

About the indicator: DALA Forecast is a universal tool for predicting the dynamics of time series of any nature. For prediction, modified methods of nonlinear dynamics analysis are used, on the basis of which a predictive model is built using machine learning methods. To get the trial version of the indicator, you can contact me in private messages.
How to use the indicator: Apply the indicator to your chosen financial instrument or indicator with the settings you need. The prediction will be
FREE
APICT Chart Patterns – Trend Line & Pattern Recognition for MT5 Enhance your technical analysis with the APICT Chart Patterns Indicator — an advanced tool for automatic pattern and trend line detection in MetaTrader 5. Key Features Automatic Pattern Detection: Identifies over 10 classic chart patterns, including pennants, wedges, channels, and double tops/bottoms. Real-Time Trend Lines: Draws support and resistance lines using smart algorithms. Custom Sensitivity: Adjust detection for major or
FREE

UT Bot Alerts is a technical indicator for MetaTrader 5 that highlights potential directional changes based on momentum conditions.
The indicator marks signal points directly on the chart and can generate optional notifications for convenience. The signal generation logic can operate in two modes: Closed-bar mode: signals are confirmed only after the bar closes. Live-bar mode: signals are displayed during the formation of the current bar. Both modes are available depending on the user's preferr

Enjoy the Free Candle Color indicator.
Kijun Sen is an element of Ichimoku Kinko Hyo Indicator, it's far too complicated for many traders hence they tend to be confused. We have simplified it so the Kijun Sen will change colors as it activates without the Tenkan Sen, Senkou Span, Up Kumo and Down Kumo. Customize to your period parameter and colors of your choice. Great for beginners and seasoned traders. Set your period and enjoy
GOOD LUCK and ALL THE BEST IN YOUR TRADING JOURNEY !!!!!
FREE

If you like this free tool, check out my EA which is currently on a Launch Sale for only $39 ! Title: [Overview] Universal Smart Monitor Pro: Automated Fibonacci & Price Action System Say goodbye to manual charting! Universal Smart Monitor Pro is a professional-grade technical analysis system that combines Fibonacci Retracements with Price Action logic. With a fully upgraded core, this algorithm is now universally compatible across all markets. It automatically adapts to the volatility characte
FREE

スキャルパーのための VWAP
セッション対応 VWAP ラインで高速で正確なスキャルピングが可能。 ️ 入力(MT4/MT5) Enable_Hourly_VWAP: 時間別 VWAP を有効にします。 Enable_Asia_VWAP: アジア セッション VWAP を有効にします。 Enable_Europe_VWAP: ヨーロッパ セッション VWAP を有効にします。 Enable_NA_VWAP: 北米セッション VWAP を有効にします。 Enable_Extended_VWAP: 拡張セッション VWAP を有効にします。 Enable_Daily_VWAP: 日次 VWAP を有効にします。 アジア セッション(GMT) Session_Asia_Start_Hour: アジア セッション開始時刻。 Session_Asia_End_Hour: アジア セッション終了時刻。 ヨーロッパ セッション(GMT) Session_Europe_Start_Hour: ヨーロッパ セッション開始時刻。 Session_Europe_End_Hour: ヨーロッパ セッショ
FREE
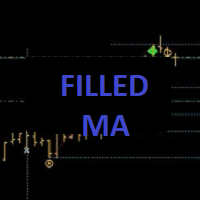
++++++++++++++++++++++++++++++++++ +++ Trend Tool ++++++++++++++++++++++++++++++++++ Hallo Trader, This is a trend tool that I use... based on four moving averages. Price below or above the EMA200 is indication for the long term trend. Also the direction of the slope counts. You can customise in settings if you want. The tool is aligned with my Forecast System and the Bounce Zones. - Forecast System --> https://www.mql5.com/en/market/product/156904 - Bounce Zones --> https://www.mql5.com/en/mar
FREE

This is a buyer and seller aggression indicator that analyzes the shape of each candle and project this data in a histogram form. There are 4 histograms in one. On the front we have two: Upper - Buyer force. Lower - Seller force. At the background we also have two histogram, both with same color. They measure the combined strenght of buyers and sellers. This histograms can be turned off in Input Parameters. It is also possible to have the real or tick volume to help on this force measurement. IN
FREE

This indicator is based on the Parabolic SAR indicator. It helps the user identifying whether to buy or sell. It comes with an alert that will sound whenever a new signal appears. It also features an email facility. Your email address and SMTP Server settings should be specified in the settings window of the "Mailbox" tab in your MetaTrader 5. Blue arrow up = Buy. Red arrow down = Sell. Line = Trailing Stop. You can use one of my Trailing Stop products that automatically move the Stop Loss and i
FREE
TW Volume Signal Pro MT5は、最先端のAI技術と独自のスマートアルゴリズムを活用し、金市場で自信を持って取引できるようにし、ユニークで比類のない取引体験を提供します。
金市場で高精度かつ優れた取引シグナルをお探しですか? TW Volume Signal Pro MT5を使えば、プロのトレーダーになり、金市場で大きな成功を収めることができます。今すぐ無料でお試しください!
TW Volume Signal Pro MT5の主な特徴: 固定されたTPとSLによる正確なシグナル 市場のトレンド変化を迅速に検出 エントリーとエグジットの即時アラート 3つの利益目標によるリスク管理 安全ゾーン内での自動ストップロス 完全にカスタマイズ可能な設定 チャートの横にシグナル履歴を表示 金およびFX市場での優れたパフォーマンス スキャルパー向け(M5およびM15) ストラテジーテスターでテスト可能
この製品を選ぶ理由:
高精度:正確で変化しないシグナル 使いやすさ:シンプルで直感的なインターフェース 柔軟性:個人の戦略と組み合わせ可能なカスタム設定 テスト可能性:過去の
The Absorption & Exhaustion Detector Professional indicator is a sophisticated volume analysis tool designed to identify critical market turning points by analyzing the relationship between price movement and cumulative volume delta (CVD). This indicator helps traders spot when price movements lack volume confirmation, indicating potential absorption or exhaustion zones. KEY FEATURES Real-time Cumulative Volume Delta (CVD) calculation and normalization Price-volume divergence gap measurement dis
MetaTraderマーケットは自動売買ロボットとテクニカル指標を販売するための最もいい場所です。
魅力的なデザインと説明を備えたMetaTraderプラットフォーム用アプリを開発するだけでいいのです。マーケットでプロダクトをパブリッシュして何百万ものMetaTraderユーザーに提供する方法をご覧ください。
取引の機会を逃しています。
- 無料取引アプリ
- 8千を超えるシグナルをコピー
- 金融ニュースで金融マーケットを探索
新規登録
ログイン