MetaTrader 5용 기술 지표 - 24
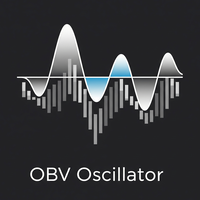
Overview The OBV Oscillator is a custom technical indicator for MetaTrader 5, designed to provide a clearer visualization of On Balance Volume (OBV) by transforming it into an oscillator. This indicator aims to assist traders in identifying trend confirmations, potential reversals, and momentum shifts by analyzing the relationship between price and volume. It features a customizable Moving Average (MA) for smoothing the OBV, a signal line for generating crossover signals, and an alert system to
FREE

Unlock the full potential of your Pro Thunder V9 indicator with our revolutionary new plugin - Auto Trend Lines! Are you looking for a competitive edge in today's dynamic market? Look no further. With Auto Trend Lines, you can harness the power of precise market trend analysis to make informed trading decisions. This innovative plugin seamlessly integrates with your Pro Thunder V9 indicator, providing you with real-time trend data and pinpointing exact entry and exit points for your trades. Key
FREE
스텝 채널 모멘텀 트렌드 지표 (MT5 Indicator) 스텝 채널 모멘텀 트렌드 는 시장 구조와 동적 변동성 분석을 결합하여 트레이더에게 적응형 이점을 제공하도록 설계된 강력한 모멘텀 기반 지표입니다. 이 도구는 고유한 단계 중간선과 ATR 필터 채널을 사용하여 지연에 의존하지 않으면서 트렌드와 범위를 명확하게 구분하는 데 도움을 줍니다. 주요 기능 구조적 단계 중간선 시스템의 핵심은 확인된 가격 피봇에만 기반한 “단계 Midline”입니다. 새로운 고점이나 저점이 확인될 때만 업데이트하여 불필요한 지연을 제거하고 시장 구조 변화에 즉시 반응합니다. 이 단계적 접근법은 명확한 레지므 전환을 생성하고 가격 현실에 머물게 하여 인디케이터 잡음을 피합니다. 중간선은 최근 강세와 약세 간의 균형을 나타내며 방향, 브레이크 아웃 또는 리트레이스에 대한 신뢰할 수 있는 기준점 역할을 합니다. 동적 변동성 밴드 ATR (Average True Range)을 사용하여 위와 아래 밴드를 작성하여
FREE

For those who love to follow Volume behavior here it is a little indicator that could be used as a replacement for the old and standard MT5 built-in volume indicator. The trick here is that this indicator paints the volume histogram based on the direction of the candle giving to the trader a quick "Heads Up" on what is happening, visually! It could be used to study and see for instance, the volume and past bars volume during (or, reaching) a peak (Tops and Bottoms). UP candles are shown in pale
FREE

This is a simple Orderblock alert indicator. it alerts you once it spots a bullish or bearish OB. what you choose to do with the alert, is left to you. Feel free to test on demo before use. (I'll be working on a combo i.e this and an EA working side by side, anticipate) Bullish OB has a light blue color and bearish has a light red color (rectangle box drawn on chart). Please trade wisely and don't forget to leave a positive review. thanks More blues to you, and Happy Trading!
FREE

The Stochastic Momentum Index (SMI), developed by William Blau and featured in the January 1993 edition of Technical Analysis of Stocks & Commodities magazine, introduces a unique perspective to trading analysis. Distinguished from the conventional Stochastic Oscillator, which evaluates the current close in relation to the recent x-period high/low range, the SMI assesses the close's position relative to the midpoint of this range. This innovation yields an oscillator with a range of +/- 100, re
FREE
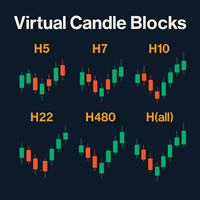
버추얼 캔들 블록(Virtual Candle Blocks) – 한계 없는 시장 시각화 버추얼 캔들 블록 은 MetaTrader 5용 고급 지표로, 플랫폼에 기본적으로 존재하지 않는 맞춤형 시간대의 캔들을 생성하고 시각화할 수 있게 해줍니다. 주요 특징: 맞춤형 시간대: 기본 캔들을 원하는 기간(예: 5시간, 14시간, 28시간, 72시간 등)의 블록으로 묶어 새로운 가상 캔들을 만듭니다. 이를 통해 TradingView와 같은 프리미엄 플랫폼에서만 제공하는 독점적인 시간대에 접근할 수 있습니다. 선명한 시각화: 차트 위에 몸통과 꼬리가 있는 가상 캔들을 직접 그립니다. 색상, 몸통 너비를 맞춤 설정하고, 순수한 가격 행동(price action) 분석을 위해 꼬리를 표시할지 선택할 수 있습니다. 완전 맞춤화 가능: 이 지표에는 선택된 가상 시간대를 보여주는 미니멀리즘 패널이 포함되어 있습니다. 모든 MT5 드로잉 도구와 호환되므로, 가상 캔들 위에 지지선, 저항선, 추세선을 표시할
FREE

This is advanced Multi-Symbol and Multi-Timeframe version of the "Candle Pattern Finder" indicator (search for candlestick patterns based on the book by Gregory L. Morris "Candlesticks charting explained. Timeless techniques for trading stocks and futures" ). The indicator searches for candlestick patterns for ALL symbols of the "Market Watch" window and for ALL standard timeframes from M1 to MN1. When patterns appear on any symbol / timeframe, the indicator gives a signal (text, sound, sending

Support Resistance Indicator The "Support Resistance" indicator is a versatile tool designed to help traders identify key support and resistance levels based on an underlying algorithm. These levels indicate price points where an asset historically experiences buying (support) or selling (resistance) pressure. The indicator allows traders to visualize these levels on their charts, making it easier to make informed decisions. All Products | Contact PARAMETERS: Timeframe :
Users can select the
FREE

"While our free indicators provide a solid foundation, our paid products offer advanced neural filtering and automated risk management features that help you scale your trading consistency. Upgrade your edge today by visiting our specialized catalog for professional-grade EAs and indicators." Accuracy M1 Scalper is a high-performance indicator developed specifically for traders operating on lower timeframes (M1 and M5). In the scalping environment, every second counts; therefore, this algorithm
FREE

Want to AUTOMATE this strategy? We have released the fully automated Expert Advisor based on this logic. Check out Range Vector Fibo Logic EA here: https://www.mql5.com/en/market/product/158065
UPGRADE AVAILABLE: Tired of manual trading? I just released the Automated MTF Version with Mobile Alerts and Auto-Targets. Get the Pro Version here: https://www.mql5.com/en/market/product/159350 Range Vector Fibo Logic (Indicator) One Candle Strategy Stop waking up at 3 AM to draw lines manually. Range
FREE

Impulse System은 "Come into my Trading Room" 책에서 처음 설명되었습니다. 그것은 MACD-히스토그램과 가격의 지수 이동 평균(EMA)의 방향을 사용하여 충동을 정의합니다. 규칙은 충동에 반대하여 거래하지 않는 것입니다.
색상 코드는 다음과 같은 여러 신호를 제공합니다. EMA와 MACD-히스토그램이 모두 상승할 때 Impulse 시스템은 막대 색상을 녹색으로 지정합니다(단락 허용 안 됨). EMA와 MACD-히스토그램이 모두 하락할 때 Impulse 시스템은 막대 색상을 빨간색으로 표시합니다(구매 불가). EMA 및 MACD-히스토그램이 다른 방향을 가리키고 있을 때 Impulse 시스템은 막대 색상을 청록색으로 지정합니다(길거나 짧게 갈 수 있음).
매개변수: MACD_Short_Length(12) – MACD 계산을 위한 짧은 EMA. MACD_Long_Length (26) – MACD 계산을 위한 긴 EMA MACD_Smoothing_Le

Daily pivot are relatively important in trading.
This indicator have options to select 5 commonly use pivot point calculations.
User input Choose Pivot Point Calculation (Method Classic, Method Camarilla, Method TomDeMark, Method Fibonacci or Method Woodies.) Choose Applied Timeframe for the calculation (M5, M15, H1, H4, D1, W1 etc) Can be attached to any timeframe Choose color of Pivot point Note:
For MT4, please refer here : https://www.mql5.com/en/market/product/22280
FREE

If you love this indicator, please leave a positive rating and comment, it will be a source of motivation to help me create more products <3 What is Schaff Trend Cycle indicator? The Schaff Trend Cycle (STC) is a technical analysis indicator used in trading and investing to identify trends and generate trading signals. The STC is designed to identify trends and trend reversals by measuring the strength of the trend and the speed of price changes. The STC indicator helps to identify trends in a
FREE

A heatmap is a graphical representation of data in two dimensions, using colors to display different factors. Heatmaps are a helpful visual aid for viewers, enabling the quick dissemination of statistical or data-driven information. The MP Heatmap indicator provides a graphical representation of the relative strengths of major currencies compared to others, organizing data from pairs into color-coded results and producing a clear overview of the entire Forex market. The MP Heatmap indicator dis
FREE

Strifor Pivot ATR Target
MetaTrader 5용 ATR 목표 및 분석 패널 피봇 지표 Strifor Pivot ATR Target 는 일중 및 단기 거래를 위한 도구로, 고전적인 피봇 수준과 동적 ATR 목표, 확장 분석 패널을 결합합니다. 이 지표는 거래 범위, 가격 반응 가능 구역, 움직임 잠재력을 사전에 평가하여 수동 계산과 주관적 판단을 제거합니다. 주요 기능 피봇 레벨 자동 생성 (PP, R1–R3, S1–S3) 평균 변동성 기준 ATR 목표 계산 상승/하락 별 목표 (ATR Long / ATR Short) 정보 패널 표시: 현재 ATR 값 일간 범위 진행률 남은 잠재력 고점/저점 기준 움직임 평가 전일 데이터 반영 가능 라인 및 패널 표시 유연성 모든 자산 유형 지원: 지수, 통화, 원자재, 암호화폐 MT5 완전 호환 (헤지 및 넷팅) 작동 원리
지표는 전일 데이터를 기반으로 피봇 레벨을 계산하고 ATR(14) 목표를 설정합니다.
ATR 목표는 통
FREE

Boom and Crash Buy and Sell Trend. Non-repaint. Can be used on all timeframes 1 minute for scalpers. 5 minute to monthly timeframe for swing trading. works on all boom and crash pairs Crash300, Crash500, Crash1000. Boom300, Boom500, Boom1000. Green histogram colour means the trend is up(bullish) Buy signal. Dark orange histogram colour means the trend is down(bearish) Sell signal.

Boom and Crash Gold miner v2 Trading indicator based on market momentum works on m1 for boom and crash 1000 and M5 time frame for normal trading pairs wait for blue arrow to appear plus change of candle stick color and candlesticks must be above the 2 modified moving averages then you can buy the market. wait for orange arrow to appear plus change of candle stick color and candlesticks must be below the 2 modified moving averages then you can sell the market.

이 지표는 볼린저 스타일의 변동성 채널에서 상단 밴드와 하단 밴드만 표시하며, 중앙 이동평균선은 표시하지 않습니다. 주요 목적은 깔끔하고 유연한 변동성 엔벨로프를 제공하여 트레이더가 채널 경계 대비 가격 움직임에 집중할 수 있도록 하면서, 차트의 시각적 구성과 미적 요소에 대한 완전한 제어를 유지하는 것입니다. 전통적인 볼린저 밴드와 달리, 이 지표는 이동평균선을 내부 계산에만 사용합니다. 중앙선은 시각적 혼잡을 줄이고 사용자가 필요에 따라 별도로 관리할 수 있도록 의도적으로 숨겨져 있습니다. 상단 및 하단 밴드는 각각 독립적인 색상 설정이 가능하여 시각적 구분이 명확해지고 다양한 차트 테마나 개인 취향에 더 잘 적응할 수 있습니다. 전통적인 볼린저 밴드 외형을 원하는 트레이더는 동일한 파라미터를 가진 이동평균 지표를 추가하여 쉽게 재현할 수 있습니다. 기간과 가격 소스를 일치시키면 표준 볼린저 구조를 효과적으로 복원할 수 있으며, 중앙선의 색상과 스타일도 완전히 제어할 수 있습니다
FREE

This indicator is converted from UT Bot alerts indicator by @QuantNomad of Trading View to MT5. its considering ATR and creating new candles on chart and also is giving good entry points based on its candles. all buffers of new candles and also entry signals are included as buffer so can be used easily on any EA. there are also some different strategies on the internet that can be used or contact me to create it for you.

This is a simple RSI indicator, but unlike the original one, it sends alerts when volume falls below the upper level or rises above the lower level, so you never miss a trading opportunity. Combined with support and resistance levels, it can provide strong entry opportunities into the market. I recommend keeping the levels as they are, i.e. 75 above and 25 below Check out my signal " PipStorm Invest ", save it to your favorites and come back from time to time to check it again :)
FREE
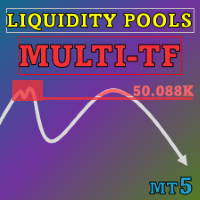
Special offer : ALL TOOLS , just $35 each! New tools will be $30 for the first week or the first 3 purchases ! Trading Tools Channel on MQL5 : Join my MQL5 channel to update the latest news from me Liquidity Pools 지표는 고급 도구로, 빈번하게 윅이 닿는 고점 및 저점을 분석하고 각 구역에서 거래된 재방문 횟수와 거래량을 분석하여 잠재적인 유동성 구역을 차트에 식별하고 표시합니다. 이 도구는 거래자에게 유동성이 쌓이는 시장 역학에 대한 종합적인 뷰를 제공하여 잠재적인 전환점을 예측하고 주요 지지 및 저항 수준을 식별하는 데 도움을 줍니다. MT4 버전 보기: Liquidity Pools MT4 다른 제품 보기: 모든 제품 주요 특징 및 혜택 1. 정확한 유동성 구역 식별 고영향 구역 강조
Simple indicator to show Breakeven line for all orders on attached chart pair. This indicator also comes with additional information such as Total Lot Size, Floating Drawdown in account's currency and Number of open positions and Difference from current price in Points. Do you use DCA (dollar cost average) or Hedging approach on your trading? Then this indicator you MUST have. Really useful, when you have multiple orders (hedging), this can help you quickly identify breakeven point without calc
FREE

Multicurrency and multitimeframe modification of the indicator Bollinger Bands. On the dashboard you can see breakouts and touches of the Bollinger Bands. In the parameters you can specify any desired currencies and timeframes. The indicator can also send notifications when the price touches the Bollinger Bands, when the current volatility changes (expands or falls), and when the price touches all the bands. By clicking on a cell with a period, this symbol and period will be opened. This is MTF
The Smart FVG Statistics Indicator is a powerful MetaTrader 5 tool designed to automatically identify, track, and analyze Fair Value Gaps (FVGs) on your charts. Love it? Hate it? Let me know in a review! Feature requests and ideas for new tools are highly appreciated. :)
Try "The AUDCAD Trader":
https://www.mql5.com/en/market/product/151841
Key Features Advanced Fair Value Gap Detection Automatic Identification : Automatically scans for both bullish and bearish FVGs across specified histo
FREE

Clock GMT Live에는 중개인에 대해 더 많이 알아야 할 모든 것이 있습니다. 여러 번 귀하는 내가 있는 GMT 또는 내 중개인이 작업 중인 GMT를 궁금해할 것입니다. 이 도구를 사용하면 실시간으로 GMT와 브로커와 현지 시간의 시차, 브로커의 핑도 지속적으로 알 수 있습니다. 하루 중 시간에 배치하기만 하면 정보를 얻을 수 있습니다.
인수할 때마다 가격이 상승합니다. 이를 통해 소수만이 나만의 전략을 가질 수 있도록 보호하겠습니다. 내 다른 개발은 여기에서 볼 수 있습니다
정확한 타이밍은 거래에서 중요한 요소가 될 수 있습니다. 현재 런던 또는 뉴욕 증권 거래소가 이미 열려 있습니까, 아니면 아직 닫혀 있습니까? Forex 거래의 영업 시간은 언제 시작하고 끝납니까? 수동으로 거래하고 라이브로 거래하는 거래자에게 이것은 큰 문제가 아닙니다. 다양한 인터넷 도구, 금융 상품의 사양 및 시간 자체를 사용하여 자신의 전략으로 거래할 적기가 언제인지 빠르게 알 수 있습니다.
FREE

ChannelRSI5 과매수 및 과매도 영역의 동적 수준이 있는 상대 강도 지수(RSI) 표시기.
동적 수준은 지표 및 가격의 현재 변화에 따라 변경 및 조정되며 일종의 채널을 나타냅니다.
표시기 설정 period_RSI - RSI 인덱스를 계산하기 위한 평균 주기. apply_RSI - 적용 가격. PRICE_CLOSE - 종가, PRICE_OPEN - 시가, PRICE_HIGH - 해당 기간의 최고 가격, PRICE_LOW - 해당 기간의 최소 가격, PRICE_MEDIAN - 중간 가격(고가 + 저가) 중 하나일 수 있습니다. / 2, PRICE_TYPICAL - 일반 가격(고가 + 저가 + 종가) / 3, PRICE_WEIGHTED - 가중 평균 가격, (고가 + 저가 + 종가 + 종가) / 4.
period_channel - 과매수 및 과매도 구역의 동적 채널에 대한 계산 기간.
FREE

Smart Money Structure & Precision Trading Indicator (MT5) Smart Money Structure & Precision Trading Indicator is a powerful Smart Money Concepts (SMC) indicator for MetaTrader 5, designed to help traders identify high-probability entries with institutional logic . This indicator automatically detects market structure in real time , highlights key liquidity levels , and provides clear, non-repainting signals so you can trade with confidence and precision. Whether you are a scalper, day trader, o
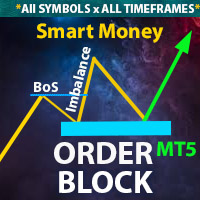
** All Symbols x All Time frames scan just by pressing scanner button ** Discount : Only 4 of 5 copy is 35$.
*** Contact me to send you instruction and add you in "Order Block group" for sharing or seeing experiences with other users. Introduction: The central banks and financial institutions mainly drive the market, Order block is considered a market behavior that indicates accumulation of orders from banks and institutions, then the market tends to make a sharp move(Imbala

1. Overview The Ichimoku Kinko Hyo (or Ichimoku Cloud) is a comprehensive, all-in-one technical analysis indicator designed to provide a deep understanding of market trends, momentum, and dynamic support and resistance levels. This indicator provides a clean, standard implementation of the five core Ichimoku lines. Its key feature is a non-intrusive Status Dashboard that gives you an at-a-glance summary of the current market situation according to the Ichimoku system, allowing for quick and effi
FREE

Im Sorry Ai Signal v1.26 – Precision Gold Scalping for MT5 Elevate your trading with Im Sorry Ai Signal , the latest technical indicator from the WinWiFi Robot Series . Specifically engineered for Gold (XAUUSD) scalpers on the MetaTrader 5 platform, this tool simplifies complex market movements into clear, actionable visual signals. Designed with a focus on Price Action within the M5 (5-Minute) timeframe , this indicator helps traders identify high-probability entry points in the fast-paced gol
FREE

Introduction
The RSI Plus is an innovative technical analysis tool designed to measure the strength and direction of the market trend. Unlike the traditional RSI indicator, the RSI Plus boasts a distinctive ability to adapt and respond to market volatility, while still minimizing the effects of minor, short-term market fluctuations.
Signal
Buy when the RSI plus has been in the oversold (red) zone some time and it crosses above the 20 level on previous candle close
Sell when the RSI plus ha
FREE

Jackson trendline scanner it a powerful price action tool which draw accurate trendlines and alert a breakout signals . As we all know that trendlines it a most powerful tool in price action by providing us with different chart patterns. e.g. Bullish flag, Pennant, Wedges and more...It not easy to draw trend lines, Most successful traders use trendlines to predict the next move based on chart pattern and breakout. Drawing a wrong trendline it a common problem to everyone, wrong
FREE
Pivot Points Indicator – a fast, reliable, and fully customizable pivot detection for MetaTrader 5. This indicator uses MetaTrader’s native iHighest and iLowest functions to identify pivot highs and lows by scanning for the highest and lowest prices within a user-defined window of bars. A pivot is confirmed only when the current bar is the absolute maximum or minimum within the selected range, ensuring accurate and timely signals based on robust built-in logic.
Key Features No Repainting : Onc
FREE

"NakaTrend를 소개합니다: MetaTrader 5용 궁극적인 트렌드 감지기!
거래 경험을 혁신하시기 준비 되셨나요? NakaTrend를 만나보세요. 정확하고 쉽게 트렌드 변화를 식별하는 데에 최적의 인디케이터입니다.
NakaTrend를 사용하면 시장 변동을 놓치지 않습니다. 상승 트렌드가 발생하면 NakaTrend가 초록색 달러 표시로 신호를 보내 구매 주문을 넣으라고 안내합니다. 그리고 하락 트렌드로 변할 때는 빨간색 달러 표시가 나타나 매도 주문을 넣을 때 최적의 시점임을 알려줍니다.
하지만 이것만이 아닙니다 - NakaTrend는 수동 주문 입력을 허용하여 귀하가 거래를 제어할 수 있도록 돕습니다. 당신의 직감과 NakaTrend의 통찰력이 수익성 있는 결과로 이끌어줍니다.
추측하거나 시대에 뒤떨어진 인디케이터에 의존하는 시대는 지났습니다. NakaTrend는 신뢰할 수 있는 명확하고 실행 가능한 신호를 제공하기 위해 고급 알고리즘을 활용합니다.
그리고 Nak
FREE
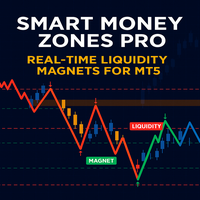
SM Zones Pro 지표의 기능을 더 자세히 알아보고 싶으시다면, 다양한 시간대의 단일 EURUSD 상품에 맞춰 조정된 무료 SM Zones 지표를 먼저 다운로드하여 사용해 보시는 것을 권장합니다. 이 시장에서 SM Zones를 다운로드할 수 있습니다. SM Zones Pro는 SM Zones와 달리 최대 10개의 상품을 동시에 분석할 수 있습니다.
스마트 머니 관리 전략의 원칙에 따라 개발된 SM Zones Pro 지표는 MetaTrader 5(MT5) 플랫폼 트레이더에게 매우 편리한 도구입니다. SM 전략에 사용되는 모든 주요 존(시장 구조, 유동성 증가 가격 수준, "가격 자석" 존 - 불균형, 주문 블록, 선가 변동(fvg), 브레이커 블록, 완화 블록)을 차트에 그래픽으로 표시합니다. 강세장에 영향을 미치는 존은 녹색, 약세장에 영향을 미치는 존은 갈색으로 표시됩니다. 이러한 레벨은 대형 기관 및 은행의 주문에 의해 영향을 받는 가격 변동 가능성이 있는 영역을 반영합

AP VWAP Bands Pro (MT5) Volume-weighted average price with ±σ bands for clear intraday bias, mean-reversion zones, and dynamic support/resistance. Works on crypto (incl. BTC) , FX , indices , and metals . Uses tick-volume when real volume isn’t available. What it shows VWAP line (volume-weighted mean price). Two envelopes around VWAP (default ±1σ and ±2σ) to highlight balance vs. extension. Reset modes : Day , Week , or Anchor Time (HH:MM) to start VWAP where you need it (e.g., exchange open).
FREE

Fibomathe Indicator: Support and Resistance Tool for MT5 The Fibomathe Indicator is a technical analysis tool designed for MetaTrader 5 (MT5) that assists traders in identifying support and resistance levels, take-profit zones, and additional price projection areas. It is suitable for traders who use structured approaches to analyze price action and manage trades. Key Features Support and Resistance Levels:
Allows users to define and adjust support and resistance levels directly on the chart.
FREE
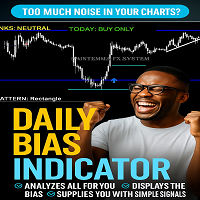
INTRODUCING the Powerful Daily Bias Indicator
The Daily Bias Indicator
Stop Guessing. Start Trading with Confidence.
Tired of staring at your charts and not knowing if today is a buy day or a sell day? The Daily Bias Indicator does the heavy lifting for you.
It scans the market using 7 powerful tools (EMA trend, RSI, MACD, ADX, Volume, Pivot Points & Price Action). It tells you in plain language:
“TODAY: BUY ONLY”
“TODAY: SELL ONLY”
Or “NO CLEAR BIAS” (so you don’t waste money
FREE

Volume Weighted Average Price (VWAP) is a trading benchmark commonly used by Big Players that gives the average price a Symbol has traded throughout the day. It is based on both Volume and price. Additionally we put in this indicator the MVWAP (Moving Volume Weighted Average Price). For those who do not know the usage and the importance od this indicator I recommend a great article about this subject at Investopedia ( https://www.investopedia.com/articles/trading/11/trading-with-vwap-mvwap.asp
FREE

Breakout Monitor is a powerful trading tool designed to track price action within your custom-drawn zones. Simply draw a rectangle on your chart to define your consolidation or key levels, and the indicator will do the rest. It highlights the price range clearly and monitors it in real-time, ensuring you never miss a significant market move. When the price breaks through your defined boundaries, the indicator sends an instant Push Notification directly to your mobile phone in a clear, actionable
FREE
Free Until 1st Jan 2026
VWAR 2.2 (Volume Weighted Average Roadmap) is an advanced institutional-grade MT5 indicator that brings you the most powerful multi-timeframe VWAP (Volume Weighted Average Price) analysis—plus filtered trade signals using robust trend and momentum confirmations. Key Features: Multi-Timeframe VWAP Lines:
Plots Daily, Weekly, and Monthly VWAP levels for instant market structure insight. Dynamic Buy/Sell Signals: Big, bold colored arrows indicate confirmed buy or sell opp
FREE
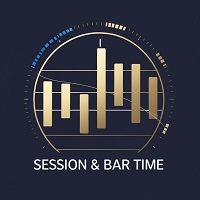
The Sessions and Bar Time indicator is a professional utility tool designed to enhance your trading awareness and timing precision on any chart. It combines two key features every trader needs — market session visualization and real-time bar countdown — in one clean, efficient display. Key Features: Candle Countdown Timer – Shows the remaining time before the current candle closes, helping you anticipate new bar formations. Market Session Display – Automatically highlights the four main trading
FREE

Multicurrency and multi-timeframe indicator Inside Bar (IB). In the parameters, you can specify any desired currencies and timeframes. The panel displays the last found Inside Bar (and Mother Bar) pattern, the current price position and the breakout of the levels of the Mother and Inside Bars. You can set the size and color for bars and text in the cells. The indicator can also send notifications when levels are broken. The dashboard highlights Double Inside Bar in a special color. By clicking

Idea extracted from the books by Anna Coulling and Gavin Holmes using Volume and Spread Analysis (VSA) techniques coupled with Al Brooks' expertise with Price Action these candles are magical, identify the exact moment
of the performance of the big players are acting in the market represented by the colors:
1) Red Candles we have an Ultra High activity,
2) Candles Orange we have a Very High Activity
3) Candles Yellow we have one High Activity
4) White Candles represent normal activity in
FREE

Simple Vwap with the daily, weekly and monthly
VWAP is the abbreviation for volume-weighted average price , which is a technical analysis tool that shows the ratio of an asset's price to its total trade volume. It provides traders and investors with a measure of the average price at which a stock is traded over a given period of time.
How it's used Identify entry and exit points: Traders can use VWAP to determine when to buy or sell an asset. Understand price trends : Traders can use V
FREE

All traders should know the trend before making their decision when placing the buy or sell orders. The first step always starts with supply and demand , rising and falling channels , trend lines, engulfing candles etc. All the above contribute to what is called “Price Action” and that is the best and most reliable way in trading and catching the trend and making profits, without stress. The Investment Castle Trend Line Indicator will automatically draw the trend lines on the MT5 for you.
FREE

The Stochastic RSI (StochRSI) is a technical indicator that combines the characteristics of the Relative Strength Index (RSI) with the Stochastic Oscillator, resulting in a more sensitive tool that generates a higher number of trading signals. Developed by Tushar Chande and Stanley Kroll, the indicator was designed to overcome a perceived limitation of the traditional RSI: the low frequency of overbought and oversold levels activation (commonly 80 and 20), especially in less volatile assets. Ho
FREE
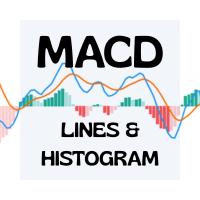
Advanced MACD Indicator with 6 Colors & Adjustable Line Thickness Elevate your trading charts with this fully customizable MACD indicator for MetaTrader 4/5. With six independent color slots and per-line thickness controls, you can tailor every element to your exact preferences. Key Features Six Separate Color Slots
Customize each component with its own color: MACD Line Signal Line Histogram Bars (Bullish) Histogram Bars (Bearish) Zero Line Adjustable Line Thickness
Choose any thickness—from e
FREE

AllTF Trend Bias Indicator is a professional tool to visualize market bias, designed mainly for 1-minute charts. The colors are not trading signals by themselves, but a visual compass to guide your decision-making: HiddenEdge release model
All HiddenEdge tools follow the same structured release plan.
Each indicator is released initially for free to collect feedback.
After reaching a stable user base, it moves to a fixed paid tier.
Some utilities remain permanently free as part of the Hidde
FREE

Zenith Session Flux is a professional-grade technical indicator for MetaTrader 5 designed to identify and visualize institutional trading windows known as ICT Killzones. The indicator automates the process of time-alignment by synchronizing your broker's server time with New York local time, ensuring that session boxes and price pivots appear at the precise institutional moments regardless of your broker's timezone. Indicator Features: Automatic Timezone Sync: Automatically calculates the offset
FREE

This MQL5 indicator draws four Exponential Moving Averages (EMAs) — 21, 50, 100, and 200 — directly on the chart window.
The EMA 21 is displayed as a color-changing line , while EMA 50, 100, and 200 are standard single-color lines.
The color of EMA 21 changes dynamically based on price position.
When the closing price is above EMA 21 , the line turns blue , indicating bullish pressure.
When the closing price is below EMA 21 , the line turns yellow , indicating bearish pressure.
If the price equa
FREE

EMA Multi Timeframe (MTF) – MT5 Indicator Description: The EMA Multi Timeframe (MTF) indicator for MT5 allows you to display an Exponential Moving Average (EMA) from a higher (or lower) timeframe directly on your current chart. Example: You can see the Daily (D1) EMA 9 plotted directly on your H1 chart, or even on an M5 chart, helping you align your entries with higher timeframe trends without switching between charts. Key Features: Display EMA from selectable timeframes (M1, M5, M15, M30, H1
FREE

En esta versión, las alertas están funcionando y en la versión que publicó, la zona muerta de atr era solo una zona muerta sin atr, por lo que también la convirtió en una zona muerta de atr.
Indicator input parameters input int Fast_MA = 20; // Period of the fast MACD moving average input int Slow_MA = 40; // Period of the slow MACD moving average input int BBPeriod=20; // Bollinger period input double BBDeviation=2.0; // Number of Bollinger deviations input int Sensetive=
FREE

"HiperCube USD INDEX (DXY /USDX) "는 주식, 채권 또는 상품과 같은 특정 자산 그룹의 성과를 나타내는 재무 벤치마크로, 가치는 미국 달러로 표시됩니다. 이러한 지수는 투자자가 특정 부문 또는 시장의 성과를 시간 경과에 따라 추적하고 비교하는 데 도움이 됩니다. USD로 표시되므로 지수는 자산의 기본 통화 또는 지리적 위치에 관계없이 투자를 평가하는 데 일관된 척도를 제공합니다. 다윈엑스 제로 20% 할인 코드: DWZ2328770MGM_20
성과 정보를 더 명확하게 유지하기 위한 별도 창에 대한 지표 색상이 변경되는 사용자 지정 캔들 설치가 쉽고 필요한 경우에만 활성 이름 변경 Chat gpt와 AI를 사용하여 개발되었습니다.
HiperCube USD 지수 이해: 성과 지표: 지수는 특정 시장 또는 부문의 성과를 보여줍니다. 지수 USD가 상승하면 기본 자산의 가치가 일반적으로 증가하고 있음을 나타냅니다. 반대로 지수가 하락하면 가치가 감소함을 나타냅
FREE

Very simple, yet powerful, indicator that helps you get notified every time a candle touches your trend line, horizontal line, and/or your rectangular. Powerful indicator yet very simple to use! All you need to do is draw your MT5 trend lines, horizontal lines, and/or rectangles and SmartLine takes care of notifying you the moment the current price touches one of your key levels! No brainer If you like the indicator, please leave a review and share the tool with your peers. WARNING: Please use t
FREE
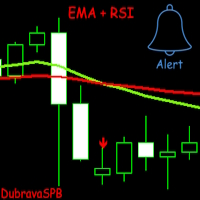
Introducing EMA + RSI – A Trading Indicator Combining Exponential Moving Average (EMA) and Relative Strength Index (RSI) Analysis. The indicator signals trade entries with arrows on the chart when two EMAs cross and the RSI meets the specified conditions.
It is initially optimized for the GBPUSD currency pair on the 1H timeframe, but users can customize it to fit their strategy. Key Features: Flexible settings: Users can adjust EMA length, choose the price for calculation, and configure RSI para
FREE

This trading strategy is built around Open-Close Crossovers , a method of analyzing price movement based on the relationship between a bar's open and close prices. The system is designed to identify potential entry and exit points when these values cross over each other. Setup and Customization The strategy's performance can be customized by adjusting the resolution. A higher resolution, typically 3-4 times that of the chart , may be used to identify crossover signals earlier. However, this can
FREE
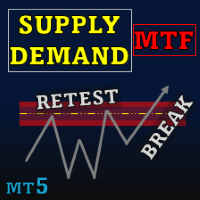
Special offer : ALL TOOLS , just $35 each! New tools will be $30 for the first week or the first 3 purchases ! Trading Tools Channel on MQL5 : Join my MQL5 channel to update the latest news from me Supply Demand Retest and Break Multi Timeframe , 이 도구는 강한 모멘텀 캔들에 기반하여 공급 및 수요 영역을 그리며, timeframe selector 기능을 사용하여 여러 시간대에서 이러한 영역을 식별할 수 있게 합니다. 재테스트 및 브레이크 라벨과 맞춤형 검증 및 스타일링 옵션을 통해 이 도구는 효과적인 거래 분석을 지원합니다. MT4 버전 자세히 보기: Supply Demand Retest and Break MT4 Multi Timeframe 더 많은 제품

Dynamic Candle Countdown
This indicator provides a real-time countdown to the next candle. Unlike standard timers, it positions the label near the current price for better visibility during fast-moving markets. Real-time updates: Uses a 1-second timer event. Dynamic Positioning: Follows the price action automatically. Fully Customizable: Adjust colors, font size, and offsets to suit your chart template. Performance Optimized: Minimal CPU usage.
FREE

One of the best tools for analyzing volume,
Weis Wave was idelized by David Weis, to facilitate the reading of directional flow. For the VSA method disciples it is an evolution of the practices created by Richard Wycoff, facilitating a predictive reading of the market, always seeking an accumulation and distribution of the negotiated contracts.
Cumulative wave volume Range of wave ( removed) Average Wave volume Ref "Tim Ord lectures" ( removed)
FREE

MTF Candlestick Patterns Detector : Your Ultimate Price Action Command Centre In the fast-paced world of trading, missing a single reversal pattern can be the difference between a profitable week and a missed opportunity. The MTF Candlestick Patterns Detector is a professional-grade MQL5 indicator designed to scan, detect, and aggregate over 24 legendary candlestick patterns across all timeframes simultaneously. Stop hunting and guessing through charts. Let the algorithm bring the high-probabi

MTF WAD Simplified Indicator - Professional Trading Solution Overview The MTF WAD Simplified is a sophisticated multi-timeframe volume-based indicator designed to track smart money flow across financial markets. By monitoring the Williams Accumulation/Distribution (WAD) across 8 different timeframes, this tool provides traders with unprecedented insight into institutional accumulation and distribution patterns. Core Benefits for Traders 1. Smart Money Tracking - Detect Institutional

This simple indicator helps defining the most probable trend direction, its duration and intensity, as well as estimate the possible range of price fluctuations. You can see at a glance, at which direction the price is moving, how long the trend lasts and how powerful it is. All this makes the indicator an easy-to-use trend trading system both for novice and experienced traders.
Parameters Period - averaging period for the indicator calculation. Deviation - indicator deviation. Lag - calculatio

## ONLY GOLD
## Тiльки Золото
## **Mercaria Professional Trading Zones - Complete Guide** ## **Mercaria Professional Trading Zones - Повний посібник**
### **How Mercaria Zones Work / Як працюють зони Mercaria**
**English:** Mercaria Zones is an advanced trading indicator that identifies high-probability support and resistance areas using ZigZag extremes combined with mathematical zone calculations. The indicator works on multiple timeframes simultaneously, providing a comprehensive view

Indicator Name: CM EMA Trend Bars Overview: The CM EMA Trend Bars indicator is a straightforward yet effective tool that changes the color of price bars based on their relationship to the Exponential Moving Average (EMA). This visual cue helps traders quickly identify trend direction and potential trading opportunities. Key Features: Dynamic Bar Coloring: The indicator changes the color of the bars depending on whether they are above or below the EMA, providing a clear visual representation of t
FREE

Volume Horizon is a horizontal volume indicator that allows you to observe the density of market participants' volumes across various price and time intervals. Volume histograms can be constructed based on ascending or descending market waves, as well as individual bars. This tool enables more precise determination of entry or exit points, relying on levels of maximum volumes or volume-weighted average prices (VWAP).
What makes Volume Horizon unique? 1. Segmentation into ascending and descendi

1. Introduction Smart Volume S/R Pro is a powerful technical analysis tool designed for the MetaTrader 5 platform. Unlike traditional Support & Resistance (S/R) indicators that rely on price peaks and troughs, this indicator automatically identifies critical S/R zones based on a core factor: Trading Volume . Core Principle: Price levels that witnessed exceptionally high trading volume in the past will often become significant psychological zones, where the price is likely to react strongly (eith
FREE

Gann 9+ Indicator Introduction The "Gann Matrix Chart" is the most simple and clear technical analysis in Gann theory, which is the calculation tool that Gann has always been committed to using. It is the essence of Gann's whole life. The Gann 9+ indicator uses the matrix chart to find the future high or low points of stocks or futures. Indicator Input: The base and step size can be set as 1 by default; When the multiple is -1, the multiple will be automatically obtained, or it can be filled in

TransitTrendlines this is a automatically trendline drawer, it draw both horizontal and diagonal trendlines. The horizontal trendlines are the pivot points of the day timeframe and the diagonal trendlines are based on the current time frames. You can adjust the diagonal trendlines by increasing the number of bars to draw the diagonal trendline and can also adjust the steepness. Note that the Horizontal trendlines are based on the day pivot points not currant time frame. Join mql5 transitbk98 cha
FREE
MetaTrader 마켓은 개발자들이 거래 애플리케이션을 판매할 수 있는 간단하고 편리한 사이트이다.
제품을 게시하고 마켓용 제품 설명을 어떻게 준비하는가를 설명하는 데 도움이 됩니다. 마켓의 모든 애플리케이션은 암호화로 보호되며 구매자의 컴퓨터에서만 실행할 수 있습니다. 불법 복제는 불가능합니다.
트레이딩 기회를 놓치고 있어요:
- 무료 트레이딩 앱
- 복사용 8,000 이상의 시그널
- 금융 시장 개척을 위한 경제 뉴스
등록
로그인
계정이 없으시면, 가입하십시오
MQL5.com 웹사이트에 로그인을 하기 위해 쿠키를 허용하십시오.
브라우저에서 필요한 설정을 활성화하시지 않으면, 로그인할 수 없습니다.