Regardez les tutoriels vidéo de Market sur YouTube
Comment acheter un robot de trading ou un indicateur
Exécutez votre EA sur
hébergement virtuel
hébergement virtuel
Test un indicateur/robot de trading avant d'acheter
Vous voulez gagner de l'argent sur Market ?
Comment présenter un produit pour qu'il se vende bien
Indicateurs techniques pour MetaTrader 5 - 24
super trend version is to help you to have real time view of market move it will help you to get a live view of current market buy signal line and arrow to help you understand batter the direction sell signal line and arrow to help you understand batter the direction trade what you see not what you think this is an simple and best trading tool for our traders of any market crypto gold
FREE

Ritz Smart FIBOPIVOT Optimus Pro Advanced Multi-Timeframe Fibonacci Trading System SMART PREDICTION & ACCURATE FORECAST Revolutionary Fibonacci Pivot Technology combines traditional pivot points with advanced Fibonacci extensions, creating a powerful predictive tool for professional traders.
Our algorithm intelligently detects significant price levels across multiple timeframes, delivering laser-accurate support and resistance zones before the market moves . INTELLIGENT VOLUME-VALIDATED SIGNALS
FREE

PREDATOR PULSE AI TRADER - ATHENA Quantum Neural Trading System Professional-Grade Institutional Trading Indicator** Overview
This advanced neural network trading system is designed to provide both institutional and retail traders with equal market insight. ATHENA combines deep institutional-level pattern recognition with proven traditional trading strategies, offering a comprehensive two-dimensional market view: standard technical analysis and advanced microanalysis powered by deep learning

Market Heartbeat is in your hand! *** Contact me to send you " Trend Finder indicator " free and add you in "Market Heartbeats group" for sharing or seeing experiences with other users. Introduction The Market Heartbeat indicator with a special enhanced algorithm (volume, money flow, cycle of market and a secret value) is a very repetitive trend finder with a high success rate . Interestingly, this Winner indicator indicates that the trend has changed its direction or the end of a tre

This indicator has been developed to identify and display these trends quickly and easily, allowing you to see instantly, those currency pairs which are trending, and those which are not – and in all timeframes, with just one click. The 28 currency pairs are displayed as a fan as they sweep from strong to weak and back again, and this is why we call it the ‘currency array’. All 28 pairs are arrayed before you, giving an instant visual description of those pairs that are trending strongly, those

The indicator displays volume clusters or volume profiles to choose from. For trading symbols which contain the tape of deals, the indicator can perform calculations based on the tape of deals.
Input variables
StepPoint - cluster step in points, if the value is zero, the step is assigned automatically. HistoryTicks - size of tick history (for VolumeType in the mode TimeAndSales). AssociatedTimeframe - binding the indicator to the specified timeframe of the chart, if the value is equal to Cu

[ Mon Canal ] , [ Mes Produits ]
Vue d’ensemble
Le classificateur à distance lorentzienne est un indicateur de trading basé sur l’apprentissage automatique qui utilise la distance de Lorentz comme métrique principale dans le cadre des plus proches voisins approximatifs (ANN). Au lieu de s’appuyer sur la distance euclidienne traditionnelle, il considère l’action des prix financiers comme se produisant dans un espace prix-temps « déformé » (de manière similaire à la façon dont des objets massifs

GEN Ichimoku Signal Developer: gedeegi Overview GEN Ichimoku Signal is a technical indicator for the MetaTrader 5 platform. It combines two different trend analysis systems, Ichimoku Kinko Hyo and HalfTrend, into a single visual tool. The primary function of the indicator is to color the chart's candlesticks based on whether the conditions of these two systems are in alignment. The indicator provides a visual representation of market conditions by displaying one of three colors: one for aligned
FREE
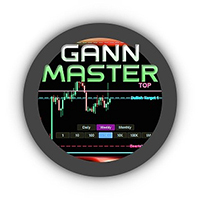
Les niveaux légendaires de William Gann dans un indicateur MT5 entièrement automatisé. GANN Master identifie les zones clés où le prix est le plus susceptible de se retourner ou de poursuivre sa tendance, en se basant sur des données Daily, Weekly et Monthly. Fonctionnalités clés : Boutons de période en un clic : cliquez sur Daily, Weekly ou Monthly pour tracer instantanément les zones du jour, de la semaine ou du mois Modes automatique et manuel
• Automatique : GANN Master calcule tous les nive
Important: The price will increase to 150$ after 8 more purchases Every buyer of this indicator also receives for free: The exclusive Signal Reacter EA, which automatically executes every Signal a step-by-step guide to help you install the Signal Capturer Note: To claim your free EA, just send me a quick message on MQL5.
I present to you the original, self-developed tool that grabs premium signals from top services like the Divergence Bomber, Algo Pumping and Grabber System.
Instructional vid

Prior Cote est un indicateur simple, moderne et essentiel pour les traders qui utilisent l’analyse technique basée sur les niveaux de prix de la journée précédente. Il trace automatiquement les niveaux suivants de la session précédente sur votre graphique : • Ouverture
• Haut
• Bas
• Clôture
• Prix Typique Parfait pour :
• Stratégies de retournement et de cassure
• Analyse des supports et résistances
• Configurations de trading intraday et swing ️ Entièrement personnalisable :
• Activez ou
FREE

You can configure to show multiple take profit targets based on the current price all based on volatility; I personally use it every day with an script to automate my entries; For example if i want to stop out for 4 volatility level and use an take profit of 10 volatility based on the 2 minutes of the previous 20 bars i can do it with this indicator; You can configure multiple take and multiple stops with different names to show in your symbol, all take profit and stop losses in this indicator i
FREE

Enjoy the Free Candle Color indicator.
Kijun Sen is an element of Ichimoku Kinko Hyo Indicator, it's far too complicated for many traders hence they tend to be confused. We have simplified it so the Kijun Sen will change colors as it activates without the Tenkan Sen, Senkou Span, Up Kumo and Down Kumo. Customize to your period parameter and colors of your choice. Great for beginners and seasoned traders. Set your period and enjoy
GOOD LUCK and ALL THE BEST IN YOUR TRADING JOURNEY !!!!!
FREE

The Candle Countdown Timer for MetaTrader 4 (also available for MT5) is a vital indicator designed to help you manage your trading time effectively. It keeps you updated about market open and close times by displaying the remaining time before the current candle closes and a new one forms. This powerful tool enables you to make well-informed trading decisions. Key Features: Asia Range: Comes with an option to extend the range. Broker Time, New York, London Time: Displays the current broker time
FREE

The indicator represents the session boxes for the Asian, European and American sessions. It is possible to change the time of each session, such as color. It is also possible to disable the display of each session. You will find in input parameters variables to modify in format hh:mm. In Colors tab you can change the color of boxes of each sessions. If you need some implementations please contact me.
FREE

Mostra a média móvel quando ADX > 20 e pinta de verde ou vermelho quando os valores de ADX estão subindo indicando tendência. Quando o ADX é menor que 20 indica movimento lateral consolidado. O indicador não define pontos de entrada, somente mostra a média colorida quando a tendência está se fortalecendo. Faz parte do grupo de indicadores do Indicador Tavim.
FREE
Market Structure Shift with FVG Indicator for MT5 This MT5 indicator from the apexfintech.net suite identifies market structure shifts and fair value gaps (FVGs) to provide traders with potential trading opportunities. It alerts users on these events via mobile notifications, enabling them to react quickly to changing market conditions. Key Features: Market Structure Shift Detection: Identifies bullish and bearish market structure shifts based on swing high/low breaks and significant candl
FREE

Zones de support et de résistance basées sur le volume Volume-based Support and Resistance Zones est un indicateur puissant et flexible pour MetaTrader 5, conçu pour aider les traders à identifier les niveaux de marché clés formés par des pics de volume aux sommets et creux fractals. Cet outil trace automatiquement des zones de support et de résistance là où le prix est le plus susceptible de réagir, vous permettant de trader avec plus de confiance et de clarté.
Principales fonctionnalités Logi
FREE

L'indicateur SMC Venom Model BPR est un outil professionnel pour les traders travaillant dans le concept Smart Money (SMC). Il identifie automatiquement deux modèles clés sur le graphique des prix: FVG (Fair Value Gap) est une combinaison de trois bougies, dans laquelle il y a un écart entre la première et la troisième bougie. Forme une zone entre les niveaux où il n'y a pas de support de volume, ce qui conduit souvent à une correction des prix. BPR (Balanced Price Range) est une combinaiso
Indicateur “Step Channel Momentum Trend” (MT5 Indicator) Step Channel Momentum Trend est un puissant indicateur basé sur le momentum, conçu pour donner aux traders un avantage adaptatif en combinant la structure du marché avec une analyse dynamique de la volatilité. Cet outil aide à distinguer clairement entre tendance et plage sans se fier à des techniques de lissage sujettes à des délais, en utilisant une ligne médiane à pas unique et un canal filtré par ATR. Caractéristiques Clés Ligne Cent
FREE

MaRSI Scalper & Trader The combination of moving averages and RSI This setting is flexible so it can be set with regards to user test uses 1. For scalping 2. For long time trading
features 1. Sends push notifications 2. Sends alerts on computers 3. Draws Arrows 4. Draws respective indicators (this feature will be edited in the future)
Have feedback https://t.me/Tz_Trade_Logics or just call +255766988200 (telegram/whatsApp) Head to discussion page to leave your comments Improvement are on the
FREE

FVG Detector Multi-TF ( БЕЗ ФЛИКЕРА ) Автоматический индикатор для обнаружения и отображения ключевых ценовых уровней на основе концепций Smart Money Concept (SMC) . Индикатор идентифицирует Ценовые Разрывы Справедливой Стоимости (FVG) и Свинг High/Low одновременно на текущем графике и с нескольких старших таймфреймов. Особенности и преимущества 1. Усовершенствованный Анти-Фликер В отличие от стандартных индикаторов, вызывающих мерцание при тиковых обновлениях, здесь реализована оптимизированна
FREE

1. Introduction Smart Volume S/R Pro is a powerful technical analysis tool designed for the MetaTrader 5 platform. Unlike traditional Support & Resistance (S/R) indicators that rely on price peaks and troughs, this indicator automatically identifies critical S/R zones based on a core factor: Trading Volume . Core Principle: Price levels that witnessed exceptionally high trading volume in the past will often become significant psychological zones, where the price is likely to react strongly (eith
FREE
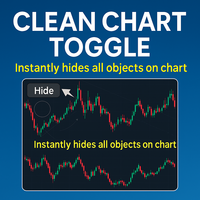
Le Clean Chart Toggle est un indicateur convivial conçu pour améliorer votre expérience de trading sur MetaTrader 5 (MT5) en offrant une manière simple de gérer la visibilité des indicateurs et des objets sur votre graphique. Grâce à un seul bouton situé dans le coin supérieur gauche de la fenêtre du graphique, les utilisateurs peuvent instantanément masquer ou afficher tous les indicateurs et objets de dessin, réduisant l'encombrement et améliorant la concentration sur l'action des prix ou les
FREE
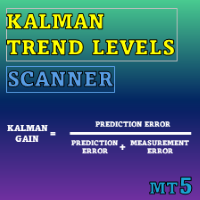
Special offer : ALL TOOLS , just $35 each! New tools will be $30 for the first week or the first 3 purchases ! Trading Tools Channel on MQL5 : Join my MQL5 channel to update the latest news from me Kalman Trend Levels est un indicateur avancé de suivi de tendance qui exploite la technologie de pointe des filtres de Kalman pour fournir aux traders des signaux analytiques puissants. Conçu pour être précis et adaptable, cet outil identifie non seulement des zones critiques de support

Avez-vous déjà pensé à avoir un scanner qui analyse toutes les stratégies et montre les points d'achat et de vente sur tous les délais de cet actif, le tout en même temps ? C'est exactement ce que fait ce scanner. Il a été conçu pour afficher les signaux d'achat et de vente que vous avez créés dans le Rule Plotter : créateur de stratégies sans programmation et les exécuter dans ce scanner sur différents actifs et délais. La stratégie par défaut du Rule Plotter se compose uniquement des bougies h
FREE

A price increase indicator calculates range and price changes in percent. It is very useful when you look at the chart.
It helps you make decisions to open deals when the price is at the lowest level do not open sell deals and open buy deals and when it is at the highest level do not open buy deals open sell deals, it is not an entry signal for deals but to know the lowest and highest price that will reach in an hour or four hours a day or a week or a month as a whole for the period
FREE
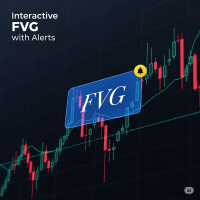
FVG Indicator with Alerts Description: This is a simple and effective indicator for identifying and displaying Fair Value Gaps (FVGs) on any timeframe. The indicator helps you see important price imbalances and provides powerful interactive tools for your analysis. Key Features: Detects FVGs: Clearly identifies and draws boxes around Bullish and Bearish Fair Value Gaps. Midline Level: Displays the 50% equilibrium level inside each FVG box, a critical point of interest. Complete Alert System: Rec
FREE
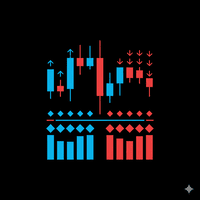
TrendPower All-In-One Strict v1.00 Description TrendPower All-In-One Strict is a comprehensive trend-following trading system designed for MetaTrader 5. It acts as a "confluence detector," meaning it filters market noise by requiring multiple technical indicators to agree before generating a signal. The indicator utilizes a "Strict" logic engine, meaning a signal is only generated when momentum, trend direction, and volatility filters all align perfectly. It displays data in a separate sub-win

This indicator extracts a trend from a price series and forecasts its further development. Algorithm is based on modern technique of Singular Spectral Analysis ( SSA ). SSA is used for extracting the main components (trend, seasonal and wave fluctuations), smoothing and eliminating noise. It does not require the series to be stationary, as well as the information on presence of periodic components and their periods. It can be applied both for trend and for another indicators.
Features of the me
FREE

VWAP pour Scalpers
Lignes VWAP conscientes de la session pour des scalps rapides et précis. ️ Entrées (MT4/MT5) Enable_Hourly_VWAP: Activer VWAP par heure. Enable_Asia_VWAP: Activer VWAP de session Asie. Enable_Europe_VWAP: Activer VWAP de session Europe. Enable_NA_VWAP: Activer VWAP de session Amérique du Nord. Enable_Extended_VWAP: Activer VWAP de session étendue. Enable_Daily_VWAP: Activer VWAP quotidien. Session Asie (GMT) Session_Asia_Start_Hour: Heure de début de la session Asie. Session
FREE

The Volume+ and VSA Signals indicator for MT5 is based on the Volume Spread Analysis (VSA) methodology to provide the signals. The signals are displayed at closing of bars on the main window or subwindow in the form of symbols. The symbols are not repainting. The indicator produces a signal on an individual bar and this signal is not buy or sell signal. When a minor trend goes in the opposite direction of a major trend, there are sequences of major trend-following signals that give a higher pro

In the "Masters of Risk" trading system, one of the main concepts is related to places where markets change direction. In fact, this is a change in priority and a violation of the trend structure at the extremes of the market, where supposedly there are or would be stop-losses of "smart" participants who are outside the boundaries of the accumulation of volume. For this reason, we call them "Reversal Patterns" - places with a lot of weight for the start of a new and strong trend.
Some of the imp
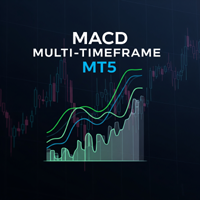
The Multi-Frame MACD Indicator is a robust MetaTrader 5 (MT5) indicator that utilizes the Moving Average Convergence Divergence (MACD) to analyze trends across multiple timeframes. This indicator synchronizes MACD-based trend signals from up to nine timeframes (M1, M5, M15, M30, H1, H4, D1, W1, MN1) and presents them with clear visual cues, including a colored MACD line, signal arrows, and a customizable dashboard. Perfect for traders seeking momentum and trend reversal insights. Features Multi-
FREE

TransitTrendlines this is a automatically trendline drawer, it draw both horizontal and diagonal trendlines. The horizontal trendlines are the pivot points of the day timeframe and the diagonal trendlines are based on the current time frames. You can adjust the diagonal trendlines by increasing the number of bars to draw the diagonal trendline and can also adjust the steepness. Note that the Horizontal trendlines are based on the day pivot points not currant time frame. Join mql5 transitbk98 cha
FREE

Multicurrency and multitimeframe modification of the Commodity Channel Index (CCI) indicator. You can specify any desired currencies and timeframes in the parameters. Also, the panel can send notifications when crossing overbought and oversold levels. By clicking on a cell with a period, this symbol and period will be opened. This is MTF Scanner. The key to hide the dashboard from the chart is "D" by default.
Parameters CCI Period — averaging period.
CCI Applied price — price type.
Clear th
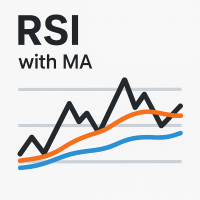
The RSI with Moving Averages indicator combines the classic Relative Strength Index with customizable moving averages, offering deeper insights into market momentum and trend direction. By smoothing the RSI curve with short- and long-term averages, traders can better distinguish true reversals from noise. This tool highlights overbought and oversold levels, reveals divergences between price and momentum, and confirms entry or exit points with enhanced accuracy. Its adjustable parameters allow tr
FREE

L'« Indice USD HiperCube (DXY /USDX) » est un indice de référence financier représentant la performance d'un groupe spécifique d'actifs, comme les actions, les obligations ou les matières premières, avec des valeurs libellées en dollars américains. Ces indices aident les investisseurs à suivre et à comparer la performance de secteurs ou de marchés particuliers au fil du temps. En étant exprimé en USD, l'indice fournit une mesure cohérente pour évaluer les investissements, quelle que soit la dev
FREE
As the suggested, with this indicator you are able to switch from one symbol or timeframe to another in the same single chart. So forget about opening tons of chart on your screen! It's not designed for ICT or SMC trader, but if you are that kind of trader you still can use it. Imagine you have a strategy containing various indicators and settings, on a single chart you can screen the entry opportunity then move to the next symbol or timeframe.
FREE
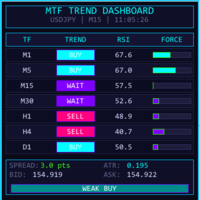
MTF TREND DASHBOARD - Analyseur de Tendance Multi-Timeframe Un puissant tableau de bord visuel qui affiche la direction de la tendance sur 7 unités de temps simultanément (M1, M5, M15, M30, H1, H4, D1). === CARACTÉRISTIQUES PRINCIPALES === Détection de tendance en temps réel via croisement d’EMA Valeurs RSI avec code couleur surachat/survente Barres dynamiques de force du trend Signal de biais global du marché (Strong Buy/Sell, Bias, Weak, Neutral) Affichage en direct du spread, ATR, Bid/Ask Thè

The most crucial price level in any "Volume Profile" is the "Point of Control" . Is the price level with the highest traded volume. And mainly, is the level where the big guys start there their positions, so it's an accumulation/distribution level for smart money.
The idea of the indicator arose after the "MR Volume Profile Rectangles" indicator was made. When creating the "MR Volume Profile Rectangles" indicator, we spent a lot of time comparing the volumes with those from the volume profile

Megatron Shark Indicator – MT5 Harmonic Pattern Detection Tool The Megatron Shark Indicator is a MetaTrader 5 tool for detecting and displaying Shark harmonic patterns directly on the chart. It automatically identifies bullish and bearish Shark formations, calculates entry, stop-loss, and take-profit levels, and provides real-time alerts. This allows traders to quickly integrate harmonic pattern analysis into their trading process without manual drawing. Advantages * Automatic Pattern Detection
FREE

Cet indicateur est basé sur la stratégie proposée par la chaîne YouTube 'The Secret Mindset', sur la vidéo "A Reliable Scalping Strategy I Discovered After 1 Month of Price Action Trading" Une explication complète et détaillée de la stratégie et des conditions pour filtrer les signaux est exposée sur la vidéo. * Le créateur de la chaîne YouTube n'est pas lié au développement de cet indicateur Les signaux doivent être combinés avec d'autres indicateurs et être filtrés par le jugement de chaque t
FREE

L'indicateur qui affiche l'heure actuelle sur les principaux marchés du monde. Il affiche également la session en cours. Très facile à utiliser. Il n'occupe pas beaucoup d'espace sur un graphique. Il peut être utilisé avec des Expert Advisors et d'autres panneaux, tels que VirtualTradePad . La version de style classique. Chers amis et utilisateurs de nos EA, veuillez ajouter vos notes dans la section Avis. Toutes les mises à jour de notre logiciel forex sont gratuites ! Ceci est un u
FREE

The ADX Histogram is a modern and visual upgrade of the classic Average Directional Index (ADX) .
It transforms the standard ADX and DI+ / DI– values into a color-coded histogram , making trend analysis much clearer and faster. Key Features: Histogram with four states : Blue = Normal Buy Trend Green = Strong Buy Trend Orange = Normal Sell Trend Red = Strong Sell Trend Automatic strength detection : uses the ADX line to separate “normal” vs. “strong” signals. Fully customizable: ADX
FREE

Product Name: SavasaLaS Tutelage | Pro Price Action Compass Stop guessing. Start trading with Confluence. SavasaLaS Tutelage is not just an indicator; it is a complete trading system designed for the serious Price Action trader. It eliminates chart noise by strictly enforcing the three pillars of institutional trading: Market Structure , Trend Direction , and Candlestick Verification . Unlike standard indicators that flood your chart with weak signals, SavasaLaS Tutelage waits for the "Perfect O
FREE

MT4 Version Most indicators draw lines.
This one draws the battlefield. If you ever bought an EA or indicator based on a perfect equity curve — and then watched it bleed out live — you’re not alone.
The problem? Static logic in a dynamic market. Fibonacci Bollinger Bands adapts.
It combines Bollinger structure with customizable Fibonacci levels to mark zones of control — where price reacts, pauses, or reverses. No magic. Just logic that follows volatility. Why this tool matters It
FREE

ADR, AWR & AMR Indicator: Comprehensive Trading Guide Try "Average Daily Range Scalper":
https://www.mql5.com/en/market/product/154469 Core Concepts ADR (Average Daily Range) Definition : The average distance between daily high and low prices over a specified lookback period (typically 14-20 days) Purpose : Measures daily volatility expectations, identifies range-bound versus trending days, sets realistic intraday profit targets Key Insight : Markets tend to respect their average volatility - d
FREE

It is the very same classic Stochastic indicator, but with a little twist: we changed the Signal Line with a 2-color line, so we can use it with EAs as a filtering system. And that's it! I know it could seem stupid but I needed that, so I created it. The original formula is right from Metaquote's chest, no additions, no subtractions, it is Stochastics in its core.
So I will not publish here the Stochastics parameters as they are all the same as always... Enjoy!
If you like this indicator, all I
FREE

Excellent outil utilitaire où vous pouvez surveiller en temps réel la moyenne de votre compte et la propagation du symbole Celui-ci saura identifier précisément les données, pour pouvoir savoir par exemple si vous avez un compte Prop Firm, connaître la bonne Laverage et si le spread est manipulé, etc. pour faire un lotage précis
Combinaison d'un effet de levier et d'un indicateur de spread. Des outils pour automatiser la vérification de l'effet de levier et du spread sur votre compte de tradin
FREE

TCM Breakeven Calculator Ultra is a professional utility designed to instantly visualize your True Weighted Average Entry Price with the Total Lot Size . Unlike simple averages, this tool mathematically accounts for Lot Sizes , giving you the exact price where your net position reaches zero loss. It automatically scans your terminal and isolates trades based on the chart you are viewing. If you are trading multiple pairs (e.g., EURUSD and Gold) simultaneously, this indicator will onl
FREE

Smart Trend pro New - Advanced Trend Indicator with Interactive GUI Professional trend-following indicator with comprehensive visualization and control panel Key Features: Advanced Trend Detection Reliable Half Trend algorithm for precise trend identification Color-coded trend lines (Blue for bullish, Orange for bearish) Customizable amplitude parameter for different trading styles Interactive GUI Panel Real-time market strength visualization (Bulls vs Bears) Current signal display (Buy/Se
FREE
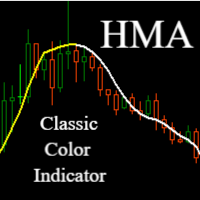
Hull Moving Average (HMA) - Faster and More Precise Trend Tracking
Hull Moving Average represents a revolutionary approach to trend analysis that overcomes the common shortcomings of traditional moving averages. This advanced indicator, developed by Alan Hull, practically eliminates the lag typical for standard moving averages while maintaining exceptional signal smoothness.
Key Benefits:
Significantly faster response to trend changes than traditional moving averages Minimal lag while mainta
FREE
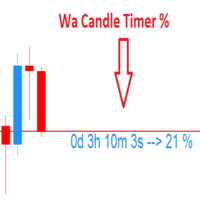
Wa Candle Timer Percentage MT5 est un indicateur qui montre à l'utilisateur combien de temps il reste avant l'ouverture de la prochaine bougie. Le pourcentage d'évolution de la bougie actuelle est aussi montré sur l'écran. L'utilisateur peut configurer le pourcentage auquel le candle timer changera de couleur. Voici les paramètres: 1 - Le pourcentage auquel le candle timer changera de couleur. 2 - couleur de la minuterie de la bougie, quand le pourcentage d'évolution de la bougie actuelle est E
FREE

Moving Average Convergence/Divergence — схождение/расхождение скользящих средних — технический индикатор, разработанный Джеральдом Аппелем (Gerald Appel), используемый в техническом анализе для проверки силы и направления тренда, а также определения разворотных точек. Встроенный в MetaTrader 5 индикатор MACD не соответствует задумке автора (Gerald Appel):
-линия MACD графически изображена в виде гистограммы, однако гистограммой отражается разница между линией MACD и сигнальной линией;
-сигнальн
FREE

The TRIXs Indicator is the combination of the TRIX (Triple Exponential Moving Average) indicator with the addition of a SMA (Simple Moving Average) signal. It provides signs of trend continuity and the start of a new trend.
The entry and exit points of operations occur when the indicator curves cross.
It performs better when combined with other indicators.
FREE
The Channel Sgnals ProfRoboTrading Indicator for MT5 is an effective Forex trading tool designed to track market movements. The MT5 signal point indicator effectively detects trend reversals after they have already occurred. This Indicator is a fully automated technical tool that includes a number of parameters to track market trends. It automatically examines the ever-changing price dynamics of the market, compares the information with earlier data and generates a trading signal. Because
FREE

Market Sessionsync** is a cutting-edge trading session indicator designed to enhance your trading experience by visually breaking down the market's daily rhythm. With a compact window overlaid on your chart, this indicator provides a split-second understanding of the current trading session through: Basic setup: Set Difference between your local time and your broker time , set DST(Daylight Saving Time) ON or OFF , set timescale sync you want to use (Local, Broker, CET) - A vertical time marker
FREE
APICT Chart Patterns – Trend Line & Pattern Recognition for MT5 Enhance your technical analysis with the APICT Chart Patterns Indicator — an advanced tool for automatic pattern and trend line detection in MetaTrader 5. Key Features Automatic Pattern Detection: Identifies over 10 classic chart patterns, including pennants, wedges, channels, and double tops/bottoms. Real-Time Trend Lines: Draws support and resistance lines using smart algorithms. Custom Sensitivity: Adjust detection for major or
FREE

PGSindicator for MetaTrader 5 Free Companion Indicator for Profit Guard System Trade Panel. *** The attached video is the " PGS Trade Panel Tutorial Part 1 " *** (4m video) Adjust >>> **** EMA1 N-Pips Separation from EMA2
This setting defines the minimum distance required between EMA1 and EMA2 before a trend condition is considered valid.
The default value is 100.0 pips for NASDAQ 100, 1 minute CHART . Depending on how your broker calculates pip values, you may adjust this to 20.0 or 10.0
FREE

The Horse DCA Signal 1.26 – สุดยอดนวัตกรรมอินดิเคเตอร์สำหรับการเทรดทองคำและทุกสินทรัพย์ The Horse DCA Signal คืออินดิเคเตอร์รุ่นล่าสุดจากตระกูล WinWiFi Robot Series ที่ได้รับการออกแบบมาเพื่อยกระดับการเทรดบนแพลตฟอร์ม MT5 โดยเฉพาะ โดยเป็นการผสมผสานอัจฉริยะระหว่างกลยุทธ์ Follow Trend และ Scalping เข้าด้วยกันอย่างลงตัว คุณสมบัติเด่น: ระบบลูกศรแยกประเภทชัดเจน: ลูกศรสีทอง: บ่งบอกสภาวะตลาดช่วง Sideway เหมาะสำหรับการเทรดแบบ Swing Trade หรือ Scalping เก็บกำไรระยะสั้น (2) ลูกศรสีน้ำเงินและสีแดง: บ่งบอกส
FREE

RITZ SMART TREND ADAPTIVE FINDER Precision Trend Intelligence. Adaptive. Insightful. Real-Time. Ritz Smart Trend Adaptive Finder is an advanced market intelligence indicator engineered to detect and adapt to evolving market structures with dynamic precision.
It automatically calibrates its analytical period based on real-time volatility, price momentum, and correlation strength — delivering true adaptive trend detection rather than static or lagging signals. By combining Pearson correlation , sl
FREE

A simple price action indicator to highlight inside and outside bars (candles) with colors. It is possible to choose what type of bar can be highlighted among: inside, ouside or both. It is can be possible to choose a first specific color for the shadow and the border of bars (candles), a second specific color for high/bull bar (candle) and a third specific color for down/bear bar (candle)
FREE

The indicator shows the current timeframe and symbol name. It is also possible to turn on the indication of time until the end of the current bar. In the settings, you can specify: - the location of the indicator in relation to the terminal window, top left, top right, bottom left and bottom right - a row of text display arrangements so that the inscriptions do not overlap each other - color - font - font size.
FREE
If you love this indicator, please leave a positive rating and comment, it will be a source of motivation to help me create more products <3 Key Takeaways The Laguerre RSI is an enhanced version of the traditional Relative Strength Index (RSI) that incorporates Laguerre filters to smooth the price data. This helps reduce the noise and volatility that are often seen in the standard RSI, providing a cleaner and more reliable indicator for spotting trends, reversals, and overbought or oversold con
FREE
Correlation Monitor est un indicateur qui permet de détecter rapidement les relations entre instruments : il aide à trouver des paires présentant une forte corrélation positive/négative, à repérer des divergences et à prendre des décisions plus étayées pour la couverture, le pair trading et le trading en panier. Meta traider 4. Fonctionnalités clés • Matrice de corrélation et liste compacte : affiche instantanément l’intensité des liens entre les symboles sélectionnés ; le codage couleur facilit
FREE

This indicator draws regular bullish and bearish divergences in real-time onto the charts. The algorithm to detect those divergences is based on my 10+ years experience of detecting divergences visually. The divergences are drawn as green and red rectangles on the charts. You can even do forward testing in the visual mode of the strategy tester. This FREE Version is restricted to EURUSD and GBPUSD. The full version without restrictions is here: https://www.mql5.com/en/market/product/42758
Para
FREE
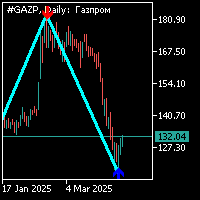
L'indicateur zig-zag est standard avec une période de 34 avec un signal supplémentaire sous la forme d'une flèche. Signal supplémentaire calculé séparément de l'indicateur zig-zag.Le travail sur cet indicateur se produit comme suit: 1. lors de la formation d'un segment de l'indicateur zig-Zag et l'apparition d'un signal supplémentaire sous la forme d'une flèche, vous devez ouvrir la position dans le sens de la flèche; 2. lors de la formation d'un autre bras de l'indicateur zig-zag dans la direct

Trend Entry Indicator Your Trading will Be easier with this indicator!!! This Indicator is Developed To make our trading life easier. Get an Arrow for Entry with Take Profit and Slop Loss marks on chart. - Indicator is Based on trend, because thats what we all want we want to follow the trend "it's our friend". - Based on Levels, price action and oscillators. - It works on all currency pairs, all indices, metals and stock. - it works on all pairs/indexes on Deriv including Boom and Crash. - Tim

L'Indicateur de Pression Acheteurs-Vendeurs affiche le sentiment du marché sur plusieurs timeframes de M1 à D1. Il calcule les pourcentages de pression d'achat et de vente en utilisant une analyse de momentum de moyennes mobiles sur une période configurable. Le panneau visuel montre des barres de progression avec la force acheteuse en sarcelle et la dominance vendeuse en rouge, accompagnées de valeurs en pourcentage lorsque significatives. Chaque timeframe inclut une mesure de force de tendance
Le MetaTrader Market offre un lieu pratique et sécurisé pour acheter des applications pour la plateforme MetaTrader. Téléchargez des versions démo gratuites de Expert Advisors et des indicateurs directement depuis votre terminal pour les tester dans le testeur de stratégie.
Testez les applications dans différents modes pour surveiller les performances et effectuez un paiement pour le produit que vous souhaitez en utilisant le système de paiement MQL5.community.
Vous manquez des opportunités de trading :
- Applications de trading gratuites
- Plus de 8 000 signaux à copier
- Actualités économiques pour explorer les marchés financiers
Inscription
Se connecter
Si vous n'avez pas de compte, veuillez vous inscrire
Autorisez l'utilisation de cookies pour vous connecter au site Web MQL5.com.
Veuillez activer les paramètres nécessaires dans votre navigateur, sinon vous ne pourrez pas vous connecter.