MetaTrader 5용 기술 지표 - 23

스캘퍼를 위한 VWAP
세션 인식 VWAP 라인으로 빠르고 정확한 스캘핑을 수행합니다. ️ 입력 (MT4/MT5) Enable_Hourly_VWAP: 시간별 VWAP 활성화. Enable_Asia_VWAP: 아시아 세션 VWAP 활성화. Enable_Europe_VWAP: 유럽 세션 VWAP 활성화. Enable_NA_VWAP: 북미 세션 VWAP 활성화. Enable_Extended_VWAP: 연장 세션 VWAP 활성화. Enable_Daily_VWAP: 일일 VWAP 활성화. 아시아 세션(GMT) Session_Asia_Start_Hour: 아시아 세션 시작 시간. Session_Asia_End_Hour: 아시아 세션 종료 시간. 유럽 세션(GMT) Session_Europe_Start_Hour: 유럽 세션 시작 시간. Session_Europe_End_Hour: 유럽 세션 종료 시간. 북미 세션(GMT) Session_NA_Start_Hour: 북미 세션 시작 시간. Ses
FREE
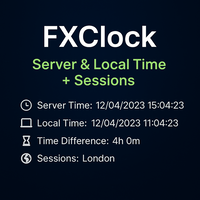
FXClock – Professional Clock Indicator for Traders Important Reminder:
If you find this tool helpful, please support the work by leaving a comment or rating.
Your feedback motivates further development!
The FXClock indicator is a practical and simple tool that displays time directly on your trading platform, allowing you to track multiple key pieces of information at the same time. It is specially designed to help traders synchronize their trading with market hours and global sessions. Key F
FREE

Tired of false signals? Trade with reliable buy & sell arrows! Download now and see how it works !
Trend Reverting PRO: High-Performance Signals Suitable for trend-following or trend trading Never repaints, recalculates, or backpaints signals
This is FREE / DEMO / version and works on EURUSD M15, M30“ (demo version; no suffix/prefix brokers). Test it FREE now - see real results!
TREND REVERTING PRO full version here( Updated version ) : Get accurate arrows on every se
FREE

세계 주요 시장의 현재 시간을 표시하는 표시기. 또한 현재 세션을 표시합니다. 사용하기 매우 쉽습니다. 차트에서 많은 공간을 차지하지 않습니다. VirtualTradePad 와 같은 Expert Advisor 및 기타 패널과 함께 사용할 수 있습니다. 클래식 스타일 버전. 친애하는 친구 및 EA 사용자 여러분, 리뷰 섹션에 귀하의 평가를 추가하십시오. Forex 소프트웨어의 모든 업데이트는 무료입니다 ! 이것은 무료 거래 유틸리티입니다! 다른 특징들: 입력 매개변수에 옵션이 있습니다. 버튼 위에 마우스를 놓으면 팁 표시/숨기기, 영어/러시아어 팁 언어를 선택할 수도 있습니다. 닫기 버튼은 응용 프로그램을 중지합니다. 최대화/최소화 버튼은 차트의 창을 축소/확장합니다. 창은 차트에서 이동할 수 있습니다. 이렇게 하려면 창 상단 닫기 및 최소화 버튼 근처를 클릭한 다음 창을 원하는 위치로 이동합니다. Expforex,Vladon,Indicator,Utility
FREE
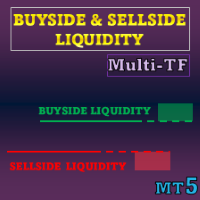
특별 제공 : 모든 도구 , 개당 $35 . 신규 도구 는 첫 주 또는 처음 3건 구매 까지 $30 입니다! MQL5 Trading Tools 채널 : 최신 소식을 받으려면 제 MQL5 채널에 가입하세요 이 지표는 유동성 레벨 과 유동성 존 을 ICT 개념 에 기반하여 시각화하고, 단방향 가격 이동을 강조하기 위해 Liquidity Voids 를 표시합니다. 스톱/미결 주문이 모이기 쉬운 위치와, 가격이 이를 통과한 이후 해당 영역이 어떻게 변하는지에 초점을 맞춥니다.
MT5 버전 더 보기: Buyside and Sellside Liquidity MT5 Multi Timeframe MT4 버전 더 보기: Buyside and Sellside Liquidity MT4 Multi Timeframe 더 많은 제품: All P roducts 핵심 하이라이트 • 색상으로 구분된 레벨/존으로 양방향 유동성 구조(buyside/sellside)를

The indicator displays the size of the spread for the current instrument on the chart. Very flexible in settings. It is possible to set the maximum value of the spread, upon exceeding which, the color of the spread label will change, and a signal will sound (if enabled in the settings). The indicator will be very convenient for people who trade on the news. You will never enter a trade with a large spread, as the indicator will notify you of this both visually and soundly. Input parameters: Aler
FREE

Daily pivot are relatively important in trading.
This indicator have options to select 5 commonly use pivot point calculations.
User input Choose Pivot Point Calculation (Method Classic, Method Camarilla, Method TomDeMark, Method Fibonacci or Method Woodies.) Choose Applied Timeframe for the calculation (M5, M15, H1, H4, D1, W1 etc) Can be attached to any timeframe Choose color of Pivot point Note:
For MT4, please refer here : https://www.mql5.com/en/market/product/22280
FREE
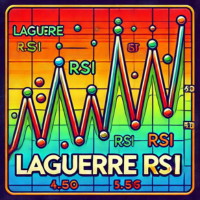
If you love this indicator, please leave a positive rating and comment, it will be a source of motivation to help me create more products <3 Key Takeaways The Laguerre RSI is an enhanced version of the traditional Relative Strength Index (RSI) that incorporates Laguerre filters to smooth the price data. This helps reduce the noise and volatility that are often seen in the standard RSI, providing a cleaner and more reliable indicator for spotting trends, reversals, and overbought or oversold con
FREE
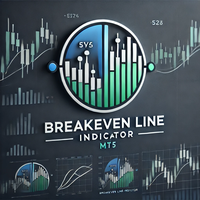
Simple indicator to show Breakeven line for all orders on attached chart pair. This indicator also comes with additional information such as Total Lot Size, Floating Drawdown in account's currency and Number of open positions and Difference from current price in Points. Do you use DCA (dollar cost average) or Hedging approach on your trading? Then this indicator you MUST have. Really useful, when you have multiple orders (hedging), this can help you quickly identify breakeven point without calc
FREE
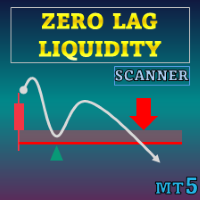
특별 할인 : ALL TOOLS , 개당 $35 ! 신규 도구 는 첫 주 또는 처음 3회 구매 까지 $30 ! MQL5의 Trading Tools 채널 : 최신 소식을 받기 위해 제 MQL5 채널에 가입하세요 Zero Lag Liquidity 는 하위 타임프레임의 꼬리 프로파일과 고거래량 꼬리를 이용해 유동성 구역을 표시합니다. 각 비정상 캔들에 대해, 지표는 꼬리 내부의 거래량 히스토그램을 구축하고 로컬 POC(Point of Control)를 찾아 그 가격을 레벨로 렌더링합니다. 이후의 상호작용은 가격이 이 레벨들에 어떻게 반응하는지에 따라 라벨, 돌파 신호, 그리고 단순한 추세 상태를 트리거할 수 있습니다.
MT5 버전 더 보기: Zero Lag Liquidity MT5 Scanner MT4 버전 더 보기: Zero Lag Liquidity MT4 Scanner 더 많은 제품 보기: All P roducts 개념 고거래량의 긴 꼬리: 비정상적으로

KC Multi-TF Unicorn Hunter is a professional Multi-Currency & Multi-Timeframe Dashboard designed to scan the entire market from a single chart. Stop wasting hours switching between 20 different charts. This indicator monitors your favorite pairs (Forex, Gold, Indices, Crypto) across 3 distinct timeframes simultaneously and alerts you only when a high-probability "Unicorn" setup occurs. What is a "Unicorn" Setup? Ordinary indicators generate too many false signals. A "Unicorn" setup is a rare, hi
FREE

Global Trading Sessions is a technical indicator for MetaTrader 5 designed to identify and mark the opening times of the four major financial sessions: Tokyo, London, New York, and Sydney . The indicator addresses the common challenge of varying broker server times by utilizing a GMT-based calculation logic . By synchronizing with Global Mean Time (GMT), the indicator ensures that session boundaries are accurately placed regardless of the brokerage platform’s local time zone. This makes it an es
FREE

Enhance your price action strategy: inside bar breakouts at your fingertips
This indicator detects inside bars of several ranges, making it very easy for price action traders to spot and act on inside bar breakouts. [ Installation Guide | Update Guide | Troubleshooting | FAQ | All Products ] Easy to use and understand Customizable color selections The indicator implements visual/mail/push/sound alerts The indicator does not repaint or backpaint An inside bar is a bar or series of bars which is/a
FREE

BBMA by RWBTradeLab is a clean chart-plotting indicator for MetaTrader 5 that combines Bollinger Bands , Linear Weighted Moving Averages (LWMA) on High/Low , and an EMA on Close to help traders read market structure visually. What it plots Bollinger Bands (Upper / Basis / Lower) LWMA on Low : 5 & 10 periods LWMA on High : 5 & 10 periods EMA on Close : default 50 periods Key features Plot-only indicator (no alerts, no trade execution) Non-repainting calculations (standard indicator plotting) Opti
FREE
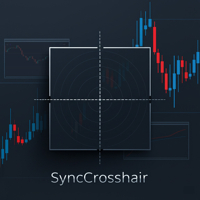
동기화 및 스냅 십자선 표시기 - 동기화 및 스냅 십자선 표시기
개요: 싱크크로스헤어는 트레이딩뷰의 십자선 경험을 여러 MT5 차트에 복제하는 경량 MQL5 인디케이터입니다. 마우스를 움직이거나 동기화된 차트를 클릭하면 차트 시간대(5분, 15분, H1, H4 등)의 각 캔들 개장 시간에 맞춰 세로 + 가로 선이 정확하게 스냅되는 것을 볼 수 있습니다.
주요 기능: - 다중 차트 동기화: 동기화 십자선이 연결된 모든 차트에서 십자선 위치를 자동으로 미러링합니다. - 타임프레임 스냅: 선이 현재 차트주기의 막대에 정확히 고정됩니다(예: M5에서는 5분마다, M15에서는 15분마다, H1에서는 매시간). - 로컬 및 글로벌 토글: 활성화된 차트에서만 동기화를 활성화/비활성화하려면 S를 누릅니다. 모든 차트에서 동기화를 한 번에 활성화/비활성화하려면 H를 누릅니다. - 사용자 지정 가능한 모양: 원하는 선 색상, 스타일(점/실선/대시 등) 및 너비를 선택합니다. - 빠르고 부드러움:
FREE

HiperCube Market Profile ! Discount code for 20% off at Darwinex Zero: DWZ2328770MGM_20 A Market Profile is a graphical representation that combines price and time information in the form of a distribution . It displays price information on the vertical scale (y-axis) and volume information on the horizontal scale (x-axis). This chart type provides insights into market activity, allowing traders to visualize and evaluate fair market value in real-time.
Features: Custom Colors Custom Chart Cl
FREE

Hull Suite by Riz | MT5 Indicator Overview: Hull Suite is a premium trend-following indicator that combines three powerful Hull Moving Average variations (HMA, EHMA, THMA) into one versatile tool. Designed for traders who demand clarity and precision, this indicator helps identify trend direction with minimal lag while filtering out market noise. Key Features: Three Hull Variations – Switch between HMA (classic), EHMA (exponential smoothing), and THMA (triple weighted) to match your trading styl
FREE

Indicator Description 4 Hull MA Color + Envelopes is a powerful trend-following indicator for MetaTrader 5 that combines four Hull Moving Averages (HMA) with Moving Average Envelopes to clearly identify market direction, trend strength, and potential reversal or pullback zones. This indicator is designed to reduce noise, react quickly to price movement, and provide a clean visual structure for professional trading. Key Features 4 Hull Moving Averages (20, 50, 100, 200) Automatic color change
FREE

Are You Tired Of Getting Hunted By Spikes And Whipsaws?
Don't become a victim of the market's erratic moves.. Do Something About It!
Instantly make smarter decisions with Impulse Pro's precise balance of filters and accurate statistics.
Timing Is Everything In Trading
To learn more, please visit www.mql5.com/en/blogs/post/718212 Anticipate the next big move before it unfolds in 3 Simple Steps!
Advantages You Get
Early impulse detection algorithm.
Flexible combination to different trading s

Titan Strength Pro Indicator- Multi-Currency Strength Analysis System Overview Titan Strength Pro is a technical indicator that analyzes the relative strength of 8 major currencies (USD, EUR, GBP, CHF, CAD, AUD, JPY, NZD) across all 28 forex pairs simultaneously. The indicator calculates currency strength values across multiple timeframes and generates trading signals based on strength divergence, trend alignment, and multi-timeframe convergence. This is an indicator tool that provides anal
FREE

Volume Weighted Average Price (VWAP) is a trading benchmark commonly used by Big Players that gives the average price a Symbol has traded throughout the day. It is based on both Volume and price. Additionally we put in this indicator the MVWAP (Moving Volume Weighted Average Price). For those who do not know the usage and the importance od this indicator I recommend a great article about this subject at Investopedia ( https://www.investopedia.com/articles/trading/11/trading-with-vwap-mvwap.asp )
FREE

Consecutive Candle Indicator MT5로 트렌드 탐지 능력을 강화하세요. 이 다이나믹한 도구는 연속적인 강세 또는 약세 캔들 시퀀스를 식별하도록 설계되어 외환, 주식, 암호화폐, 상품 시장에서 트렌드 확인 및 잠재적 반전을 위한 적시 알림을 제공합니다. Forex Factory와 Reddit의 r/Forex와 같은 거래 커뮤니티에서 찬사를 받고 있으며, Investopedia와 TradingView에서의 논의에서도 모멘텀 분석을 단순화하는 능력으로 인해 호평을 받고 있어, 변동성 높은 시장에서 명확한 신호를 찾는 트레이더들 사이에서 인기 있는 도구입니다. 사용자들은 더 높은 캔들 수(예: 연속 3-5개 캔들)를 사용할 때 지속적인 트렌드 탐지 정확도가 최대 80%에 달하며, 조기 진입을 피하고 확인된 모멘텀 변화를 집중함으로써 거래 타이밍이 15-25% 개선되었다고 보고합니다. 이점으로는 트렌드 강도의 정확한 식별, 핸즈프리 모니터링을 위한 사용자 정의 알림, 추
FREE

RSI ALARM (For Metatrader 5)
This indicator works like a normal RSI with all its settings (Periodicity, colors, levels, etc),
but additionally, alarms can be set at the upper and lower level (Example 70 and 30), with the possibility of adjusting these levels by moving the blue and red lines to establish the upper and lower levels.
You can also turn on and off an additional function that creates an arrow on the chart when the expected upper or lower RSI is met.

"NakaTrend를 소개합니다: MetaTrader 5용 궁극적인 트렌드 감지기!
거래 경험을 혁신하시기 준비 되셨나요? NakaTrend를 만나보세요. 정확하고 쉽게 트렌드 변화를 식별하는 데에 최적의 인디케이터입니다.
NakaTrend를 사용하면 시장 변동을 놓치지 않습니다. 상승 트렌드가 발생하면 NakaTrend가 초록색 달러 표시로 신호를 보내 구매 주문을 넣으라고 안내합니다. 그리고 하락 트렌드로 변할 때는 빨간색 달러 표시가 나타나 매도 주문을 넣을 때 최적의 시점임을 알려줍니다.
하지만 이것만이 아닙니다 - NakaTrend는 수동 주문 입력을 허용하여 귀하가 거래를 제어할 수 있도록 돕습니다. 당신의 직감과 NakaTrend의 통찰력이 수익성 있는 결과로 이끌어줍니다.
추측하거나 시대에 뒤떨어진 인디케이터에 의존하는 시대는 지났습니다. NakaTrend는 신뢰할 수 있는 명확하고 실행 가능한 신호를 제공하기 위해 고급 알고리즘을 활용합니다.
그리고 Nak
FREE
As the suggested, with this indicator you are able to switch from one symbol or timeframe to another in the same single chart. So forget about opening tons of chart on your screen! It's not designed for ICT or SMC trader, but if you are that kind of trader you still can use it. Imagine you have a strategy containing various indicators and settings, on a single chart you can screen the entry opportunity then move to the next symbol or timeframe.
FREE

[ZhiBiDW Trend] is a simple, intuitive and effective indicator of trends and shocks. It is suitable for chart periods of more than 15 minutes and less than 4 hours, suitable for all market varieties.
Buy signal: A blue up arrow appears; the arrow will appear with a preset price for Stop Loss and Take Profit.
Sell signal: A red down arrow appears; the arrow will appear with a preset price for Stop Loss and Take Profit.
Parameter setting description:
[Send_Alert]: This is the alarm switch, set
FREE
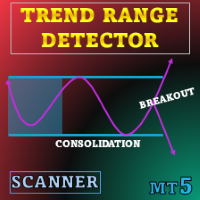
특별 할인 : ALL TOOLS , 개당 $35 ! 이 도구는 3일간 무료 로 제공됩니다. 놓치지 마세요! 새로운 도구 는 $30 에 판매되며 첫 주 또는 첫 3회 구매 에 적용됩니다! Trading Tools Channel on MQL5 : 최신 소식을 위해 제 MQL5 채널에 가입하세요 Trend Range Detector 는 가격 통합을 구조적이고 데이터 기반으로 보고 싶은 사용자들을 위해 제작되었습니다. 주관적 차트 판독 대신 명확한 변동성 규칙을 적용하여 가격이 멈춘 지점과 돌파가 시작되는 지점을 표시합니다. MT4 버전: Trend Range Detector MT4 Scanner 더 많은 제품: All P roducts 개요 Trend Range Detector Scanner 는 변동성과 최근 가격 움직임에서 파생된 박스를 그려 가격 압축 구간을 표시하는 기술 지표입니다. 종가가 밴드 안에 있으면 박스를 유지하며, 가격이 벗어나면 즉시 업데이

Raymond Cloudy Day Indicator for MT5 – Pivot-Based Reversal and Trend Levels Raymond Cloudy Day Indicator is a pivot-based level indicator for MetaTrader 5 (MT5). It was developed by Ngo The Hung based on Raymond’s original idea and is designed to give a structured view of potential reversal zones, trend extensions and support/resistance levels directly on the chart. The default settings are optimised for XAUUSD on the H1 timeframe, but the indicator can be tested and adjusted for other symbols
FREE

Indicator Name: CM EMA Trend Bars Overview: The CM EMA Trend Bars indicator is a straightforward yet effective tool that changes the color of price bars based on their relationship to the Exponential Moving Average (EMA). This visual cue helps traders quickly identify trend direction and potential trading opportunities. Key Features: Dynamic Bar Coloring: The indicator changes the color of the bars depending on whether they are above or below the EMA, providing a clear visual representation of t
FREE
Cumulative Delta Volume Indicator for MT5 (CDV Indicator for MT5) Volume-Based Market Sentiment and Trend Strength Indicator The Cumulative Delta Volume (CDV) indicator analyzes the balance between buying and selling volume to reveal the underlying market sentiment.
By accumulating the difference between upward and downward volume, it shows whether buyers or sellers are in control and helps traders confirm the strength or weakness of a trend. This tool provides both candle-based visualization an
Special offer : ALL TOOLS , just $35 each! New tools will be $30 for the first week or the first 3 purchases ! Trading Tools Channel on MQL5 : Join my MQL5 channel to update the latest news from me MetaTrader 5 (MT5) 용의 혁신적인 거래 도구인 SuperTrend AI Clustering MT5 with Scanner 로 AI의 힘을 발견하세요. 이 지표는 K-means 클러스터링과 널리 알려진 SuperTrend 지표를 결합하여 시장 분석을 재정의하고, 거래자가 트렌드와 신호를 탐색할 때 유리한 위치를 차지할 수 있도록 합니다. See more MT4 version at: SuperTrend AI Clustering MT4 with Scanner See more products at:

Im Sorry Ai Signal v1.26 – Precision Gold Scalping for MT5 Elevate your trading with Im Sorry Ai Signal , the latest technical indicator from the WinWiFi Robot Series . Specifically engineered for Gold (XAUUSD) scalpers on the MetaTrader 5 platform, this tool simplifies complex market movements into clear, actionable visual signals. Designed with a focus on Price Action within the M5 (5-Minute) timeframe , this indicator helps traders identify high-probability entry points in the fast-paced gol
FREE

FusionAlert StochRSI Master is an indicator available for MT4/MT5 platforms, it is a combination of RSI & Stochastic indicator which provide "alerts" when the market is inside "overbought and oversold" regions combined for both indicators, results in more precise and accurate signals to be used as a wonderful tool, in the form of "buy or sell" signals. This indicator comes with many customization options mentioned in the parameter section below, user can customise these parameters as needful. Jo
FREE

EMA Multi Timeframe (MTF) – MT5 Indicator Description: The EMA Multi Timeframe (MTF) indicator for MT5 allows you to display an Exponential Moving Average (EMA) from a higher (or lower) timeframe directly on your current chart. Example: You can see the Daily (D1) EMA 9 plotted directly on your H1 chart, or even on an M5 chart, helping you align your entries with higher timeframe trends without switching between charts. Key Features: Display EMA from selectable timeframes (M1, M5, M15, M30, H1
FREE

Keltner-Enhanced improves the accuracy and readability of Keltner Channels with many options for adjusting them and more five price calculations beyond the META default.
The Keltner-E indicator is a banded indicator similar to Bollinger Bands and Moving Average Envelopes. They consist of an upper envelope above a midline and a lower envelope below the midline.
The main occurrences to look out for when using Keltner Channels are breakouts above the Upper Envelope or below the Lower Envelope.
FREE

Stochastic Oscillator의 다중 통화 및 다중 시간 프레임 수정. 매개변수에서 원하는 통화와 기간을 지정할 수 있습니다. 패널에는 신호 및 기본(확률적 교차) 선의 현재 값과 교차점이 표시됩니다. 또한 지표는 과매수 및 과매도 수준을 넘을 때 알림을 보낼 수 있습니다. 마침표가 있는 셀을 클릭하면 해당 기호와 마침표가 열립니다. MTF 스캐너입니다.
통화 강도 측정기(CSM)와 마찬가지로 대시보드는 지정된 통화가 포함된 쌍 또는 해당 통화가 기본 통화로 포함된 쌍을 자동으로 선택할 수 있습니다. 표시기는 "쌍 집합"에 지정된 모든 쌍에서 통화를 검색합니다. 다른 쌍은 무시됩니다. 그리고 이 쌍을 기반으로 이 통화에 대한 총 확률론적 금액이 계산됩니다. 그리고 그 통화가 얼마나 강하거나 약한지 알 수 있습니다.
차트에서 대시보드를 숨기는 키는 기본적으로 "D"입니다.
매개변수 %K Period — K 라인의 기간입니다. %D Period — D 라인의 기간입니다

News Radar Pro transforms MT5’s built-in economic calendar into a live, on-chart trading tool. View upcoming macroeconomic events directly on your chart with impact-based filtering, countdown timers, and intelligent alerts, all in your chosen timezone. No external websites, APIs, or data feeds required. How It Works Economic Calendar Integration
Access MT5’s global economic events database directly on your chart. Event Filtering
Filter economic events by impact level (High, Medium, Low) and cu
FREE

Unlock powerful breakout opportunities
The 123 Pattern is one of the most popular, powerful and flexible chart patterns. The pattern is made up of three price points: a bottom, a peak or valley, and a Fibonacci retracement between 38.2% and 71.8%. A pattern is considered valid when the price breaks beyond the last peak or valley, moment at which the indicator plots an arrow, rises an alert, and the trade can be placed. [ Installation Guide | Update Guide | Troubleshooting | FAQ | All Products ]
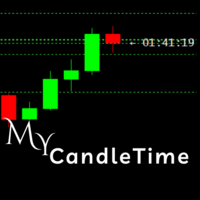
My CandleTime
This indicator displays the remaining time until the current candle closes directly on the chart.
It is designed to help traders keep track of candle formation without constantly checking the platform’s status bar. Main Features Shows countdown timer for the active candle. Works on any symbol and timeframe. Lightweight, does not overload the terminal. Adjustable font size and name. How to Use
Simply attach the indicator to a chart.
You can customize font size, color, and font to
FREE

1. Introduction Smart Volume S/R Pro is a powerful technical analysis tool designed for the MetaTrader 5 platform. Unlike traditional Support & Resistance (S/R) indicators that rely on price peaks and troughs, this indicator automatically identifies critical S/R zones based on a core factor: Trading Volume . Core Principle: Price levels that witnessed exceptionally high trading volume in the past will often become significant psychological zones, where the price is likely to react strongly (eith
FREE
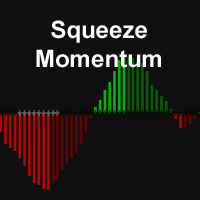
The Squeeze Momentum Indicator, identifies periods of low volatility ("squeeze") when Bollinger Bands are inside the Keltner Channel, marked by black crosses on the midline. This suggests the market is preparing for a significant move.
Gray crosses indicate a "squeeze release," signaling potential breakout. To use it, wait for the first gray cross after a black cross, then enter a trade in the direction of momentum (long if above zero, short if below). Exit when momentum shifts (color change i
FREE

Breakout Monitor is a powerful trading tool designed to track price action within your custom-drawn zones. Simply draw a rectangle on your chart to define your consolidation or key levels, and the indicator will do the rest. It highlights the price range clearly and monitors it in real-time, ensuring you never miss a significant market move. When the price breaks through your defined boundaries, the indicator sends an instant Push Notification directly to your mobile phone in a clear, actionable
FREE

This is a simple Orderblock alert indicator. it alerts you once it spots a bullish or bearish OB. what you choose to do with the alert, is left to you. Feel free to test on demo before use. (I'll be working on a combo i.e this and an EA working side by side, anticipate) Bullish OB has a light blue color and bearish has a light red color (rectangle box drawn on chart). Please trade wisely and don't forget to leave a positive review. thanks More blues to you, and Happy Trading!
FREE
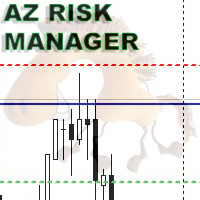
A simple indicator for calculating risk and automatically calculating the take profit line. In the settings, you enter the desired risk to profit ratio, the indicator will automatically calculate the volume for entry and show where to set the take-profit line to maintain the proportion. The risk is calculated based on your balance data. The information panel can be moved around the screen. The stop-loss line can also be moved, this will recalculate the entry volume and the take-profit position.
FREE
The Smart FVG Statistics Indicator is a powerful MetaTrader 5 tool designed to automatically identify, track, and analyze Fair Value Gaps (FVGs) on your charts. Love it? Hate it? Let me know in a review! Feature requests and ideas for new tools are highly appreciated. :)
Try "The AUDCAD Trader":
https://www.mql5.com/en/market/product/151841
Key Features Advanced Fair Value Gap Detection Automatic Identification : Automatically scans for both bullish and bearish FVGs across specified histo
FREE

If you love this indicator, please leave a positive rating and comment, it will be a source of motivation to help me create more products <3 How to use QQE? Determine trend when RSI MA above 50 indicate a bullish market, while RSI MA below 50 indicate a bearish market and can server as a trend filter. Identify short-term up/down momentum, when the RSI MA crosses up Smoothed signals bullish momentum, and when the RSI MA crosses down Smoothed signals bearish momentum. It is also possible to
FREE
This is a simple RSI indicator, but unlike the original one, it sends alerts when volume falls below the upper level or rises above the lower level, so you never miss a trading opportunity. Combined with support and resistance levels, it can provide strong entry opportunities into the market. I recommend keeping the levels as they are, i.e. 75 above and 25 below Check out my signal " PipStorm Invest ", save it to your favorites and come back from time to time to check it again :)
FREE

The Stochastic RSI (StochRSI) is a technical indicator that combines the characteristics of the Relative Strength Index (RSI) with the Stochastic Oscillator, resulting in a more sensitive tool that generates a higher number of trading signals. Developed by Tushar Chande and Stanley Kroll, the indicator was designed to overcome a perceived limitation of the traditional RSI: the low frequency of overbought and oversold levels activation (commonly 80 and 20), especially in less volatile assets. Ho
FREE

All traders should know the trend before making their decision when placing the buy or sell orders. The first step always starts with supply and demand , rising and falling channels , trend lines, engulfing candles etc. All the above contribute to what is called “Price Action” and that is the best and most reliable way in trading and catching the trend and making profits, without stress. The Investment Castle Trend Line Indicator will automatically draw the trend lines on the MT5 for you.
FREE
Range Identifier v3 User Guide 1. Overview The Range Identifier v3 is a technical analysis tool designed to automatically detect and visualize periods of market consolidation, commonly known as ranges. this MQL5 version brings the same powerful logic to the MetaTrader 5 platform. The primary function of this indicator is to draw a channel around recent highs and lows during periods of low volatility. When the price breaks out of this channel, the indicator provides an alert, helping traders iden
FREE

Pro ADX Histogram: Visual Momentum & Trend Strength Indicator Elevate your technical analysis with ADX Histogram, an innovative MetaTrader 5 tool that transforms the classic Average Directional Index (ADX) into an intuitive, visual powerhouse. This indicator combines trend strength and momentum direction into a single, easy-to-read histogram, allowing you to assess market conditions and spot potential trading opportunities faster and with greater clarity. Trading Idea & Core Logic The indicator
FREE

The Chandelier Exit Indicator for MT5 is a powerful tool designed to help traders manage trades by dynamically adjusting stop-loss levels based on market volatility. It is based on the Average True Range (ATR) and follows the trend, placing stop-loss levels above or below price action, depending on the trend direction. This makes it an effective tool for trend-following strategies, breakout trading, and risk management .
Key Features: • Dynamic Stop-Loss Placement – Adjusts stop-
FREE

Utazima Universal AI – Institutional Smart Money Dashboard (FREE) Product Overview Utazima Universal AI is a professional manual trading indicator designed to help traders identify institutional price behavior with clarity and precision. The indicator combines Smart Money Concepts (SMC) , AI-based market filtering , and time-based session logic (Silver Bullet) into a single, clean non-repainting dashboard for MetaTrader 5. This tool is suitable for traders who want structure, confirmation,
FREE

Weis Wave Box 와 함께 분석을 업그레이드하세요! 정확하고 명확한 트레이딩 을 원하신다면, Weis Wave Box 가 이상적인 도구입니다. 이 고급 볼륨 웨이브 지표 는 시장에서 노력과 결과 간의 역학을 명확하게 시각화하여, 주문 흐름과 볼륨 분석을 사용하는 트레이더에게 필수적입니다. 주요 기능: 사용자 지정 가능한 볼륨 웨이브 – 전략에 맞게 틱 단위로 조절 가능.
조정 가능한 히스토리 – 특정 기간을 더 정확하게 분석.
실제 거래량 vs 틱 수 – 시장에 미치는 실제 영향 이해.
시각적 에너지 박스 – 시장의 높은 노력과 낮은 움직임 영역 확인.
️ 5가지 스윙 유형 – totalVol, length, width, barDVol, lengthDVol 기반 맞춤 설정 가능. 실제 혜택: 볼륨 로직에 대한 시각적 명확성 주도하는 매수 또는 매도 세력 식별 잠재적 반전 또는 지속 신호 제공 관련 지표
Big Player Range – 기
Alpha Edge Pro – The Manual Trader’s Edge - If you prefer trading manually without stress, this indicator is for you. Get your copy now. Tired of missing the big moves or holding on to losing trades too long? Alpha Edge Pro is your new secret weapon. This high-performance, plug-and-play MT5 indicator gives you crystal-clear BUY and SELL signals — so you can trade with confidence, precision, and speed. If you prefer manual trading profitably , this indicator is made for you. Alpha Edge Pro does
FREE

Logic Trade Solution Indicator (Standalone)
Idea by Suresh Dhuraisami | Code by Rafilathif Description The Logical Trading System (LTS) is a powerful multi-timeframe indicator for MetaTrader 5, designed around the concept of Valid Reversal Zones (VRZ). It generates precise trading signals and delivers comprehensive alerts, ideal for traders who value structured price action and zone-based strategies. Key Features VRZ Zone Detection: Identifies high-probability reversal zones using swing hig
FREE

Key Price Levels Indicator Indicator that shows the highs and lows for the significant price levels for past periods that could be potentially considered as reaction levels. The indicator displays the following price levels: Yesterday high and low The day before yesterday high and low Two days back high and low Last week high and low Last month high and low Last three month high and low (Quarter) Last year high and low
FREE

MT5용 Crypto_Forex 지표 HTF RVI 오실레이터, 다시 칠할 필요 없음.
- MT5용 전문가용 HTF RVI Oscillator로 거래 방법을 업그레이드하세요. HTF는 - 더 높은 시간 프레임을 의미합니다. - RVI는 과매도/과매수 영역에서 추세 변화 감지 및 진입을 위한 최고의 오실레이터 중 하나입니다. - 이 지표는 과매도/과매수 영역에서 가격 액션 진입이 있는 다중 시간 프레임 거래 시스템에 적합합니다. - HTF RVI Indicator를 사용하면 더 높은 시간 프레임의 RVI를 현재 차트에 첨부할 수 있습니다 --> 이는 전문적인 거래 접근 방식입니다. - 과매도 영역은 0.23 이상입니다. 과매도 영역은 -0.23 미만입니다. - 지표에는 모바일 및 PC 알림이 내장되어 있습니다.
여기를 클릭하여 고품질 트레이딩 로봇과 지표를 확인하세요! 이 MQL5 웹사이트에서만 제공되는 오리지널 제품입니다.

Калькулятор размера позиции в виде индикатора. Для тех случаев, когда использование стандартных советников для расчета риска невозможно. Два режима работы: Маркет и Отложенные ордера. Передвигаете линию SL и получаете необходимый объем позиции согласно настройкам риска. Только показывает информацию, сделки сам не открывает. Для корректной работы следует добавить все Major пары в Market Watch.
FREE
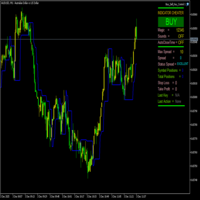
FractalBreakoutLevels 개요:
이 지표는 가격 변동 분석을 기반으로 동적인 가격 수준을 표시합니다. 거래의 참고가 될 수 있는 주요 수준을 식별하기 위해 과거 가격 데이터를 결합합니다. 작동 원리:
이 지표는 현재 및 과거 가격 데이터 간의 관계를 분석하여 시장 구조를 조사합니다. 변화하는 시장 조건에 적응하는 연속선을 그리며, 동적 지지/저항 수준으로 작용합니다. 수준 형성 원리: 지표는 여러 연속 봉에 대한 분석을 결합하여 사용합니다 특정 가격 관계 하에서 수준이 형성됩니다 명확한 신호가 없을 경우, 지표는 이전 값을 유지하여 연속선을 생성합니다 기술적 사양: 가격 차트에서 직접 작동합니다 연속 수준(파란색 선)을 표시합니다 외부 설정이 없으며 표준 가격 데이터로 작동합니다 과거 값을 다시 그리지 않습니다 적용:
이 지표는 다음과 같은 목적으로 사용할 수 있습니다: 잠재적 지지/저항 수준 식별 가능한 추세 반전 지점 탐지 표시된 수준에 대한 손절매 수준 설정
FREE
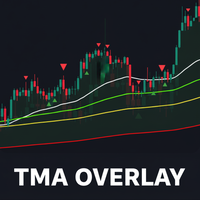
TMA Overlay Indicator for MT5 - User Guide 1. Introduction TMA Overlay is a versatile technical analysis indicator for the MetaTrader 5 platform. The indicator's goal is to provide traders with a comprehensive overview of the trend, potential entry signals, and key trading sessions, all integrated into a single chart. This is not a trading system, but a comprehensive analysis tool designed to help you make more informed decisions. 2. Core Indicator Components The indicator consists of multiple c
FREE
The Channel Sgnals ProfRoboTrading Indicator for MT5 is an effective Forex trading tool designed to track market movements. The MT5 signal point indicator effectively detects trend reversals after they have already occurred. This Indicator is a fully automated technical tool that includes a number of parameters to track market trends. It automatically examines the ever-changing price dynamics of the market, compares the information with earlier data and generates a trading signal. Because
FREE

WaveTrendPro Arrow – Adaptive Cross Signal with Smart Alerts Description WaveTrendPro Arrow is a clean and powerful visual indicator designed to detect trend-reversal points using the classic WaveTrend oscillator (WT1/WT2 cross) , enhanced with intelligent on-chart arrows , real-time alerts , and mobile push notifications . Unlike traditional WaveTrend indicators that display signals in a subwindow, this version shows precise entry arrows directly on the main chart , positioned adaptively
FREE
스텝 채널 모멘텀 트렌드 지표 (MT5 Indicator) 스텝 채널 모멘텀 트렌드 는 시장 구조와 동적 변동성 분석을 결합하여 트레이더에게 적응형 이점을 제공하도록 설계된 강력한 모멘텀 기반 지표입니다. 이 도구는 고유한 단계 중간선과 ATR 필터 채널을 사용하여 지연에 의존하지 않으면서 트렌드와 범위를 명확하게 구분하는 데 도움을 줍니다. 주요 기능 구조적 단계 중간선 시스템의 핵심은 확인된 가격 피봇에만 기반한 “단계 Midline”입니다. 새로운 고점이나 저점이 확인될 때만 업데이트하여 불필요한 지연을 제거하고 시장 구조 변화에 즉시 반응합니다. 이 단계적 접근법은 명확한 레지므 전환을 생성하고 가격 현실에 머물게 하여 인디케이터 잡음을 피합니다. 중간선은 최근 강세와 약세 간의 균형을 나타내며 방향, 브레이크 아웃 또는 리트레이스에 대한 신뢰할 수 있는 기준점 역할을 합니다. 동적 변동성 밴드 ATR (Average True Range)을 사용하여 위와 아래 밴드를 작성하여
FREE

Contact me to send you instruction and add you in group.
QM (Quasimodo) Pattern is based on Read The Market(RTM) concepts. The purpose of this model is to face the big players of the market (financial institutions and banks), As you know in financial markets, big traders try to fool small traders, but RTM prevent traders from getting trapped. This style is formed in terms of price candles and presented according to market supply and demand areas and no price oscillator is used in it. RTM conc

Finally a Metatrader version of the very popular (and expensive) Market Cipher B indicator, or the Vumanchu Cipher B + Divergences very popular on Tradingview platform.
This tool is very heavy on calculations, total are 31 plots using 97 buffers from several indicators. On my mid end computer, timeframes below M15 start getting a bit laggy, so it would require a powerful computer to run it properly at very low timeframes. It's still usable here, but somewhat sluggish response in Metatrader (lik
FREE

For feedback, free connect to signal, PARTNER PROGRAM and detailed information : Facebook Welcome to the "Breakeven Line" indicator, version 1.1, developed by Sergei Ivanov in 2025. Visualize breakeven price levels for your trades with precision and ease. Advisor Description The "Breakeven Line" is a MetaTrader (MQL5) indicator that displays breakeven price levels for open buy and sell positions on the current symbol, factoring in commissions and swaps for accurate risk management. Key
FREE

The indicator shows the current timeframe and symbol name. It is also possible to turn on the indication of time until the end of the current bar. In the settings, you can specify: - the location of the indicator in relation to the terminal window, top left, top right, bottom left and bottom right - a row of text display arrangements so that the inscriptions do not overlap each other - color - font - font size.
FREE

RITZ QUANTUM PULSE Next-Generation Economic Intelligence System Ritz Quantum Pulse — Next-Gen Economic Intelligence System.
Experience quantum-level precision in news trading: real-time event detection, AI-powered filtering, and temporal synchronization.
Anticipate volatility before it happens — not after.
Where Market Intelligence meets Temporal Physics. Ritz Quantum Pulse represents the convergence of quantum logic , AI-driven analytics , and real-time economic intelligence .
This is
FREE

Big bull scalper Short Description Master market structure with the precision of the popular Big bull scalper This tool automatically identifies key pivot highs and lows, plotting unique "angling" trend lines that dynamically define market context. It visually confirms Breaks of Structure (BOS) and Changes of Character (CHoCH), removing all guesswork from your analysis.
Key Features: Automatic Pivot Detection Instantly spots significant swing highs and lows. Dynamic Angling Lines Visual
FREE
트레이딩 전략과 기술 지표를 판매하기에 가장 좋은 장소가 왜 MetaTrader 마켓인지 알고 계십니까? 광고나 소프트웨어 보호가 필요 없고, 지불 문제도 없습니다. 모든 것이 MetaTrader 마켓에서 제공됩니다.
트레이딩 기회를 놓치고 있어요:
- 무료 트레이딩 앱
- 복사용 8,000 이상의 시그널
- 금융 시장 개척을 위한 경제 뉴스
등록
로그인
계정이 없으시면, 가입하십시오
MQL5.com 웹사이트에 로그인을 하기 위해 쿠키를 허용하십시오.
브라우저에서 필요한 설정을 활성화하시지 않으면, 로그인할 수 없습니다.