适用于MetaTrader 5的技术指标 - 23

Opening Range Indicator
Idea Toby Crabel introduced this way of trading in the ealy ninties in his book "Day Trading with Short Term Price Patterns and Opening Range Breakout". In simple terms this means to trade the brekouts from the limits of the first trading hour with the stop loss at the opposite side. I.e. if the first hourly candle meausres 40 points (Crabel calls this the "stretch") you set the stop loss at breakout level minus 40 points and the take profit at the breakout level plus 4
FREE

INTRODUCTION : The breakout strength meter is a trading tool that is used to identify which currencies are the strongest to breakout, and which currencies are the weakest to breakout. The settings for the indicator are easy, and if you cannot find the settings, please leave a comment The tools are completely free to use Please, if you like the indicator, please leave a comment and rate the indicator in order to develop it
FREE

Check out my TRADE PLANNER MT5 – strongly recommended to anticipate account scenarios before risking any money. This is the Bill Williams Awesome Oscillator indicator calculated from Heikin Ashi candles. Here you find multi-colored histogram which is helpful when identify weakness or strength of trend in the market. To use it, just simply drop it on the chart and you don't need to change parameters except one: switch between Heikin Ashi or normal candles (see attached picture).
FREE
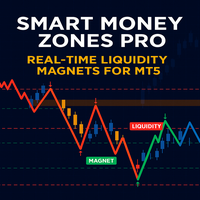
如果您想嘗試更了解 SM Zones Pro 指標的功能,我們建議您先下載並嘗試免費的 SM 區域指標,該指標適用於在不同時間範圍內與單一 EURUSD 工具配合使用。您可以從這個市場下載 SM Zones。 SMZones Pro 與 SM Zones 不同,它可以同時分析多達 10 種不同的儀器。
SM Zones Pro 指標是根據智慧資金管理策略的原則開發的,對於 MetaTrader 5 (MT5) 平台上的交易者來說是一個非常方便的工具。它以圖形方式在圖表上顯示 SM 策略中使用的所有重要區域:市場結構、流動性增加的價格水平、“價格磁鐵”區域 - 不平衡、訂單塊、fvg、斷路器塊和緩解塊 - 工具價格朝這些區域移動。影響牛市的區域以綠色突出顯示,而影響熊市的區域則以棕色突出顯示。這些水平反映了價格可能變化的區域,通常受到大型機構和銀行訂單的影響。當價格達到這些關鍵區域時,可能會經歷大幅快速的波動,這通常會讓交易者了解如何做出正確的交易決策。
使用淺色主題可以最方便地查看圖表。您可以建立一個方便的淺色主題模板並將其用於所有這些框架。
如何根據您的需求客製化 Smart

Swiss VWAPsimple Motivation Did not find free VWAP that works, the one that I found craseh. So I created a VWAP which calculates values only for the actual day. So computer resouces are not over stressed.
What is VWAP, how is it used? VWAP stands for Volume Weighed Average Price, it calculates the running sum of tick volume and the runnung sum of price times tickvolume. The division of these sums result in a weighed price (Sum P*V/Sum V). The calculation starts normally at midnight. The values
FREE

Unlock the full potential of your Pro Thunder V9 indicator with our revolutionary new plugin - Auto Trend Lines! Are you looking for a competitive edge in today's dynamic market? Look no further. With Auto Trend Lines, you can harness the power of precise market trend analysis to make informed trading decisions. This innovative plugin seamlessly integrates with your Pro Thunder V9 indicator, providing you with real-time trend data and pinpointing exact entry and exit points for your trades. Key
FREE
Stop guessing where the market will turn. Our advanced High/Low Indicator for MT5 is the ultimate tool for mastering price action and identifying key market structure. It automatically scans the chart to identify and clearly plot all critical swing highs and lows in real-time, helping you see the true story behind the candles. These crucial, non-repainting levels form the backbone of any successful trading strategy. Use them to instantly visualize the market's framework, allowing you to pinpoint
FREE

ATR Based Swing Trader Indicator Description The ATR Based Swing Trader Indicator is a sophisticated technical analysis tool designed for MetaTrader 5 (MT5) to assist swing traders in identifying potential buy and sell signals based on the Average True Range (ATR) and trend direction. Developed by Rahulkumar Kanani, this indicator leverages volatility and price movement to generate actionable trading signals, making it suitable for traders who aim to capture short- to medium-term price swings in
FREE

ATR Plus is an enhanced version of the classic ATR that shows not just volatility itself, but the directional energy of the market .
The indicator converts ATR into a normalized oscillator (0–100), allowing you to clearly see: who dominates the market — buyers or sellers when a trend begins when a trend loses strength when the market shifts into a range where volatility reaches exhaustion zones ATR Plus is perfect for momentum, trend-following, breakout and volatility-based systems. How ATR Plus
FREE

KEY FEATURES: One-Click Chart Switching (Fast Navigation) Simply click on any symbol name in the dashboard, and your chart instantly changes to that pair. Never miss a trade setup again due to slow navigation. Triple Signal Detection Monitors 3 powerful indicators simultaneously for every symbol: RSI Monitor: Detects Overbought/Oversold conditions instantly. Stochastic: Confirms momentum shifts. MA Trend: Identifies the main trend direction (Bullish/Bearish) using Moving Averages. writ Any Symb
FREE
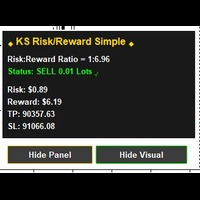
RR Ratio KS Simple Calculator Indicator Overview The RR Ratio KS Simple Calculator Indicator is a free, lightweight tool for MetaTrader 5 that automatically visualizes risk-reward (RR) ratios on your chart. Designed for manual traders and automated systems (EAs), it detects open positions with defined stop-loss (SL) and take-profit (TP) levels, then overlays clear visual zones to show potential risk and reward areas, including precise dollar amounts. This helps traders quickly assess trade setup
FREE

The balance of supply and demand is a simple and effective market analysis method. The supply and demand diagram can show you in advance, even before the trend reversal, where the supply ends and the demand is already emerging, where the demand ends and the supply is emerging, while substantially increasing the probability of making a deal in the right direction and with a high profit factor.
Indicator signals The indicator uses the price/volume values to generate signals: ED – excess demand. E

FREE

Shadow System Candles - AI Trend Visualization
Concept "Stop trading in the dark. Equip your chart with Night Vision."
Shadow System Candles is the visual core of the "Shadow Operation" project. It eliminates market noise and visualizes the true direction of the trend using AI-based logic (ADX + MA integration).
Note: This tool does not generate buy/sell arrows. It is designed to train your eyes to recognize "Active Trends" and "Dangerous Ranges.
Key Features ・AI Logic Coloring[/b]: Automat
FREE

MT4 Version Most indicators draw lines.
This one draws the battlefield. If you ever bought an EA or indicator based on a perfect equity curve — and then watched it bleed out live — you’re not alone.
The problem? Static logic in a dynamic market. Fibonacci Bollinger Bands adapts.
It combines Bollinger structure with customizable Fibonacci levels to mark zones of control — where price reacts, pauses, or reverses. No magic. Just logic that follows volatility. Why this tool matters It
FREE

1. Introduction Smart Volume S/R Pro is a powerful technical analysis tool designed for the MetaTrader 5 platform. Unlike traditional Support & Resistance (S/R) indicators that rely on price peaks and troughs, this indicator automatically identifies critical S/R zones based on a core factor: Trading Volume . Core Principle: Price levels that witnessed exceptionally high trading volume in the past will often become significant psychological zones, where the price is likely to react strongly (eith
FREE

Key Price Levels Indicator Indicator that shows the highs and lows for the significant price levels for past periods that could be potentially considered as reaction levels. The indicator displays the following price levels: Yesterday high and low The day before yesterday high and low Two days back high and low Last week high and low Last month high and low Last three month high and low (Quarter) Last year high and low
FREE
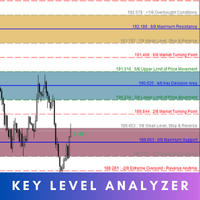
Key Level Analyzer – Know Better, Trade Smarter Key Level Analyzer is a powerful trading tool designed to provide precise market insights by identifying high-probability price zones , market turning points , and key decision areas . Unlike traditional indicators, it uses a smart algorithm to dynamically calculate support, resistance, and balance zones, helping traders make informed, data-driven decisions . MT4 Version - https://www.mql5.com/en/market/product/132809/ With real-ti

Free forever simple pip meter for MT5 with customizable font color. Display profit or loss in both points count and currency value. Supports 4 currency symbols ($,€,£ ,¥). For unsupported currencies, it shows a 3-character currency short form. Enhance your trading interface with clarity and precision. Easy to use and tailored for diverse Forex traders. Perfect for MT5!
FREE

"介绍NakaTrend:您在MetaTrader 5中的终极趋势检测器!
准备彻底改变您的交易体验了吗?来看看NakaTrend,您在精确和轻松识别趋势变化方面的首选指标。
有了NakaTrend,您将不会错过任何利用市场变化的机会。当出现看涨趋势时,NakaTrend会用绿色美元符号来表示,提示您进入买单。当趋势转为看跌时,会出现红色美元符号,表明这是放空的完美时机。
但这还不是全部- NakaTrend赋予您掌控交易的能力,允许手动下单。您的直觉与NakaTrend的见解相结合,将带领您取得有利的结果。
那些依赖猜测或过时指标的日子已经一去不复返了。NakaTrend利用先进的算法为您提供清晰、可操作的信号,您可以信任。
由于NakaTrend直接在MetaTrader 5中运行,将其集成到您的交易例程中是顺畅且无需麻烦的。只需安装NakaTrend,您将立即获得其强大的功能和功能。
但请记住,成功的交易不仅仅是进入交易-还包括知道何时退出。NakaTrend将这一决定留给您,让您可以根据自己的风险偏好和市场情况管理交易。
为了充分利用NakaTrend,请确保您
FREE

通过 Consecutive Candle Indicator MT5 增强您的趋势识别能力,这是一款动态工具,旨在识别连续的看涨或看跌K线序列,为外汇、股票、加密货币和商品市场提供及时的趋势确认和潜在反转警报。在 Forex Factory 和 Reddit 的 r/Forex 等交易社区中备受推崇,并在 Investopedia 和 TradingView 的讨论中因其简化动能分析的能力而受到赞扬,该指标是寻求在波动市场中获得清晰信号的交易者的首选。用户报告称,使用较高的K线计数(例如,3-5根连续K线)时,检测持续趋势的准确率高达80%,许多人指出通过避免过早入场并专注于确认的动能变化,交易时机提高了15-25%。其优势包括精确识别趋势强度、可定制的警报实现免手动监控,以及用户友好的设计,无需额外工具即可增强剥头皮、日内交易和波段交易者的决策能力。 Consecutive Candle Indicator MT5 在用户定义的连续看涨K线数量(默认 N_CANDLE=3)后跟一根看跌K线后,在K线下方绘制绿色向上箭头(BuyBuffer),提示潜在的趋势耗尽或反转;在连续看跌K线
FREE

Probability emerges to record higher prices when RVi breaks out oscillator historical resistance level. It's strongly encouraged to confirm price breakout with oscillator breakout since they have comparable effects to price breaking support and resistance levels; surely, short trades will have the same perception. As advantage, a lot of times oscillator breakout precedes price breakout as early alert to upcoming event as illustrated by last screenshot. Furthermore, divergence is confirmed in
FREE
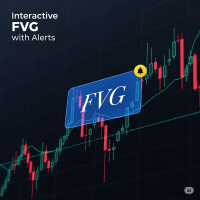
FVG Indicator with Alerts Description: This is a simple and effective indicator for identifying and displaying Fair Value Gaps (FVGs) on any timeframe. The indicator helps you see important price imbalances and provides powerful interactive tools for your analysis. Key Features: Detects FVGs: Clearly identifies and draws boxes around Bullish and Bearish Fair Value Gaps. Midline Level: Displays the 50% equilibrium level inside each FVG box, a critical point of interest. Complete Alert System: Rec
FREE

INDICATOR: Trend Line GEN INDICATOR: Trend Line GEN Developer: gedeegi General Description Trend Line GEN adalah indikator yang secara otomatis menggambar trendline berdasarkan titik-titik swing penting (highs dan lows) pada chart. Garis-garis ini berfungsi sebagai support dan resistance dinamis untuk membantu pengambilan keputusan trading. Key Features Automatic Swing Detection: Mengidentifikasi pivot high dan pivot low secara otomatis. Flexible Slope Calculation: Pilihan metode perhitungan ke
FREE
If you love this indicator, please leave a positive rating and comment, it will be a source of motivation to help me create more products <3 Key Takeaways The Laguerre RSI is an enhanced version of the traditional Relative Strength Index (RSI) that incorporates Laguerre filters to smooth the price data. This helps reduce the noise and volatility that are often seen in the standard RSI, providing a cleaner and more reliable indicator for spotting trends, reversals, and overbought or oversold con
FREE
Price Predictor Pro Turn Market Patterns into Predictable Profits!
Are you tired of guessing where the market will go next? With Price Predictor Pro , you’ll trade with confidence by spotting powerful chart patterns and receiving precise price projections —directly on your MT5 chart.
What Price Predictor Pro Does: ️ Detects high-probability chart patterns like Double Tops, Double Bottoms, Head & Shoulders, Flags, Pennants, and more . ️ Instantly projects the next price target using adv
FREE

Introducing the South African Sniper Indicator
Created by a dedicated team of South African traders with years of profitable experience in the financial markets, the South African Sniper Indicator is designed to give traders a sharp edge — combining simplicity, precision, and power in one tool.
This is a plug-and-play indicator for MT5, built to deliver accurate BUY and SELL (Sniper Entry) signals — complete with target levels and automated trailing stops. Whether you trade forex, indice
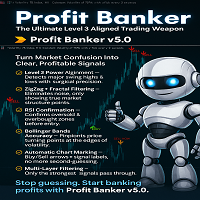
N/B: All our product purchase comes with our free ‘’DAILY SCALPER EA’’ - bit.ly/4qlFLNh Whatsapp Developer for yours after successful purchase
THE 4 GUARDIANS OF PROFIT BANKER
1. LEVEL 3 POWER INDICATOR (The General)
· Identifies MAJOR market turning points · Filters out noise and minor fluctuations · Only acts on significant high/low points
2. ZIGZAG FRACTALS (The Confirmer)
· Validates the Level 3 signals · Ensures swing point authenticity · Adds second-layer confirmation

## ONLY GOLD
## Тiльки Золото
## **Mercaria Professional Trading Zones - Complete Guide** ## **Mercaria Professional Trading Zones - Повний посібник**
### **How Mercaria Zones Work / Як працюють зони Mercaria**
**English:** Mercaria Zones is an advanced trading indicator that identifies high-probability support and resistance areas using ZigZag extremes combined with mathematical zone calculations. The indicator works on multiple timeframes simultaneously, providing a comprehensive view

Volume Horizon is a horizontal volume indicator that allows you to observe the density of market participants' volumes across various price and time intervals. Volume histograms can be constructed based on ascending or descending market waves, as well as individual bars. This tool enables more precise determination of entry or exit points, relying on levels of maximum volumes or volume-weighted average prices (VWAP).
What makes Volume Horizon unique? 1. Segmentation into ascending and descendi

Overview Gold Master Indicator is a specialized analytical tool designed for the XAUUSD (Gold) market. It utilizes a multi-layered confluence algorithm to identify potential trend reversals and exhaustion points in price action. The indicator aims to filter market noise and provide clear visual signals for manual trading or as a filter for automated systems.
Key Technical Features
Multi-timeframe analysis integration to confirm trend direction.
Real-time volatility adjustment to adapt to diffe

True TrendLines MT5 - Smart Trend Detection & Alerts Overview True TrendLines MT5 is a professional-grade technical analysis tool that automatically identifies and plots high-probability trend lines on your MetaTrader 5 charts. Using a sophisticated swing point detection algorithm, it helps traders visualize key market structure and potential reversal points with precision. Key Features Automatic Trend Line Detection Identifies valid swing highs and lows based on your chosen strength paramet
FREE

Moving Average Convergence/Divergence — схождение/расхождение скользящих средних — технический индикатор, разработанный Джеральдом Аппелем (Gerald Appel), используемый в техническом анализе для проверки силы и направления тренда, а также определения разворотных точек. Встроенный в MetaTrader 5 индикатор MACD не соответствует задумке автора (Gerald Appel):
-линия MACD графически изображена в виде гистограммы, однако гистограммой отражается разница между линией MACD и сигнальной линией;
-сигнальн
FREE

Time Candle with Sound Alert
This indicator will be display the time left candle Features : 1. Multi Time Frames, Multi Pairs 2. Time Left 2. Position dynamic with Bid Price or Edge of Chart Screen 3. Font Size and Color 4. Display Current Spread, Maximum Spread and Minimum Spread
Note: Maximum and Minimum Spread will be reset when you change TF Tested On MT5 Version 5 Build 5200
If you want the source code, just PM me
FREE

Introduction to Fibonacci Volatility Indicator Volatility indicator can help you to detect any statistical advantage for your trading. Especially, if you are trading with Price Action and Price Patterns, then we recommend to use the Volatility indicator together with your strategy. Especically, Fibonacci Volatility indicator combines the market volatiltiy with Fibonacci Analysis to provide you more advanced volatiltiy indicator. Main Features Fibonacci Volatility in Z score Configuration Mode Fi

The Magic LWMA indicator is of great help in determining trend direction. It can be an excellent addition to your existing strategy or the basis of a new one. We humans can make better decisions when we see better visually. So we designed it to show a different color for rising and falling trends. Everyone can customize this in the way that suits them best. By setting the Trend Period, we can optimize it for longer or shorter trends for our strategy. It is great for all time frames.
IF YOU NEE
FREE

The Smart Liquidity Profile is color-coded based on the importance of the traded activity at specific price levels, allowing traders to identify significant price levels such as support and resistance levels, supply and demand zones, liquidity gaps, consolidation zones, Buy-Side/Sell-Side Liquidity and so on. Smart Liquidity Profile allows users to choose from a number of different time periods including 'Auto,' 'Fixed Range,' 'Swing High,' 'Swing Low,' 'Session,' 'Day,' 'Week,' 'Month,' 'Quart

Welcome to Propsense, the best solution for new and veteran traders with a simple FREE strategy! NEW to MT5! This indicator is a unique and affordable trading tool built on the teachings of a former bank trader. With this tool, you will be able to see inefficient points with ease. Additionally, traders will have a clean Heads Up Display which will show your running and closed P/L in pips AND currency units. As a highly requested option, a candle timer has been added which will allow you to j

本指标的主要目的是根据 "混沌交易, 第二版" 策略,在图表里检测并标记交易信号。 带有角度的多头和空头背离柱线 (包括下蹲)。 柱线位于红色或绿色区域,是根据动量振荡器的直方条颜色。 图表上的下蹲柱线颜色独立于动量振荡器直方条。 "important" 级别的分形与鳄鱼指标的 "Teeth line" 相关。 绘制角度射线,是从平衡线至反转柱线。 第二智者和蓝光信号。 动量振荡器指标的 "区域里随后的第五根柱线" 信号。 本指标包括 新交易维度图表 指标的基本功能, 即以下: 检测并指示当直方条线穿越零轴时在图表上生成信号,以及相同方向上形成的蓝光特殊信号。 彩色柱线有三个区域 (红, 绿, 灰), 检测下蹲柱线。 为了切换 新交易维度图表 的功能, 将输入参数 Use new trading dimensions colors 设为 TRUE 值。 本指标根据 B. Williams 描述的策略专为 MetaTrader 5 开发。 图例: 蓝色柱线 - 下蹲柱线。 柱线之上的红星或绿星 - 柱线含有 "反向" 背离信号 (BDB)。 红色菱形或绿色菱形 - "第二智者" 信号。

Order block hunter indicator is the best indicator for hunt the order blocks that area where there has been a large concentration of limit orders waiting to be executed Order blocks are identified on a chart by observing previous price action and looking for areas where the price experienced significant movement or sudden changes in direction .This indicator does that for you by using very complicated codes and helps you to take the best areas To buy and sell because it make marks at the best a

Direct Scalping shows the most SUPER SUPER SUPER EARLY opportunity to scalp the market. Do entry as early as possible, as soon as the first sign appears.
It plays sound alert so that you can wait the moment while doing something else.
Remember to cut loss below the '' area. Yes, it is not stop loss but cut loss (exit on candle close). Made for M1 timeframe, but higher is good too.
My new favorite setup: M3 using 8 indicators with different parameters: 11, 18, 25, 32, 39, 46, 53, and 60.
Combin

Smart Risk Manager Dashboard is a MetaTrader 5 indicator designed to assist traders with structured risk control and real-time account monitoring.
It provides a visual interface for managing position size, tracking losses and gains, and setting custom trading limits. Key Features SL/TP Risk Calculator
Displays estimated risk and reward directly on the chart using adjustable horizontal lines. Live Dashboard with Metrics
Shows equity, balance, daily gain/loss, trade count, and other key values i

AstroCycles: Advanced Financial Astronomy Indicator Overview AstroCycles is a sophisticated technical analysis tool developed for the MetaTrader 5 (MQL5) platform. It bridges the gap between orbital mechanics and financial market analysis by calculating precise astronomical cycles and visualizing them directly on your trading chart. Unlike standard indicators that rely on past price data, AstroMaster utilizes high-precision astronomical algorithms (Keplerian Elements and Brown’s Lunar Theory)
FREE
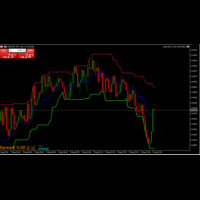
The Donchian Channel Indicator I created is a powerful tool for analyzing price trends and volatility. By plotting the highest high and lowest low over a specified period, it helps identify potential breakout opportunities and trend reversals. This indicator is valuable for traders seeking to understand market dynamics and make informed decisions based on price movements. Its simplicity and effectiveness make it an essential addition to any trading strategy.
FREE

Regime Radar — Market Regimes + Bias Stops (MT5) Regime Radar shows the current market regime — Range, Weak Trend, Strong Trend, or Shock — and draws ATR-based stop lines on the chart. It also provides a compact panel with regime, direction, confidence and optional RSI/Bollinger suggestions. This is an analysis tool; it does not provide trading signals and does not guarantee any profit. Main functions Regime detection in four states (Range, Weak Trend, Strong Trend, Shock). Bias indicator with
FREE
AI Volatility Map The AI Volatility Map is a professional indicator designed to analyze market activity by measuring spread and tick velocity. It provides traders with a clear view of market energy levels, helping to identify periods of high volatility, low activity, or sudden changes in momentum. This indicator is especially useful for spotting potential breakouts, trend continuations, or dead market conditions. Key Features: Volatility Score (Blue Line): Represents the normalized market volat
FREE

G-Labs Market Maker Dashboard - Exclusive Seasonal Offer Elevate your trading with the original G-Labs Market Maker Dashboard, available for a limited time at just $70 USD. Ideal for starter traders, this dashboard has been enhanced with new features and now includes a comprehensive training video. This indicator is for people trading the market makers method and is the entry level dashboard for that strategy is available for both mt4 and mt5. its a market scanner in real time showing peak forma
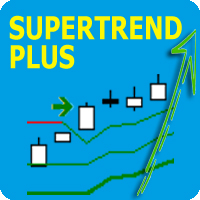
Super Trend Plus is a trading system that uses four Supertrends set with different parameters. The idea behind this system is that when three Supertrends move in the same direction, there is a strong trend confirmation, but entry occurs only when the fourth Supertrend also moves in the same direction as the other three. For example, the first Supertrend could be used with a volatility multiplier of 3 and a period of 10, the second Supertrend with a volatility multiplier of 3 and a period of 12,

O Touch VWAP é um indicador que permite calcular uma Média Ponderada por Volume (VWAP) apenas apertando a tecla 'w' no seu teclado e após clicando no candle do qual deseja realizar o calculo, clicando abaixo do candle é calculada a VWAP baseado na minima dos preços com o volume, clicando sobre o corpo do candle é calculado uma VWAP sobre o preço medio com o volume e clicando acima do candle é calculado uma VWAP baseado na máxima dos preços com o volume, voce tambem tem a opção de remover a VWAP
FREE

An “inside bar” pattern is a two-bar price action trading strategy in which the inside bar is smaller and within the high to low range of the prior bar, i.e. the high is lower than the previous bar’s high, and the low is higher than the previous bar’s low. Its relative position can be at the top, the middle or the bottom of the prior bar.
The prior bar, the bar before the inside bar, is often referred to as the “mother bar”. You will sometimes see an inside bar referred to as an “ib” and its m
FREE

The Simple ICT Concepts Indicator is a powerful tool designed to help traders apply the principles of the Inner Circle Trader (ICT) methodology. This indicator focuses on identifying key zones such as liquidity levels, support and resistance, and market structure, making it an invaluable asset for price action and smart money concept traders.
Key Features Market Structure: Market structure labels are constructed from price breaking a prior swing point. This allows a user to determine the curren

EMA Multi Timeframe (MTF) – MT5 Indicator Description: The EMA Multi Timeframe (MTF) indicator for MT5 allows you to display an Exponential Moving Average (EMA) from a higher (or lower) timeframe directly on your current chart. Example: You can see the Daily (D1) EMA 9 plotted directly on your H1 chart, or even on an M5 chart, helping you align your entries with higher timeframe trends without switching between charts. Key Features: Display EMA from selectable timeframes (M1, M5, M15, M30, H1
FREE

Ignition Candle Guard is a visual indicator for MetaTrader 5 designed to identify candles with excessive movement relative to the ATR. The indicator highlights candles whose range (High–Low) exceeds a configurable ATR multiple, helping traders avoid late entries after overextended price movements. This indicator does not generate buy or sell signals , does not repaint , and does not execute automated trades .
It works as a visual risk filter and can be used with any strategy, asset, or timeframe
FREE

If you love this indicator, please leave a positive rating and comment, it will be a source of motivation to help me create more products <3 How to use Slope Direction Line Uptrend: When the SDL line slopes up and turns from red to green, it shows that the price is trending up. This is also considered a buy signal. Downtrend: When the SDL line slopes down and turns from green to red, it shows that the price is trending down. This is also considered a sell signal. Sideways: When the SDL line mo
FREE

Highly configurable Macd indicator.
Features: Highly customizable alert functions (at levels, crosses, direction changes via email, push, sound, popup) Multi timeframe ability Color customization (at levels, crosses, direction changes) Linear interpolation and histogram mode options Works on strategy tester in multi timeframe mode (at weekend without ticks also) Adjustable Levels Parameters:
Macd Timeframe: You can set the lower/higher timeframes for Macd. Macd Bar Shift: you can set the o
FREE

This all-in-one indicator displays real-time market structure (internal & swing BOS / CHoCH), order blocks, premium & discount zones, equal highs & lows, and much more...allowing traders to automatically mark up their charts with widely used price action methodologies. Following the release of our Fair Value Gap script, we received numerous requests from our community to release more features in the same category. "Smart Money Concepts" (SMC) is a fairly new yet widely used term amongst price a

FVG Detector Multi-TF ( БЕЗ ФЛИКЕРА ) Автоматический индикатор для обнаружения и отображения ключевых ценовых уровней на основе концепций Smart Money Concept (SMC) . Индикатор идентифицирует Ценовые Разрывы Справедливой Стоимости (FVG) и Свинг High/Low одновременно на текущем графике и с нескольких старших таймфреймов. Особенности и преимущества 1. Усовершенствованный Анти-Фликер В отличие от стандартных индикаторов, вызывающих мерцание при тиковых обновлениях, здесь реализована оптимизированна
FREE

BreakHarmony Multi-Timeframe Breakout Indicator for MT5
The BreakHarmony Multi-Timeframe Breakout Indicator for MT5 is a highly advanced tool providing information on breakout points across different timeframes, aiding traders in decision-making and understanding market movements. [ Features and Manual | MT4 version | All Products ] The indicator tracks breakout points on price charts across 6 timeframes. Breakout prices are indicated with the closing price of the correspondi
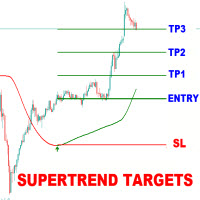
Supertrend Targets Signal is a powerful trend-following and breakout confirmation indicator designed to help traders identify high-probability entry points , visualize dynamic target zones , and receive clean, reliable signals across various market conditions. The core trend logic is built on a custom Supertrend that uses an ATR-based band structure with long smoothing chains—first through a WMA, then an EMA—allowing the trend line to respond to major shifts while ignoring noise. A key addition

The Stochastic Oscillator is one of the main indicators used in the analysis of financial assets. It is one of the highlights in the study of price movements and can be an important indicator of changing trends in the capital market. Stochastic is an oscillator used to identify when an asset is overbought or oversold. It consists of two lines: %K, which is calculated from the highs and lows of a period, and %D, which is a moving average of %K. Our version contains color filling, which facilitate
FREE

Highly configurable Williams %R indicator. Features: Highly customizable alert functions (at levels, crosses, direction changes via email, push, sound, popup) Multi timeframe ability Color customization (at levels, crosses, direction changes) Linear interpolation and histogram mode options Works on strategy tester in multi timeframe mode (at weekend without ticks also) Adjustable Levels Parameters:
Williams %R Timeframe: You can set the current or a higher timeframes for Williams %R. Williams
FREE

PREDATOR PULSE AI TRADER - ATHENA Quantum Neural Trading System Professional-Grade Institutional Trading Indicator** Overview
This advanced neural network trading system is designed to provide both institutional and retail traders with equal market insight. ATHENA combines deep institutional-level pattern recognition with proven traditional trading strategies, offering a comprehensive two-dimensional market view: standard technical analysis and advanced microanalysis powered by deep learning

super trend version is to help you to have real time view of market move it will help you to get a live view of current market buy signal line and arrow to help you understand batter the direction sell signal line and arrow to help you understand batter the direction trade what you see not what you think this is an simple and best trading tool for our traders of any market crypto gold
FREE

Market Heartbeat is in your hand! *** Contact me to send you " Trend Finder indicator " free and add you in "Market Heartbeats group" for sharing or seeing experiences with other users. Introduction The Market Heartbeat indicator with a special enhanced algorithm (volume, money flow, cycle of market and a secret value) is a very repetitive trend finder with a high success rate . Interestingly, this Winner indicator indicates that the trend has changed its direction or the end of a tre

This indicator has been developed to identify and display these trends quickly and easily, allowing you to see instantly, those currency pairs which are trending, and those which are not – and in all timeframes, with just one click. The 28 currency pairs are displayed as a fan as they sweep from strong to weak and back again, and this is why we call it the ‘currency array’. All 28 pairs are arrayed before you, giving an instant visual description of those pairs that are trending strongly, those

The indicator displays volume clusters or volume profiles to choose from. For trading symbols which contain the tape of deals, the indicator can perform calculations based on the tape of deals.
Input variables
StepPoint - cluster step in points, if the value is zero, the step is assigned automatically. HistoryTicks - size of tick history (for VolumeType in the mode TimeAndSales). AssociatedTimeframe - binding the indicator to the specified timeframe of the chart, if the value is equal to Cu

Smart Trend pro New - Advanced Trend Indicator with Interactive GUI Professional trend-following indicator with comprehensive visualization and control panel Key Features: Advanced Trend Detection Reliable Half Trend algorithm for precise trend identification Color-coded trend lines (Blue for bullish, Orange for bearish) Customizable amplitude parameter for different trading styles Interactive GUI Panel Real-time market strength visualization (Bulls vs Bears) Current signal display (Buy/Se
FREE

Ritz Smart FIBOPIVOT Optimus Pro Advanced Multi-Timeframe Fibonacci Trading System SMART PREDICTION & ACCURATE FORECAST Revolutionary Fibonacci Pivot Technology combines traditional pivot points with advanced Fibonacci extensions, creating a powerful predictive tool for professional traders.
Our algorithm intelligently detects significant price levels across multiple timeframes, delivering laser-accurate support and resistance zones before the market moves . INTELLIGENT VOLUME-VALIDATED SIGNALS
FREE

Market Sessionsync** is a cutting-edge trading session indicator designed to enhance your trading experience by visually breaking down the market's daily rhythm. With a compact window overlaid on your chart, this indicator provides a split-second understanding of the current trading session through: Basic setup: Set Difference between your local time and your broker time , set DST(Daylight Saving Time) ON or OFF , set timescale sync you want to use (Local, Broker, CET) - A vertical time marker
FREE

Introduction to Fractal Moving Average Fractal Moving Average indicator was designed as part of Fractal Pattern Scanner. Inside Fractal Pattern Scanner, Fractal Moving Average Indicator was implemented as multiple of chart objects. With over thousands of chart object, we find that it was not the best and efficient ways to operate the indicator. It was computationally too heavy for the indicator. Hence, we decide to implement the indicator version of Fractal Moving Average indicator to benefit ou
FREE
学习如何在MetaTrader AppStore上购买EA交易,MetaTrader平台的应用程序商店。
MQL5.community支付系统支持通过PayPay、银行卡和热门付款系统进行交易。为更好的客户体验我们强烈建议您在购买前测试EA交易。
您错过了交易机会:
- 免费交易应用程序
- 8,000+信号可供复制
- 探索金融市场的经济新闻
注册
登录