Conheça o Mercado MQL5 no YouTube, assista aos vídeos tutoriais
Como comprar um robô de negociação ou indicador?
Execute seu EA na
hospedagem virtual
hospedagem virtual
Teste indicadores/robôs de negociação antes de comprá-los
Quer ganhar dinheiro no Mercado?
Como apresentar um produto para o consumidor final?
Indicadores Técnicos para MetaTrader 5 - 23

Pivot Points Classic – L’indicatore essenziale per ogni trader tecnico Questo indicatore disegna automaticamente i livelli di Pivot Point più utilizzati dai trader professionisti, con supporto completo a 4 metodi di calcolo: Metodi supportati :
• Traditional
• Fibonacci
• Woodie
• Camarilla Caratteristiche principali :
Calcolo su timeframe superiore (multi-timeframe)
Visualizzazione chiara dei livelli P, R1, R2, R3, S1, S2, S3
Etichette dinamiche con nome e valore del livello
Colori per
FREE

SizeInPips Indicator – Visualize Candle Size with Ease!
Unlock the power of price action analysis with the SizeInPips Indicator ! This simple yet powerful tool is designed for traders who want to quickly measure and visualize the size of each candle (bar) in pips, helping you make informed trading decisions with confidence. Whether you're a beginner or an experienced trader, SizeInPips is the perfect addition to your MetaTrader 5 toolkit.
What Does It Do? The SizeInPips Indicator calculates
FREE

BlueBoat – Prime Cycle é um indicador técnico para MetaTrader 5 que analisa e visualiza ciclos de mercado com base no modelo de ciclos FIMATHE (Marcello Ferreira) . O indicador identifica e marca estruturas de ciclo históricas e atuais, como CA, C1, C2, C3 , permitindo ao trader compreender a dinâmica estrutural do preço ao longo do tempo. O indicador combina análise histórica (backtest) com marcação em tempo real , oferecendo uma visão clara tanto dos ciclos passados quanto do ciclo ativo no gr
FREE
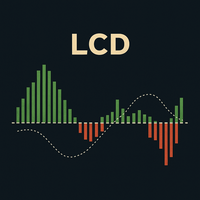
LCD Laguerre Convergence Divergence: Uma Melhoria Avançada do MACD Clássico O LCD Laguerre Convergence Divergence é um indicador técnico avançado, projetado para aprimorar o MACD clássico, oferecendo uma detecção de momentum mais rápida, sensível e adaptável. Sua principal vantagem é o uso dos filtros de Laguerre , que reagem às mudanças de preço com maior precisão do que as médias móveis tradicionais. Vantagens Chave Maior Sensibilidade e Menor Atraso: Os filtros de Laguerre geram sinais de ent
FREE

Lot Size Calculator - Smart Risk Management Tool
The Lot Size Calculator is a simple but powerful MetaTrader indicator that helps traders manage risk with precision. Instead of guessing your position size, this tool instantly calculates the exact lot size you need based on your account equity, chosen risk percentage, and reward ratio (1:1, 1:2, etc.).
Features:
Input your account equity and risk % per trade Supports both long (buy) and short (sell) trades Automatically adjusts for diffe
FREE

Quantas vezes você procurou por um PIVOT que funcionasse em uma vela específica todo dia?
Muitos traders gostam de estimar a direção da tendência do dia com base em um horário específico de todos os dias, como 30 minutos após a abertura do mercado, ou às 12h, e assim por diante.
Esse indicador permite que você especifique um determinado horário (hora e minuto) e traça um pivô a partir desse horário até o dia seguinte, no mesmo horário. Ele mostra cinco linhas com base nesse candle/horário esp
FREE

Introducing the South African Sniper Indicator
Created by a dedicated team of South African traders with years of profitable experience in the financial markets, the South African Sniper Indicator is designed to give traders a sharp edge — combining simplicity, precision, and power in one tool.
This is a plug-and-play indicator for MT5, built to deliver accurate BUY and SELL (Sniper Entry) signals — complete with target levels and automated trailing stops. Whether you trade forex, indice

## ONLY GOLD
## Тiльки Золото
## **Mercaria Professional Trading Zones - Complete Guide** ## **Mercaria Professional Trading Zones - Повний посібник**
### **How Mercaria Zones Work / Як працюють зони Mercaria**
**English:** Mercaria Zones is an advanced trading indicator that identifies high-probability support and resistance areas using ZigZag extremes combined with mathematical zone calculations. The indicator works on multiple timeframes simultaneously, providing a comprehensive view

"TPA Sessions" indicator is a very important tool to complement "TPA True Price Action" indicator . Did you ever wonder, why many times the price on your chart suddently turns on a position you can't explain? A position, where apparently no support or resistance level, or a pivot point, or a fibonacci level is to identify? Attention!!! The first run of the TPA Session indicator must be in the open market for the lines to be drawn correctly.
Please visit our blog to study actual trades with

Volume Horizon is a horizontal volume indicator that allows you to observe the density of market participants' volumes across various price and time intervals. Volume histograms can be constructed based on ascending or descending market waves, as well as individual bars. This tool enables more precise determination of entry or exit points, relying on levels of maximum volumes or volume-weighted average prices (VWAP).
What makes Volume Horizon unique? 1. Segmentation into ascending and descendi

Highest High and Lowest Low (HH_LL) Indicator Description: The HH_LL Indicator is a trading tool designed to help traders identify key market points by automatically drawing Higher High (HH) and Lower Low (LL) lines across multiple timeframes. This indicator allows traders to easily spot significant levels on the chart, facilitating more accurate trading decisions. Key Features: Multi-Timeframe Analysis: The indicator supports various timeframes, including M30, H1, and H4. This enables traders t
FREE

Introduction to Fibonacci Volatility Indicator Volatility indicator can help you to detect any statistical advantage for your trading. Especially, if you are trading with Price Action and Price Patterns, then we recommend to use the Volatility indicator together with your strategy. Especically, Fibonacci Volatility indicator combines the market volatiltiy with Fibonacci Analysis to provide you more advanced volatiltiy indicator. Main Features Fibonacci Volatility in Z score Configuration Mode Fi

The Smart Liquidity Profile is color-coded based on the importance of the traded activity at specific price levels, allowing traders to identify significant price levels such as support and resistance levels, supply and demand zones, liquidity gaps, consolidation zones, Buy-Side/Sell-Side Liquidity and so on. Smart Liquidity Profile allows users to choose from a number of different time periods including 'Auto,' 'Fixed Range,' 'Swing High,' 'Swing Low,' 'Session,' 'Day,' 'Week,' 'Month,' 'Quart
MACD MTF 1 – Multi-Timeframe MACD A professional MACD indicator supporting all timeframes!
Displays the histogram and signal line clearly in a separate window, helping you to: Identify current market momentum. Track market reversals easily. Choose optimal entry and exit points without switching timeframes. Adjustable Settings: Timeframe for any strategy. Fast and Slow Moving Averages. Signal line sensitivity. Perfect for all trading styles: scalping, daily, and long-term trading.
FREE

Magic History is a detailed trade visualization indicator designed to bring the full story of your trading activity directly onto the chart. If you’re a developer or trader who uses magic numbers, this is made for you. Smart pagination - never lose track of your trades again Pagination means dividing content into separate pages instead of showing everything all at once.
In the context of your Magic History indicator:
Pagination is a system that lets you view your trades in sections (pages) — fo
FREE

The DFG Chart Indicator displays the historical DFG levels used in the DFG dashboard. These levels are generated dynamically using moving averages and Fibonacci ratios. The Fibonacci Bands automatically adjust to reflect changes in the price range and trend direction. The indicator also features buttons for selecting chart symbol and timeframe, along with a wide range of customization options. Key Features Dynamic DFG Levels
Automatically calculated using moving averages and Fibonacci ratios. H
FREE

SMC Trend Momentum Signal Line
SMC Trend Momentum Signal Line is an MT5 indicator that draws a smoothed on-chart line and colors it in real time: lime for positive momentum, tomato for negative, derived from the “SMC Trend Momentum” subwindow oscillator. This gives you immediate momentum direction directly in the main chart. Note: You must purchase the “SMC Trend Momentum” to see the line. The SMC Trend Momentum Signal Line is and will remain free of charge for you. Key Features Colored On-Char
FREE

O principal objetivo do indicador é detectar e marcar no gráfico os seguintes sinais de negociação descritos em "Trading Chaos (2-nd edition)": Divergência nas barras de alta e baixa com angulação (incluindo o squat). Barras nas zonas em vermelho e verde de acordo com a cor do histograma Awesome Oscillator. Barras Squat no gráfico são independente da cor do histograma Awesome Oscillator. Níveis de fractais "importantes" em relação à "linha dos Dentes" do indicador Alligator. Desenha raios de ang

Hull Moving Average is more sensitive to the current price activity than a traditional Moving Average. It faster responds to trend change and more shows the price movement more accurately. This is a color version of the indicator. This indicator has been developed based in the original version created by Sergey <wizardserg@mail.ru>. Suitable for all timeframes.
Parameters Period - smoothing period, recommended values are 9 to 64. The larger the period, the softer the light. Method - smoothing m
FREE

The market is unfair if only because 10% of participants manage 90% of funds. An ordinary trader has slim changes to stand against these "vultures". This problem can be solved. You just need to be among these 10%, learn to predict their intentions and move with them. Volume is the only preemptive factor that faultlessly works on any timeframe and symbol. First, the volume appears and is accumulated, and only then the price moves. The price moves from one volume to another. Areas of volume accumu

Smart Risk Manager Dashboard is a MetaTrader 5 indicator designed to assist traders with structured risk control and real-time account monitoring.
It provides a visual interface for managing position size, tracking losses and gains, and setting custom trading limits. Key Features SL/TP Risk Calculator
Displays estimated risk and reward directly on the chart using adjustable horizontal lines. Live Dashboard with Metrics
Shows equity, balance, daily gain/loss, trade count, and other key values i

1. Introduction The Market Squeeze Momentum Indicator (SQZMOM_LB) is a powerful technical analysis tool designed to help traders identify periods of low market volatility (the "squeeze" phase) and predict the direction and strength of price momentum after the squeeze ends. This indicator combines the principles of Bollinger Bands and Keltner Channels to detect changes in market volatility, along with a momentum oscillator to measure buying/selling pressure. 2. Key Components of the Indicator The
FREE

Highly configurable Macd indicator.
Features: Highly customizable alert functions (at levels, crosses, direction changes via email, push, sound, popup) Multi timeframe ability Color customization (at levels, crosses, direction changes) Linear interpolation and histogram mode options Works on strategy tester in multi timeframe mode (at weekend without ticks also) Adjustable Levels Parameters:
Macd Timeframe: You can set the lower/higher timeframes for Macd. Macd Bar Shift: you can set the o
FREE

The Simple ICT Concepts Indicator is a powerful tool designed to help traders apply the principles of the Inner Circle Trader (ICT) methodology. This indicator focuses on identifying key zones such as liquidity levels, support and resistance, and market structure, making it an invaluable asset for price action and smart money concept traders.
Key Features Market Structure: Market structure labels are constructed from price breaking a prior swing point. This allows a user to determine the curren

The Forex Master Pattern is an alternative form of technical analysis that provides a framework which will help you to find and follow the hidden price pattern that reveals the true intentions of financial markets. This algorithm here does a good job detecting the Phase 1 of the Forex Master Pattern cycle, which is the contraction point (or Value).
On Phase 2 we get higher timeframe activation (also called Expansion), which is where price oscillates above and below the average price defined

AT Break - Smart Breakout Points Indicator General Description The AT Break indicator is an advanced technical analysis tool for the MetaTrader 5 platform, designed based on detecting breakouts of resistance and support levels. This indicator uses sophisticated algorithms to identify potential entry and exit points and displays them visually on the chart. Main Settings Parameter Description Range/Options Default Price Type Determines the price type used for calculations Close, Open, High, Lo

Introduction Harmonic Patterns are best used to predict potential turning point. Traditionally, Harmonic Pattern was identified manually connecting peaks and troughs points in the chart. Manual harmonic pattern detection is painfully tedious and not suitable for everyone. You are often exposed under subjective pattern identification with manual pattern detection. To avoid these limitations, Harmonic Pattern Plus was designed to automate your harmonic pattern detection process. The functionality

Raymond Cloudy Day Indicator for MT5 – Pivot-Based Reversal and Trend Levels Raymond Cloudy Day Indicator is a pivot-based level indicator for MetaTrader 5 (MT5). It was developed by Ngo The Hung based on Raymond’s original idea and is designed to give a structured view of potential reversal zones, trend extensions and support/resistance levels directly on the chart. The default settings are optimised for XAUUSD on the H1 timeframe, but the indicator can be tested and adjusted for other symbols
FREE
O Indicador Flower é uma ferramenta de análise técnica utilizada principalmente para identificar tendências e auxiliar em estratégias de scalping ou negociação intradiária.
O Indicador Flower é um indicador de tendência de sinal baseado em análises técnicas e de dinâmica de preços. Sinaliza visualmente tendências usando flores coloridas - as flores azuis indicam uma tendência de alta, enquanto as flores vermelhas indicam uma tendência de baixa
Cada nível pode funcionar como suporte e resistên
FREE

BreakHarmony Multi-Timeframe Breakout Indicator for MT5
The BreakHarmony Multi-Timeframe Breakout Indicator for MT5 is a highly advanced tool providing information on breakout points across different timeframes, aiding traders in decision-making and understanding market movements. [ Features and Manual | MT4 version | All Products ] The indicator tracks breakout points on price charts across 6 timeframes. Breakout prices are indicated with the closing price of the correspondi
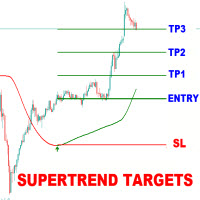
Supertrend Targets Signal is a powerful trend-following and breakout confirmation indicator designed to help traders identify high-probability entry points , visualize dynamic target zones , and receive clean, reliable signals across various market conditions. The core trend logic is built on a custom Supertrend that uses an ATR-based band structure with long smoothing chains—first through a WMA, then an EMA—allowing the trend line to respond to major shifts while ignoring noise. A key addition

O indicador analisa o volume a partir de qualquer ponto e calcula os níveis de exaustão do mercado para esse volume. Linhas principais do Meravith: Linha de exaustão de volume altista – serve como alvo. Linha de exaustão de volume baixista – serve como alvo. Linha de tendência – indica a tendência do mercado. A cor muda conforme o mercado esteja em alta ou em baixa e serve como suporte de tendência. Como usar: dê um clique duplo na linha vertical roxa e mova-a para a posição desejada. Você pode

The Quantum VPOC indicator has been developed to expand the two dimensional study of volume and price, to a three dimensional one which embraces time. The volume/price/time relationship then provides real insight to the inner workings of the market and the heartbeat of sentiment and risk which drives the price action accordingly. The Quantum VPOC indicator displays several key pieces of information on the chart as follows: Volume Profile - this appears as a histogram of volume on the vertical pr

The indicator displays volume clusters or volume profiles to choose from. For trading symbols which contain the tape of deals, the indicator can perform calculations based on the tape of deals.
Input variables
StepPoint - cluster step in points, if the value is zero, the step is assigned automatically. HistoryTicks - size of tick history (for VolumeType in the mode TimeAndSales). AssociatedTimeframe - binding the indicator to the specified timeframe of the chart, if the value is equal to Cu

Highly configurable Bollinger Bands indicator. Features: Highly customizable alert functions (at levels, crosses, direction changes via email, push, sound, popup) Multi timeframe ability Color customization (at levels, crosses, direction changes) Linear interpolation option Works on strategy tester in multi timeframe mode (at weekend without ticks also) Parameters:
Bollinger Bands Timeframe: You can set the lower/higher timeframes for Bollinger Bands. Bollinger Bands Bar Shift: Y ou can set th
FREE
Range Identifier v3 User Guide 1. Overview The Range Identifier v3 is a technical analysis tool designed to automatically detect and visualize periods of market consolidation, commonly known as ranges. this MQL5 version brings the same powerful logic to the MetaTrader 5 platform. The primary function of this indicator is to draw a channel around recent highs and lows during periods of low volatility. When the price breaks out of this channel, the indicator provides an alert, helping traders iden
FREE

Níveis lendários de William Gann em um indicador MT5 totalmente automatizado. O GANN Master identifica zonas-chave onde o preço tem maior probabilidade de reverter ou continuar sua tendência, com base em dados diários, semanais e mensais. Recursos principais: Botões de período com um clique: clique em Daily, Weekly ou Monthly para traçar instantaneamente as zonas do dia, da semana ou do mês atuais Modos Automático e Manual
• Automático: o GANN Master calcula todos os níveis para você, sem neces

The Supertrend etradro indicator is volatility based and is more of a trend following indicator in function. The ATR indicator, which is integrated into the calculation of the super trend, also calculates course gaps (gaps) and does not overlook them. This allows more accurate values to be calculated. When measuring volatility, the mean value of the current price serves as the basis. Since the Supertrend indicator features sliding stop and reversal lines, it is quite similar in function to the P
FREE

STRAT Price Action Scanner – See the setup, size the risk, place the trade. Important
To place trades directly from the Trade Assistant panel, you must also install the STRAT Price Action Trade Manager EA (check the comment section) on the same terminal. The indicator sends the trade instructions; the EA is the component that actually places and manages the orders. Installation Instruction (please read) Guide to the STRAT Trading Strategy Why STRAT? Most price action trading is
FREE

Este indicador é baseado no indicador Parabolic SAR. Ele ajuda o usuário a identificar oportunidades de compra ou venda. Vem com um alerta que soará sempre que um novo sinal aparece. Ele também possui uma facilidade do e-mail. O seu endereço de e-mail e configurações do servidor SMTP deve ser especificados na janela de configurações da guia "caixa de correio" no seu MetaTrader 5. Seta azul para cima = Compra. Seta vermelha para baixo = Venda. Linha = trailing stop. Você pode usar um dos meus pro
FREE

1. Introduction The CM_Ultimate_RSI_MTF is a powerful and versatile custom indicator for MetaTrader 5, designed to enhance your Relative Strength Index (RSI) analysis. It provides multi-timeframe (MTF) capabilities, visual signals, and customizable alerts, making it an invaluable tool for traders seeking to identify overbought/oversold conditions, trend strength, and potential entry/exit points across various timeframes. 2. Key Features Multi-Timeframe (MTF) Analysis: Allows you to view RSI from
FREE

There is a science, named Quantitative Finance, that allows to study the financial derivative pricing models using the methods of theoretical and mathematical physics.
Lately I came across a paper that describes a new indicator for technical analysis that combines ideas from quantum physics and brings them to finance. I got interested in it and decided I would teach how to implement indicators based on a scientific papers in MQL5.
The original Moving Mini-Max paper [2] is written by Z.K. Silaga
FREE

RITZ SMART TREND ADAPTIVE FINDER Precision Trend Intelligence. Adaptive. Insightful. Real-Time. Ritz Smart Trend Adaptive Finder is an advanced market intelligence indicator engineered to detect and adapt to evolving market structures with dynamic precision.
It automatically calibrates its analytical period based on real-time volatility, price momentum, and correlation strength — delivering true adaptive trend detection rather than static or lagging signals. By combining Pearson correlation , sl
FREE

Key Price Levels Indicator Indicator that shows the highs and lows for the significant price levels for past periods that could be potentially considered as reaction levels. The indicator displays the following price levels: Yesterday high and low The day before yesterday high and low Two days back high and low Last week high and low Last month high and low Last three month high and low (Quarter) Last year high and low
FREE

USD STRENGHT VERSUS MARKET USD (DXY) Versus Market Panel is a professional visual indicator designed to analyze US Dollar strength and pressure against major trading symbols in real time. The indicator compares USD performance (based on DXY logic or internal strength calculation) versus selected symbols, allowing traders to quickly identify dominant currency flow, relative strength, and market bias from a single panel view. Built with a clean, lightweight, and non-intrusive panel , this tool hel
FREE
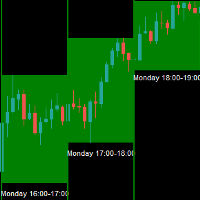
The Entry Signal Analyzer is a sophisticated MetaTrader 5 indicator designed to analyze and identify optimal trading hours based on price movement patterns. The indicator analyzes gold currency only a updated version is currently being developed for other symbol the indicator in the strategy tester is non-functional works on the real chart Statistical Analysis: Analyzes historical price movements for each hour of the trading day Tracks success rates and consistency of movements Calculates poi
FREE
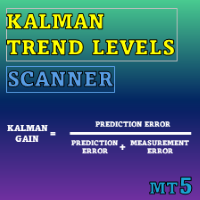
Special offer : ALL TOOLS , just $35 each! New tools will be $30 for the first week or the first 3 purchases ! Trading Tools Channel on MQL5 : Join my MQL5 channel to update the latest news from me Kalman Trend Levels é um indicador avançado de acompanhamento de tendências que utiliza a tecnologia de ponta do filtro de Kalman para fornecer aos traders sinais analíticos poderosos. Projetado para precisão e adaptabilidade, esta ferramenta não apenas identifica zonas críticas de supor

Ritz Smart OHLC Candle Ritz Smart OHLC Candle is an advanced price-action candle indicator that enhances standard OHLC candles with smart momentum analysis, volatility validation, and directional bias filtering — all displayed directly through candle colors. This indicator is designed for traders who want clean charts, early momentum detection, and reduced false signals, without adding extra lines or panels. Main Features Smart OHLC Strength Analysis, Evaluates candle strength using OHLC prog
FREE
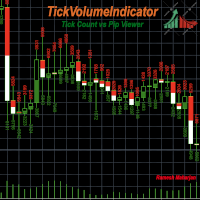
Existem vários indicadores e métodos para identificar tendências num gráfico. O TickVolumeIndicator é um deles. Ajuda a identificar e prever tendências futuras, exibindo tendências passadas utilizando dados de ticks.
O TickVolumeIndicator é um indicador que desenha cores em candles visíveis no gráfico utilizando os volumes dos ticks. Os volumes de ticks são valores de compra e venda. Os utilizadores podem escolher entre as contagens de compra e venda do tick ou as alterações de pips para o per
FREE

Check out my TRADE PLANNER MT5 – strongly recommended to anticipate account scenarios before risking any money. This is the moving average convergence divergence (MACD) indicator based on Heikin Ashi calculations. Here you find multi-colored histogram which corresponds to bull (green) / bear(red) trend. Dark and light colors describes weakness/strenght of price trend in time. Also you can switch calculations between normal and Heikin Ashi price type.
Note: Buffers numbers for iCustom: 0-MACD,
FREE
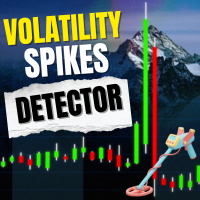
Volatility Monitor – Indicador de Detecção de Picos em Tempo Real Visão Geral Volatility Monitor é um indicador MT5 leve e profissional projetado para monitorar movimentos bruscos de preços e alertar os traders em tempo real. Seja Forex, Ouro, pares JPY ou Criptomoedas, fornece sinais claros de volatilidade via ATR automático ou limites manuais de pips. Principais Recursos Detecção de volatilidade em tempo real. Modos flexíveis (ATR ou manual). Alertas progressivos (som, pop-up, push). Marcadore
FREE
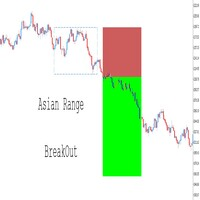
Totalmente personalizável – Adapte o indicador ao seu estilo de trading, modificando parâmetros como tempo do intervalo, cores, estilos de linha e configurações de risco-retorno. Visualização dos níveis de negociação – Desenha automaticamente o preço de entrada, stop loss (SL) e take profit (TP) com base nas condições de rompimento. Integração perfeita com Expert Advisors (EAs) – Tenha controle total sobre suas estratégias automatizadas, adicionando confirmações extras como RSI, Médias Móv
FREE

Simple Vwap with the daily, weekly and monthly
VWAP is the abbreviation for volume-weighted average price , which is a technical analysis tool that shows the ratio of an asset's price to its total trade volume. It provides traders and investors with a measure of the average price at which a stock is traded over a given period of time.
How it's used Identify entry and exit points: Traders can use VWAP to determine when to buy or sell an asset. Understand price trends : Traders can use V
FREE

The indicator displays divergence for any custom indicator. You only need to specify the indicator name; DeMarker is used by default. Additionally, you can opt for smoothing of values of the selected indicator and set levels whose crossing will trigger an alert. The custom indicator must be compiled (a file with ex5 extension) and located under MQL5/Indicators of the client terminal or in one of the subdirectories. It uses zero bar of the selected indicator with default parameters.
Input parame
FREE
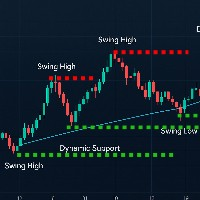
A professional swing point detection indicator that identifies key highs and lows with precision. Features include: Smart Detection : Identifies swing highs/lows based on customizable left/right bar analysis Visual Alerts : Clear arrows and labels (optional) mark swing points Dynamic Lines : Draws support/resistance lines that disappear when price touches them (toggle on/off) Real-Time Alerts : Sound and popup notifications for new swings Non-Intrusive : Preserves all manual chart drawings Perfe
FREE

My other indicators
https://www.mql5.com/en/market/product/156702 https://www.mql5.com/en/market/product/153968 (FREE) https://www.mql5.com/en/market/product/153960 (FREE)
️ Multi-Timeframe Supply & Demand Zones with Fair Value Gaps (FVG) MyFXRoom Supply & Demand Zones with FVG is a multi-timeframe indicator that automatically detects and draws Supply and Demand zones directly on your chart — complete with Fair Value Gap (FVG) validation, gap-aware zone sizing , and smart clean-up logic to
FREE

Este indicador foi desenvolvido para auxiliar na análise de um ativo em múltiplos tempos gráficos. Nas configurações do indicador, o usuário escolhe a cor, largura e estilo das linhas horizontais para cada tempo gráfico. Dessa forma, as linhas horizontais automaticamente terão a configuração definida para o tempo gráfico ao serem adicionadas no gráfico.
O MTF Lines também permite o controle de visibilidade de outros objetos como retângulos, linhas de tendência e textos.
Este é mais um produto
FREE

Volume Weighted Average Price (VWAP) is a trading benchmark commonly used by Big Players that gives the average price a Symbol has traded throughout the day. It is based on both Volume and price. Additionally we put in this indicator the MVWAP (Moving Volume Weighted Average Price). For those who do not know the usage and the importance od this indicator I recommend a great article about this subject at Investopedia ( https://www.investopedia.com/articles/trading/11/trading-with-vwap-mvwap.asp
FREE
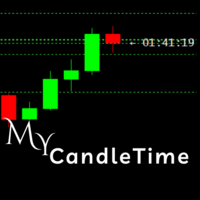
My CandleTime
This indicator displays the remaining time until the current candle closes directly on the chart.
It is designed to help traders keep track of candle formation without constantly checking the platform’s status bar. Main Features Shows countdown timer for the active candle. Works on any symbol and timeframe. Lightweight, does not overload the terminal. Adjustable font size and name. How to Use
Simply attach the indicator to a chart.
You can customize font size, color, and font to
FREE

The Volume+ and VSA Signals indicator for MT5 is based on the Volume Spread Analysis (VSA) methodology to provide the signals. The signals are displayed at closing of bars on the main window or subwindow in the form of symbols. The symbols are not repainting. The indicator produces a signal on an individual bar and this signal is not buy or sell signal. When a minor trend goes in the opposite direction of a major trend, there are sequences of major trend-following signals that give a higher pro

This is an extremely clean, efficient, and well-designed CBDR engine.
Calculates ICT’s Central Bank Dealers Range (CBDR) Using only candle bodies — NOT wicks (open–close structure).
For a defined time window (e.g., 00:00–05:00 New York).
For each past day and also for today in real time. Draws the following on chart: A rectangle showing the entire CBDR body range The CBDR High line (body top) The CBDR Low line (body bottom) An optional midline A pip label showing total CBDR size Optional extens
FREE

HTF Vision - Higher Timeframe Candle Display Free now, celebrating release of Live Chart Viewer utility https://www.mql5.com/en/market/product/158488
HTF Vision provides traders with an intuitive way to visualize higher timeframe price action directly on their current chart. This powerful indicator overlays candlestick data from selected higher timeframes (H1, H4, or Daily) as customizable boxes, giving you instant context of larger market movements without switching charts. Key Features: Mult
FREE
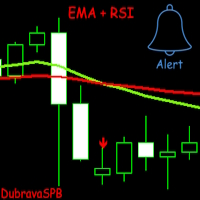
Introducing EMA + RSI – A Trading Indicator Combining Exponential Moving Average (EMA) and Relative Strength Index (RSI) Analysis. The indicator signals trade entries with arrows on the chart when two EMAs cross and the RSI meets the specified conditions.
It is initially optimized for the GBPUSD currency pair on the 1H timeframe, but users can customize it to fit their strategy. Key Features: Flexible settings: Users can adjust EMA length, choose the price for calculation, and configure RSI para
FREE

Modificação multimoeda e multitimeframe do indicador Commodity Channel Index (CCI). Você pode especificar quaisquer moedas e prazos desejados nos parâmetros. Além disso, o painel pode enviar notificações ao cruzar níveis de sobrecompra e sobrevenda. Ao clicar em uma célula com ponto final, este símbolo e ponto final serão abertos. Este é o scanner MTF.
A chave para ocultar o painel do gráfico é “D” por padrão.
Parâmetros CCI Period — período médio. CCI Applied price — tipo de preço. Clear t

VWAP (Volume Weighted Average Price) indicator with ±1σ and ±2σ bands calculated from real traded volume. The start and end times of the session are fully configurable, as well as the standard deviation levels and the number of bands displayed. It shows the day’s volume-weighted average price and helps traders identify value areas, price extremes, and intraday trading opportunities with precision.
FREE

Gina Dual TPO — Brief MQL5 indicator TPO + Volume profile overlaid on chart — fast, scalable, and beginner-friendly. Built for traders who read market structure by POC and Value Area. What it is An MQL5 indicator that overlays dual market profiles—Time-at-Price (TPO) and Volume-at-Price (VPO)—directly on your chart. It’s fast (pixel-based drawing), scalable, and beginner-friendly. Who it’s for Intraday and swing traders who read market structure via POC (Point of Control) and Value Area to spot
FREE

Fair Value Gaps (FVG) and Liquidity Voids are price ranges you can exploit for better entries and exits on your trades. They're similar concepts, so let's look at them from the top and break it down. Think of FVG and Liquidity voids as soft-spots in the market. They are paths of least resistance. That doesn't mean price will go through them, but price could go through them more easily.
To find and locate it is easy but tidiest to repeat the same thing all over again. This helps to boost your t
FREE

Welcome to Ultimate MA MTF , a multi-functional Moving Average (MA) indicator converted from the original TradingView version by ChrisMoody and upgraded with many powerful features. This is not just a typical MA line. It is a comprehensive technical analysis tool designed to provide traders with deep insights into trends, volatility, and potential trading signals, all within a single indicator. Key Features 8 Moving Average Types: Full support for the most popular MA types (SMA, EMA, WMA, HullMA
FREE

Bienvenido al futuro del trading con KMeans Price Zones Detector, un innovador indicador de MetaTrader que aprovecha el poder del aprendizaje automático para identificar zonas clave de precios. Esta herramienta utiliza el algoritmo de agrupamiento KMeans para detectar dinámicamente los centroides en los datos de precios, destacando áreas donde es más probable que los precios encuentren soporte, resistencia o consolidación. Algoritmo innovador KMeans KMeans Price Zones Detector se destaca por su
FREE

TransitX1 indicator is very useful, with unlimited signals and works on all the timeframes and all the piers. TransitX1 draws two trend lines very short trendlines (+/-20 bars) which can be considered as support and resistance. The support is in red trendline and the resistance is in green trendline. TransitX1 gives buying and selling signals, with only 3 being previous signals and the 4th one being the current signal. Buying signals are in green arrows and are always on the support trendline an
FREE
O mercado MetaTrader é um espaço, sem precedentes, para negociar robôs e indicadores técnicos.
Leia o artigo Manual do usuário da MQL5.community para saber mais sobre os serviços exclusivos que oferecemos aos traders: cópia de sinais de negociação, aplicativos personalizados desenvolvidos por freelances, pagamentos automáticos através de sistema de pagamento e a rede em nuvem MQL5.
Você está perdendo oportunidades de negociação:
- Aplicativos de negociação gratuitos
- 8 000+ sinais para cópia
- Notícias econômicas para análise dos mercados financeiros
Registro
Login
Se você não tem uma conta, por favor registre-se
Para login e uso do site MQL5.com, você deve ativar o uso de cookies.
Ative esta opção no seu navegador, caso contrário você não poderá fazer login.