TRIXs
- Indikatoren
- Version: 1.0

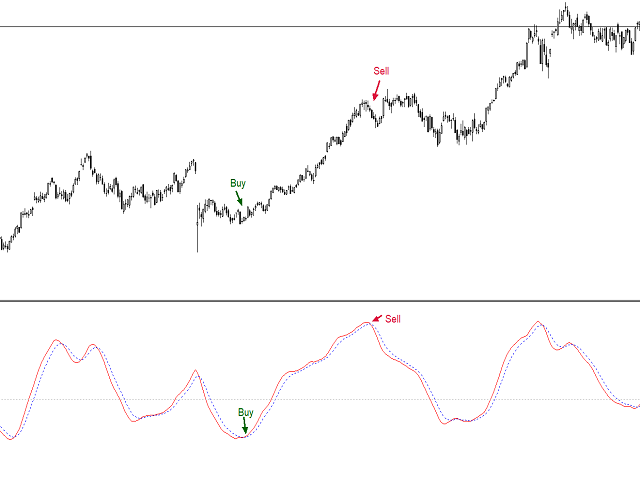
Der TRIXs-Indikator ist eine Kombination des TRIX-Indikators (Triple Exponential Moving Average) mit einem zusätzlichen SMA-Signal (Simple Moving Average). Er liefert Anzeichen für Trendkontinuität und den Beginn eines neuen Trends.
Die Ein- und Ausstiegspunkte der Operationen erfolgen, wenn sich die Kurven des Indikators kreuzen.
Die Leistung des Indikators ist besser, wenn er mit anderen Indikatoren kombiniert wird.


Excelente!!!