
使用 MQL5 经济日历进行交易(第三部分):添加货币、重要性和时间过滤器
引言
在本文中,我们将在前期关于MetaQuotes Language 5 (MQL5) 经济日历基础上,对其进行扩展。在之前的文章中,我们开发了一个新闻仪表板面板,用于实时显示经济事件。现在,我们将通过为货币、重要性和时间实现特定的过滤器来增强这个仪表板,从而使交易者能够只关注与其交易策略最相关的新闻事件。这些过滤器将提供一个针对市场驱动事件的精准视图,有助于简化决策过程并提高交易效率。我们将涵盖的主题包括:
通过这些新增功能,我们的仪表板将成为一个强大的工具,用于在 MQL5 环境中监控和筛选经济新闻,并根据交易者对及时、相关信息的需求进行定制。
理解经济日历中的过滤器类型
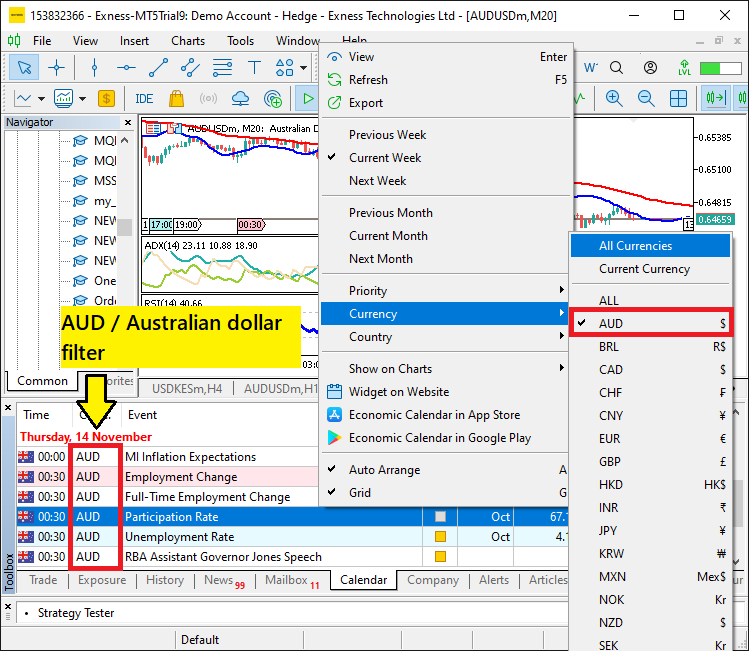
为了优化仪表板的功能,我们必须理解每种过滤器类型(货币、重要性和时间)的目的和优势。货币过滤器允许我们查看影响我们正在交易的货币的经济事件,从而更容易精确定位可能影响我们未平仓头寸的相关事件。此过滤器通过减少信息过载来简化仪表板,只关注我们交易投资组合中的货币。在交易终端 MetaTrader 5 中,我们可以通过将鼠标悬停在“日历”选项卡上,在内部右键单击,然后选择首选货币或国家/地区,来访问和筛选基于货币的新闻。图示如下:
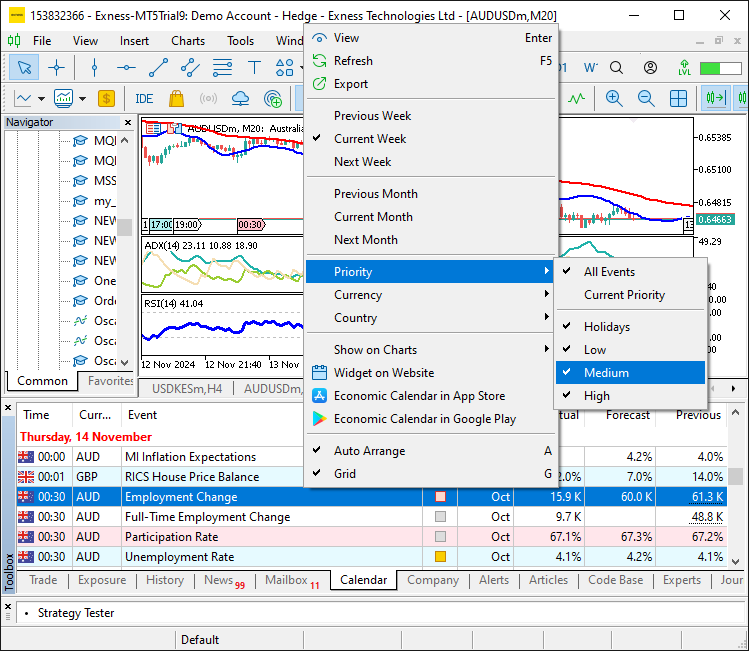
重要性过滤器根据事件的预期影响对其进行分类,通常定义为低、中或高重要性。高影响力事件,如央行公告或失业率数据,可能导致市场波动。通过基于重要性进行筛选,我们可以快速评估哪些事件可能对我们的交易决策产生最重大的影响,从而提高响应速度。要根据影响级别筛选新闻,您可以再次右键单击“日历”选项卡,然后根据优先级进行选择。图示如下:
最后,时间过滤器允许我们指定相关经济事件的时间范围,这对于在特定交易时段内进行交易或为即将到来的新闻做准备的交易者来说特别有用。使用此过滤器,我们可以看到在定义时间段内(例如下一小时、一天或一周)发生的事件,提供一个与我们交易策略和时间偏好相一致的时间线。总之,这些过滤器共同创造了一种可定制的体验,将经济新闻数据量身定制到个人交易需求,构成了一个响应迅速、高效的 MQL5 仪表板的骨干。
在 MQL5 中实现过滤器
为了在 MQL5 中实现过滤器,我们需要采取的第一步是在全局作用域中定义布尔变量。这些变量将控制货币、重要性和时间的过滤器是启用还是禁用。通过全局定义它们,我们将确保过滤器可以在整个代码中被访问和修改,为新闻仪表板的运行方式提供灵活性。这一步将为实现过滤器奠定基础,并允许我们根据我们的交易需求定制仪表板的功能。为实现这一点,我们使用如下代码。
//--- Define flags to enable/disable filters
bool enableCurrencyFilter = true;  // Set to 'true' to enable currency filter, 'false' to disable
bool enableImportanceFilter = true; // Set to 'true' to enable importance filter, 'false' to disable
bool enableTimeFilter = true; // Set to 'true' to enable time filter, 'false' to disable
在这里,我们定义了三个布尔变量,分别是 “enableCurrencyFilter”、“enableImportanceFilter” 和 “enableTimeFilter”,我们将用它们来控制货币、重要性和时间的相应过滤器是启用还是禁用。每个变量的默认值都设置为 “true”,这意味着默认情况下所有过滤器都将处于活动状态。通过将这些值更改为 “false”,我们可以禁用任何我们不希望使用的过滤器,从而让我们能够根据自己的交易偏好来定制新闻仪表板的功能。
从这里开始,在计算有效新闻事件的初始化代码中,我们将从货币过滤器开始。首先,我们需要定义希望应用过滤器的货币代码。因此,我们将按如下方式定义它们。
string curr_filter[] = {"AUD","CAD","CHF","EUR","GBP","JPY","NZD","USD"};
int news_filter_count = 0;
在这里,我们定义了 “curr_filter” <s0>字符串 数组,其中包含一个货币对列表——“AUD”、“CAD”、“CHF”、“EUR”、“GBP”、“JPY”、“NZD”和“USD”——我们希望用它来根据特定货币筛选新闻。这个数组将帮助我们缩小仪表板上显示的新闻事件范围,只关注那些与所选货币相关的事件。我们还定义了 “news_filter_count” 变量,用它来跟踪符合我们选定条件的已筛选新闻事件的数量,确保我们只显示最相关的信息。然后我们就可以跳转到如下的过滤器代码。
//--- Check if the event’s currency matches any in the filter array (if the filter is enabled)
bool currencyMatch = false;
if (enableCurrencyFilter) {
   for (int j = 0; j < ArraySize(curr_filter); j++) {
      if (country.currency == curr_filter[j]) {
         currencyMatch = true;
         break;
      }
   }

   //--- If no match found, skip to the next event
   if (!currencyMatch) {
      continue;
   }
}
在这里,我们检查事件的货币是否与 “curr_filter” 数组中的任何货币匹配,但前提是货币过滤器已启用,这由 “enableCurrencyFilter” 标志指示。如果过滤器已启用,我们使用for循环遍历 “curr_filter” 数组,并在每次迭代中将事件的货币与过滤器中的货币进行比较。
如果找到匹配项,我们将 “currencyMatch” 标志设置为 true 并用 break 跳出循环。如果未找到匹配项(即 “currencyMatch” 仍为 false),我们使用 continue 语句跳过当前事件并继续处理下一个事件,确保只处理相关事件。然后,我们使用相同的逻辑,根据重要性来筛选事件。
//--- Check importance level if importance filter is enabled
bool importanceMatch = false;
if (enableImportanceFilter) {
   for (int k = 0; k < ArraySize(allowed_importance_levels); k++) {
      if (event.importance == allowed_importance_levels[k]) {
         importanceMatch = true;
         break;
      }
   }

   //--- If importance does not match the filter criteria, skip the event
   if (!importanceMatch) {
      continue;
   }
}
在这里,我们将事件的重要性级别与预定义的 “allowed_importance_levels” 数组进行比较,但前提是重要性过滤器已启用,这由 “enableImportanceFilter” 标志指示。如果过滤器已启用,我们使用for 循环遍历 “allowed_importance_levels” 数组,将事件的重要性与数组中的级别进行比较。
如果找到匹配项,我们将 “importanceMatch” 标志设置为 true 并 break 跳出循环。如果未找到匹配项(即 “importanceMatch” 仍为 false),我们使用 continue 语句跳过当前事件,确保只处理具有所需重要性级别的事件。我们使用另一个数组来定义重要性级别,如下所示:
// Define the levels of importance to filter (low, moderate, high)
ENUM_CALENDAR_EVENT_IMPORTANCE allowed_importance_levels[] = {CALENDAR_IMPORTANCE_LOW, CALENDAR_IMPORTANCE_MODERATE, CALENDAR_IMPORTANCE_HIGH};
在这里,我们添加了所有的重要性级别,这意味着从技术上讲,我们根据优先级允许所有新闻,但您可以选择最适合您交易决策的级别。接下来,我们需要定义时间过滤器的范围。
//--- Define time range for filtering news events based on daily period
datetime timeRange = PeriodSeconds(PERIOD_D1);
datetime timeBefore = TimeTradeServer() - timeRange;
datetime timeAfter = TimeTradeServer() + timeRange;
我们定义了一个基于日线周期来筛选新闻事件的时间范围。我们使用函数 PeriodSecondsa 并传入常量 PERIOD_D1 来确定一天中的秒数,然后将其赋值给 datetime 类型的变量 “timeRange”。“timeBefore” 和 “timeAfter” 变量被设置为通过使用 TimeTradeServer 函数获取的当前服务器时间,分别减去和加上 “timeRange”,来计算围绕当前服务器时间的时间范围。这确保了只有落在指定时间范围内(在当前服务器时间前后一天内)的事件才会被考虑进行处理。请确保根据您的需求调整此设置。有了这个代码逻辑,我们就可以应用时间过滤器了。
//--- Apply time filter and set timeMatch flag (if the filter is enabled)
bool timeMatch = false;
if (enableTimeFilter) {
   datetime eventTime = values[i].time;

   if (eventTime <= TimeTradeServer() && eventTime >= timeBefore) {
      timeMatch = true;  //--- Event is already released
   }
   else if (eventTime >= TimeTradeServer() && eventTime <= timeAfter) {
      timeMatch = true;  //--- Event is yet to be released
   }

   //--- Skip if the event doesn't match the time filter
   if (!timeMatch) {
      continue;
   }
}
在这里,我们通过检查事件的时间是否落在指定的时间范围内来应用时间过滤器,并使用 “timeMatch” 标志来跟踪事件是否符合条件。如果 “enableTimeFilter” 为 true,我们首先从 “values[i].time” 变量中获取事件的时间。然后,我们检查事件的时间是否在过去(在当前服务器时间和 “timeBefore” 之间)或在未来(在当前服务器时间和 “timeAfter” 之间)。如果事件时间落在任一范围内,“timeMatch” 标志就会被设置为 true,表示该事件符合时间过滤器。如果未找到匹配项,我们使用 continue 语句跳过该事件。
关于过滤器的内容就是这些了。如果我们执行到这里,意味着我们已经通过了所有测试,并且拥有了一些新闻事件。因此,我们将新闻过滤器计数加一。
//--- If we reach here, the currency matches the filter
news_filter_count++; //--- Increment the count of filtered events
现在,我们正是利用新闻过滤器计数数据来创建数据承载区域,因为这一次我们不考虑所有被选中事件。这确保了我们只在仪表板中创建与我们相关的、数量刚刚好的数据承载区域。
//--- Set alternating colors for each data row holder
color holder_color = (news_filter_count % 2 == 0) ? C'213,227,207' : clrWhite;

//--- Create rectangle label for each data row holder
createRecLabel(DATA_HOLDERS+string(news_filter_count),62,startY-1,716,26+1,holder_color,1,clrNONE);
在这里,我们为每个数据行承载区域设置交替的颜色,以提高行与行之间的视觉区分度。“holder_color” 是通过一个三元运算符来确定的,如果 “news_filter_count” 是偶数(即 “news_filter_count % 2 == 0”),颜色被设置为浅绿色(C’213,227,207’);如果是奇数,颜色则被设置为白色。这确保了每一行的颜色交替出现,使数据更易于阅读。
然后,我们使用 “createRecLabel” 函数为每个数据行承载区域创建一个矩形标签,该函数会在指定的坐标位置放置一个彩色矩形。标签的唯一标识符是通过将 “DATA_HOLDERS” 与 “news_filter_count” 的字符串形式组合而成,以确保每一行都有一个唯一的名称,并且矩形的尺寸被设置为适合内容。矩形的边框厚度设置为 1,同时我们将填充颜色设置为交替的 “holder_color”,边框颜色设置为 “clrNONE”,即没有边框颜色。
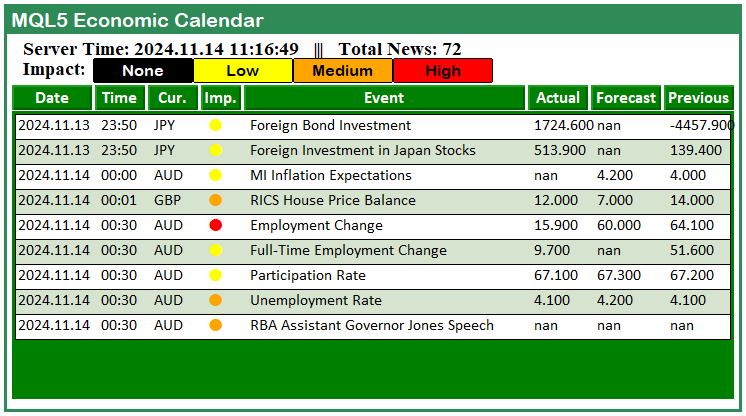
但是,请注意,我们为承载区域的 y 轴位移增加了 1 个像素(如黄色高亮所示),以消除边框。这是一个对比结果。
在增加 1 个像素之前:
在增加 1 个像素之后:
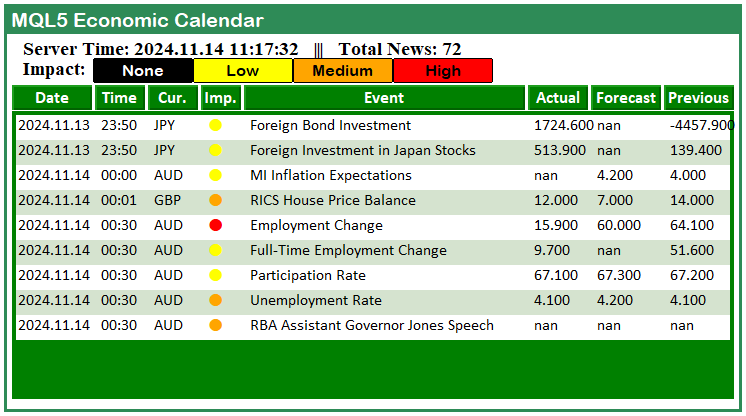
成功了。接下来我们需要做的是,在应用过滤器后,更新仪表板中显示的新闻总数。
updateLabel(TIME_LABEL,"Server Time: "+TimeToString(TimeCurrent(),
           TIME_DATE|TIME_SECONDS)+"   |||   Total News: "+
           IntegerToString(news_filter_count)+"/"+IntegerToString(allValues));
在这里,我们使用 “updateLabel” 函数来更新显示当前服务器时间和已过滤新闻事件总数的标签。我们用一个组合了当前服务器时间和新闻事件计数的新字符串,来更新标识为 “TIME_LABEL” 的标签。为了获取当前服务器时间,我们使用 TimeCurrent 函数,并使用带有 “TIME_DATE | TIME_SECONDS” 标志的 TimeToString 函数来格式化它。
然后,我们显示已过滤新闻事件的总数(存储在 “news_filter_count” 中)以及可用新闻事件的总数(由 “allValues” 表示)。通过更新此标签,我们提供了关于服务器时间和新闻过滤器状态的实时信息,帮助我们随时了解对我们重要的当前市场新闻。
我们用来更新标签的自定义函数的代码片段如下。
//+------------------------------------------------------------------+
//|     Function to create text label                                |
//+------------------------------------------------------------------+

bool updateLabel(string objName,string txt) {
    // Reset any previous errors
    ResetLastError();

    if (!ObjectSetString(0,objName,OBJPROP_TEXT,txt)) {
        Print(__FUNCTION__, ": failed to update the label! Error code = ", _LastError);
        return (false);
    }

    ObjectSetString(0, objName, OBJPROP_TEXT, txt); // Text displayed on the label

    // Redraw the chart to display the label
    ChartRedraw(0);

    return (true); // Label creation successful
}
在这里,我们定义了 “updateLabel” 函数,我们用它来更新图表上已有的标签。该函数接受两个参数:“objName”(标签对象的名称)和 “txt”(要在标签上显示的文本)。我们首先使用 ResetLastError 函数重置任何之前的错误,以确保有一个干净的状态。接下来,我们尝试使用 ObjectSetString 函数,用提供的字符串 “txt” 来更新标签的文本。如果更新失败,我们使用 Print 函数打印一条错误消息,并附上从 _LastError 获取的错误代码,然后返回 “false”。
如果标签更新成功,我们调用 ChartRedraw 函数来刷新图表并显示更新后的标签,最后,我们返回 “true” 以表示操作成功。这个函数允许我们动态地更新图表上标签的内容,为显示诸如服务器时间或新闻事件计数等信息提供了一种灵活的方法。运行程序后,这就是我们得到的结果。
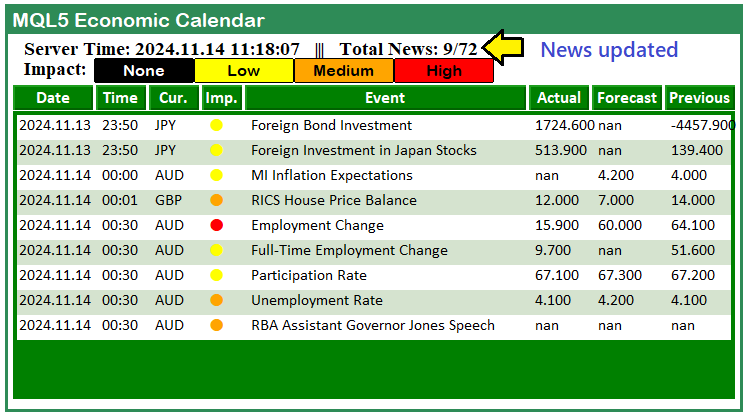
通过这个实现,我们现在可以确定,只考虑与我们相关的新闻,而忽略其他的。我们还显示了在所有选定新闻中通过筛选的新闻总数,展示了可用和已考虑的新闻事件。负责应用过滤器的完整初始化代码片段如下。
string curr_filter[] = {"AUD","CAD","CHF","EUR","GBP","JPY","NZD","USD"};
int news_filter_count = 0;

// Define the levels of importance to filter (low, moderate, high)
ENUM_CALENDAR_EVENT_IMPORTANCE allowed_importance_levels[] = {CALENDAR_IMPORTANCE_LOW, CALENDAR_IMPORTANCE_MODERATE, CALENDAR_IMPORTANCE_HIGH};

//--- Loop through each calendar value up to the maximum defined total
for (int i = 0; i < valuesTotal; i++){

   MqlCalendarEvent event; //--- Declare event structure
   CalendarEventById(values[i].event_id,event); //--- Retrieve event details by ID

   MqlCalendarCountry country; //--- Declare country structure
   CalendarCountryById(event.country_id,country); //--- Retrieve country details by event's country ID

   MqlCalendarValue value; //--- Declare calendar value structure
   CalendarValueById(values[i].id,value); //--- Retrieve actual, forecast, and previous values


   //--- Check if the event’s currency matches any in the filter array (if the filter is enabled)
   bool currencyMatch = false;
   if (enableCurrencyFilter) {
      for (int j = 0; j < ArraySize(curr_filter); j++) {
         if (country.currency == curr_filter[j]) {
            currencyMatch = true;
            break;
         }
      }

      //--- If no match found, skip to the next event
      if (!currencyMatch) {
         continue;
      }
   }

   //--- Check importance level if importance filter is enabled
   bool importanceMatch = false;
   if (enableImportanceFilter) {
      for (int k = 0; k < ArraySize(allowed_importance_levels); k++) {
         if (event.importance == allowed_importance_levels[k]) {
            importanceMatch = true;
            break;
         }
      }

      //--- If importance does not match the filter criteria, skip the event
      if (!importanceMatch) {
         continue;
      }
   }

   //--- Apply time filter and set timeMatch flag (if the filter is enabled)
   bool timeMatch = false;
   if (enableTimeFilter) {
      datetime eventTime = values[i].time;

      if (eventTime <= TimeTradeServer() && eventTime >= timeBefore) {
         timeMatch = true;  //--- Event is already released
      }
      else if (eventTime >= TimeTradeServer() && eventTime <= timeAfter) {
         timeMatch = true;  //--- Event is yet to be released
      }

      //--- Skip if the event doesn't match the time filter
      if (!timeMatch) {
         continue;
      }
   }

   //--- If we reach here, the currency matches the filter
   news_filter_count++; //--- Increment the count of filtered events

   //--- Set alternating colors for each data row holder
   color holder_color = (news_filter_count % 2 == 0) ? C'213,227,207' : clrWhite;

   //--- Create rectangle label for each data row holder
   createRecLabel(DATA_HOLDERS+string(news_filter_count),62,startY-1,716,26+1,holder_color,1,clrNONE);

   //--- Initialize starting x-coordinate for each data entry
   int startX = 65;

   //--- Loop through calendar data columns
   for (int k=0; k<ArraySize(array_calendar); k++){

      //--- Print event details for debugging
      //Print("Name = ",event.name,", IMP = ",EnumToString(event.importance),", COUNTRY = ",country.name,", TIME = ",values[i].time);

      //--- Skip event if currency does not match the selected country code
      // if (StringFind(_Symbol,country.currency) < 0) continue;

      //--- Prepare news data array with time, country, and other event details
      string news_data[ArraySize(array_calendar)];
      news_data[0] = TimeToString(values[i].time,TIME_DATE); //--- Event date
      news_data[1] = TimeToString(values[i].time,TIME_MINUTES); //--- Event time
      news_data[2] = country.currency; //--- Event country currency

      //--- Determine importance color based on event impact
      color importance_color = clrBlack;
      if (event.importance == CALENDAR_IMPORTANCE_LOW){importance_color=clrYellow;}
      else if (event.importance == CALENDAR_IMPORTANCE_MODERATE){importance_color=clrOrange;}
      else if (event.importance == CALENDAR_IMPORTANCE_HIGH){importance_color=clrRed;}

      //--- Set importance symbol for the event
      news_data[3] = ShortToString(0x25CF);

      //--- Set event name in the data array
      news_data[4] = event.name;

      //--- Populate actual, forecast, and previous values in the news data array
      news_data[5] = DoubleToString(value.GetActualValue(),3);
      news_data[6] = DoubleToString(value.GetForecastValue(),3);
      news_data[7] = DoubleToString(value.GetPreviousValue(),3);

      //--- Create label for each news data item
      if (k == 3){
         createLabel(ARRAY_NEWS+IntegerToString(i)+" "+array_calendar[k],startX,startY-(22-12),news_data[k],importance_color,22,"Calibri");
      }
      else {
         createLabel(ARRAY_NEWS+IntegerToString(i)+" "+array_calendar[k],startX,startY,news_data[k],clrBlack,12,"Calibri");
      }

      //--- Increment x-coordinate for the next column
      startX += buttons[k]+3;
   }
   //--- Increment y-coordinate for the next row of data
   startY += 25;
   //Print(startY); //--- Print current y-coordinate for debugging
}

//Print("Final News = ",news_filter_count);
updateLabel(TIME_LABEL,"Server Time: "+TimeToString(TimeCurrent(),
           TIME_DATE|TIME_SECONDS)+"   |||   Total News: "+
           IntegerToString(news_filter_count)+"/"+IntegerToString(allValues));
成功了。最后,当程序从图表上移除时,我们希望一并移除仪表板,以保持一个干净的环境。为了更专业、更轻松地实现这一点,我们可以定义一个函数,将所有的控制逻辑都添加到这个函数中。
//+------------------------------------------------------------------+
//|      Function to destroy the Dashboard panel                     |
//+------------------------------------------------------------------+

void destroy_Dashboard(){

   //--- Delete main rectangle panel
   ObjectDelete(0, MAIN_REC);

   //--- Delete first sub-rectangle in the dashboard
   ObjectDelete(0, SUB_REC1);

   //--- Delete second sub-rectangle in the dashboard
   ObjectDelete(0, SUB_REC2);

   //--- Delete header label text
   ObjectDelete(0, HEADER_LABEL);

   //--- Delete server time label text
   ObjectDelete(0, TIME_LABEL);

   //--- Delete label for impact/importance
   ObjectDelete(0, IMPACT_LABEL);

   //--- Delete all objects related to the calendar array
   ObjectsDeleteAll(0, ARRAY_CALENDAR);

   //--- Delete all objects related to the news array
   ObjectsDeleteAll(0, ARRAY_NEWS);

   //--- Delete all data holder objects created in the dashboard
   ObjectsDeleteAll(0, DATA_HOLDERS);

   //--- Delete all impact label objects
   ObjectsDeleteAll(0, IMPACT_LABEL);

   //--- Redraw the chart to update any visual changes
   ChartRedraw(0);
}
在这里,我们定义了自定义函数 “destroy_Dashboard”,我们将用它来移除图表上为仪表板面板创建的所有元素,使图表恢复到其初始状态。这包括删除仪表板中使用的每个对象、标签和容器。首先,我们通过在 “MAIN_REC”(代表我们仪表板的主容器)上调用 ObjectDelete 函数来删除主面板矩形。然后,我们继续移除任何子矩形,例如 “SUB_REC1” 和 “SUB_REC2”,我们曾用它们来组织仪表板的各个部分。
接下来,我们删除显示信息的标签,例如仪表板标题(“HEADER_LABEL”)、服务器时间(“TIME_LABEL”)和影响级别(“IMPACT_LABEL”)。这些标签中的每一个都会被移除,以确保图表上显示的任何文本信息都被清除。然后,我们删除 “ARRAY_CALENDAR” 和 “ARRAY_NEWS” 中的所有对象,它们分别存储有关日历和新闻数据的信息。我们使用 ObjectsDeleteAll 函数执行此操作,该函数允许我们清除与这些数组相关联的任何动态创建的对象。
之后,我们删除与 “DATA_HOLDERS” 相关的所有对象,这些对象代表仪表板中显示数据点的各个行或容器,接着再次调用以删除 “IMPACT_LABEL” 实例,确保不留下任何视觉元素。
最后,我们调用 ChartRedraw 函数,该函数会刷新图表并清除仪表板的任何残留痕迹,为任何进一步的绘制或仪表板重置提供一个空白的画布。该函数本质上拆解了整个仪表板显示,在我们移除程序后,为图表准备进行新的更新或添加其他视觉元素。最后,我们只需在 OnDeinit 事件处理程序上调用该函数,即可实现仪表板的移除。
//+------------------------------------------------------------------+
//| Expert deinitialization function                                 |
//+------------------------------------------------------------------+
void OnDeinit(const int reason){
//---

   destroy_Dashboard();
}
在 OnDeinit 事件处理程序上调用自定义函数后,我们确保将仪表板从图表上移除。这就是为我们的仪表板添加过滤器所需要做的全部工作。
结论
总而言之,我们通过集成基本的过滤功能,成功地增强了我们的MQL5 经济日历仪表板,我们可以利用这些功能,根据货币、重要性和时间来查看最相关的新闻事件。这些过滤器提供了一个更精简、更专注的界面,使我们能够专注于符合我们特定交易策略和目标的经济事件。
通过使用这些过滤器来优化仪表板,我们使其成为一个更强大、更高效的工具,用于做出明智的决策。在下一部分中,我们将在这一基础上进行扩展,为日历仪表板添加实时更新功能,使其能够直接在我们的 MQL5 仪表板内,最新的经济新闻不断被刷新。
本文由MetaQuotes Ltd译自英文
原文地址: https://www.mql5.com/en/articles/16380
注意: MetaQuotes Ltd.将保留所有关于这些材料的权利。全部或部分复制或者转载这些材料将被禁止。
本文由网站的一位用户撰写,反映了他们的个人观点。MetaQuotes Ltd 不对所提供信息的准确性负责,也不对因使用所述解决方案、策略或建议而产生的任何后果负责。
 从基础到中级:数组(一)
 股票交易中的非线性回归模型
 您应当知道的 MQL5 向导技术(第 46 部分):Ichimoku
