数据科学和机器学习(第 14 部分):运用 Kohonen 映射在市场中寻找出路
概述
Kohonen 映射、或自组织映射(SOM)、或自组织特征映射(SOFM)。 是一种无监督机器学习技术,用于生成高维数据集的低维(通常是二维)表示,同时保留数据的拓扑结构。 例如,具有 n 个观测值中测量的 p 个变量的数据集,可以表示为具有相似变量值的观测值聚类。 然后,可以将这些聚类可视化为“二维映射”,如此令近端聚类中的观测值比远端聚类中的观测值具有更相似的值,这可令高维数据更容易可视化和分析。
Kohonen 映射是由芬兰数学家 Teuvo Kohonen 于 1980 年代开发的。
概览
Kohonen 映射由连接到其相邻神经元的神经元网格组成,在训练期间,输入数据被呈现给网络,且每个神经元都要计算其与输入数据的相似度。 具有最高相度的神经元称为获胜者,其权重被调整,以便更好地匹配输入数据。
随着时间的推移,相邻的神经元也会调整它们的权重,令其与获胜神经元相似度更高,从而产生图中神经元的拓扑顺序。 这种自组织过程允许 Kohonen 映射表示低维空间中输入数据之间的复杂关系。 令其可用于数据可视化和聚类分析。
学习算法
该算法在自组织映射中的目标是令网络的不同部分对某些输入形态做出类似的响应。 这部分的激发模拟人脑的某些部分如何处理视觉,听觉和其它信息。
我们看看这个算法在数学术语和 MQL5 代码方面是如何工作的。
算法中涉及的步骤
尝试对此算法进行编码时,需要考虑四个主要步骤:
步骤 01: 初始化权重 ![]() 。 可以假设随机值。 其它参数(如学习率和聚类数量)也在此阶段初始化。
。 可以假设随机值。 其它参数(如学习率和聚类数量)也在此阶段初始化。
CKohonenMaps::CKohonenMaps(matrix &matrix_, bool save_clusters=true, uint clusters=2, double alpha=0.01, uint epochs=100)
 {
   Matrix = matrix_;

   n = (uint)matrix_.Cols();
   rows = matrix_.Rows();
   m = clusters;

   cluster_tensor = new CTensors(m);

   w_matrix =matrix_utils.Random(0.0, 1.0, n, m, RANDOM_STATE);
 }
如往常一样,参数在 Kohonen 映射的类构造函数中初始化。
Kohonen 映射是一种数据挖掘技术。 在完成全部所言之后,我们需要获得挖掘的数据,这就是为什么您看到布尔参数 save_clusters=true,这将令我们获得 Kohonen 映射为我们获得的聚集。
步骤 02: 计算每个输入与其各自权重之间的欧几里得距离

其中:
![]() = 输入向量
= 输入向量
![]() = 权重向量
= 权重向量
double CKohonenMaps:: Euclidean_distance(const vector &v1, const vector &v2)
  {
   double dist = 0;

   if(v1.Size() != v2.Size())
      Print(__FUNCTION__, " v1 and v2 not matching in size");
   else
     {
      double c = 0;
      for(ulong i=0; i<v1.Size(); i++)
         c += MathPow(v1[i] - v2[i], 2);

      dist = MathSqrt(c);
     }

   return(dist);
  }
为了应用这个公式,并澄清一切,我们需要一个简单的数据集来帮助我们编码和测试。
   matrix Matrix = {
                     {1.2, 2.3},
                     {0.7, 1.8},
                     {3.6, 4.8},
                     {2.8, 3.9},
                     {5.2, 6.7},
                     {4.8, 5.6}
                   };

   maps = new CKohonenMaps(Matrix); //Giving our kohonen maps class data
当调用构造函数,并生成权重时,下面是输出。
CS      0       15:52:27.572    Self Organizing map (EURUSD,H1) w Matrix
CS      0       15:52:27.572    Self Organizing map (EURUSD,H1) [[0.005340739158299509,0.01220740379039888]
CS      0       15:52:27.572    Self Organizing map (EURUSD,H1)  [0.5453352458265939,0.9172643208105716]]
CS      0       15:52:27.572    Self Organizing map (EURUSD,H1) Matrix
CS      0       15:52:27.572    Self Organizing map (EURUSD,H1) [[1.2,2.3]
CS      0       15:52:27.572    Self Organizing map (EURUSD,H1)  [0.7,1.8]
CS      0       15:52:27.572    Self Organizing map (EURUSD,H1)  [3.6,4.8]
CS      0       15:52:27.572    Self Organizing map (EURUSD,H1)  [2.8,3.9]
CS      0       15:52:27.572    Self Organizing map (EURUSD,H1)  [5.2,6.7]
CS      0       15:52:27.572    Self Organizing map (EURUSD,H1)  [4.8,5.6]]
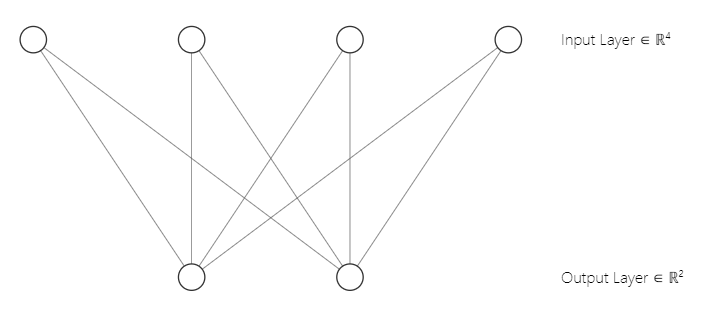
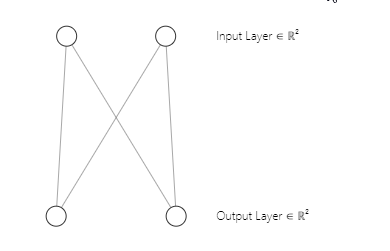
您也许已经注意到,我们的神经网络架构是一个 [2 输入和 2 输出],这就是为什么我们有一个 2x2 的权重矩阵。 该矩阵是在考虑 [2 个标记为 n 的输入矩阵列,和 2 个选择标记为 m 的聚集]的情况下生成的。 从下面的代码行中,我们在第一部分就看到了。
w_matrix =matrix_utils.Random(0.0, 1.0, n, m, RANDOM_STATE);恰好澄清一下,以下是我们的 Kohonen 映射神经网络架构的样子;
步骤 03: 找到获胜单位索引 i,如此 D(j) 最小。 简言之,找到单元聚集,这会把我带到了kohonen 映射竞争学习的一个重要主题。
竞争性学习。
自组织映射是一种人工神经网络,与其它类型的人工神经网络不同,它用纠错学习(例如梯度下降的反向传播)进行训练,Kohonen 映射采用竞争性学习进行训练。
在竞争性学习中,Kohonen 映射中的神经元相互竞争,成为与输入数据最相似的神经元,从而成为“赢家”。
在训练阶段,每个输入数据点都呈现给 Kohonen 映射,并计算输入数据和每个神经元的权重向量之间的相似度。 权重向量与输入数据最相似的神经元称为赢家或“最佳匹配单元”(BMU)。
BMU 是根据输入数据和神经元权重矢量之间的最小欧几里得距离进行选择的。 然后,获胜的神经元更新其权重向量,令其与输入数据相似度更高。 用于更新权重的公式称为 Kohonen 学习规则,它移动获胜神经元的权重向量,及与输入数据相邻的神经元。
为了编写步骤 03 的代码。 需要这几行代码。
   vector D(m); //Euclidean distance btn clusters  | Remember m is the number of clusters selected

   for (ulong i=0; i<rows; i++)
       {
         for (ulong j=0; j<m; j++)
           {
             D[j] = Euclidean_distance(Matrix.Row(i),w_matrix.Col(j));
           }

         #ifdef DEBUG_MODE
            Print("Euc distance ",D," Winning cluster ",D.ArgMin());
         #endif
永远记住,所有产生欧几里得距离较小的神经元的类是为获胜的聚集。
通过竞争性学习,Kohonen 映射学习在低维空间中创建输入数据的拓扑表示,同时保留输入数据之间的关系。
步骤 04: 更新权重。
可以使用以下公式更新权重。
![]()
其中:
![]() = 新权重向量
= 新权重向量
![]() = 旧权重向量
= 旧权重向量
![]() = 学习率
= 学习率
![]() = 输入向量
= 输入向量
下面是此公式的代码:
//--- weights update

   ulong min = D.ArgMin(); //winning cluster

   vector w_new =  w_matrix.Col(min) + (alpha * (Matrix.Row(i) - w_matrix.Col(min)));

   w_matrix.Col(w_new, min);
不同于其它类型的人工神经网络,其中特定层的所有权重都参与其中,Kohonen 映射会注意特定聚集的权重,并仅用它们来参与查找该聚集。
我们已经完成了这些步骤,我们的算法已经完整,是时候运行一下,看看一切是如何工作的了。
下面是到目前为止算法的完整代码。
CKohonenMaps::CKohonenMaps(matrix &matrix_, bool save_clusters=true, uint clusters=2, double alpha=0.01, uint epochs=100)
 {
   Matrix = matrix_;

   n = (uint)matrix_.Cols();
   rows = matrix_.Rows();
   m = clusters;

   cluster_tensor = new CTensors(m);

   w_matrix =matrix_utils.Random(0.0, 1.0, n, m, RANDOM_STATE);

   vector D(m); //Euclidean distance btn clusters


   for (uint epoch=0; epoch<epochs; epoch++)
    {
      double epoch_start = GetMicrosecondCount()/(double)1e6, epoch_stop=0;

      for (ulong i=0; i<rows; i++)
       {
         for (ulong j=0; j<m; j++)
           {
             D[j] = Euclidean_distance(Matrix.Row(i),w_matrix.Col(j));
           }

         #ifdef DEBUG_MODE
            Print("Euc distance ",D," Winning cluster ",D.ArgMin());
         #endif

   //--- weights update

         ulong min = D.ArgMin();

         vector w_new =  w_matrix.Col(min) + (alpha * (Matrix.Row(i) - w_matrix.Col(min)));

         w_matrix.Col(w_new, min);

       }

      epoch_stop =GetMicrosecondCount()/(double)1e6;

      printf("Epoch [%d/%d] | %sElapsed ",epoch+1,epochs, CalcTimeElapsed(epoch_stop-epoch_start));

    }  //end of training

//---

  #ifdef DEBUG_MODE
      Print("\nNew weights\n",w_matrix);
  #endif

 }
输出:
CS      0       04:13:26.617    Self Organizing map (EURUSD,H1) Euc distance [2.122748018266242,1.822857430002081] Winning cluster 1
CS      0       04:13:26.617    Self Organizing map (EURUSD,H1) Euc distance [1.434132188481296,1.100846180984197] Winning cluster 1
CS      0       04:13:26.617    Self Organizing map (EURUSD,H1) Euc distance [5.569896531530945,5.257391342266398] Winning cluster 1
CS      0       04:13:26.617    Self Organizing map (EURUSD,H1) Euc distance [4.36622216533946,4.000958814345993] Winning cluster 1
CS      0       04:13:26.617    Self Organizing map (EURUSD,H1) Euc distance [8.053842751911217,7.646959164093921] Winning cluster 1
CS      0       04:13:26.617    Self Organizing map (EURUSD,H1) Euc distance [6.966950064745546,6.499246789416081] Winning cluster 1
CS      0       04:13:26.617    Self Organizing map (EURUSD,H1) Epoch [1/100] | 0.000 Seconds Elapsed
....
....
....
CS      0       04:13:26.622    Self Organizing map (EURUSD,H1) Euc distance [0.7271897806071723,4.027137175049654] Winning cluster 0
CS      0       04:13:26.622    Self Organizing map (EURUSD,H1) Euc distance [0.08133608432880858,4.734224801594559] Winning cluster 0
CS      0       04:13:26.622    Self Organizing map (EURUSD,H1) Euc distance [4.18281664576938,0.5635073709012016] Winning cluster 1
CS      0       04:13:26.622    Self Organizing map (EURUSD,H1) Euc distance [2.979092473547668,1.758946102746018] Winning cluster 1
CS      0       04:13:26.622    Self Organizing map (EURUSD,H1) Euc distance [6.664860479474853,1.952054507391296] Winning cluster 1
CS      0       04:13:26.622    Self Organizing map (EURUSD,H1) Euc distance [5.595867985957728,0.8907607121421737] Winning cluster 1
CS      0       04:13:26.622    Self Organizing map (EURUSD,H1) Epoch [100/100] | 0.000 Seconds Elapsed
CS      0       04:13:26.622    Self Organizing map (EURUSD,H1)
CS      0       04:13:26.622    Self Organizing map (EURUSD,H1) New weights
CS      0       04:13:26.622    Self Organizing map (EURUSD,H1) [[0.75086979456201,4.028060179594681]
CS      0       04:13:26.622    Self Organizing map (EURUSD,H1)  [1.737580668068743,5.173650598091957]]
太棒了,一切如期工作,我们的 kohonen 映射能够聚类我们的主矩阵,
   matrix Matrix = {
                     {1.2, 2.3}, //Into cluster 0
                     {0.7, 1.8}, //Into cluster 0
                     {3.6, 4.8}, //Into cluster 1
                     {2.8, 3.9}, //Into cluster 1
                     {5.2, 6.7}, //Into cluster 1
                     {4.8, 5.6}  //Into cluster 1
                   };
这正是它应该的样子,太棒了,不过,呈现此输出并在绘图上可视化它们并不是一项简单的任务。 我们有两个聚集,一个是 2x2 矩阵,另一个是 4x2 矩阵。 一个有 4 个值,另一个有 8 个值。 如果您还记得在关于 K-Means 聚类的文章中,由于聚类大小的差异,我很难呈现聚类,故这次采取了极端措施。
机器学习中的张量
张量是多维数组中向量和矩阵的推广。 简单地说,张量是一个内部包含矩阵和向量的数组,在 python 中,它看起来像这样;
# create tensor
from numpy import array

T = array([
  [[1,2,3],    [4,5,6],    [7,8,9]],
  [[11,12,13], [14,15,16], [17,18,19]],
  [[21,22,23], [24,25,26], [27,28,29]],
  ])
张量是机器学习框架(如 TensorFlow,PyTorch 和 Keras)所采用的基本数据结构。
张量在机器学习算法中可用于矩阵乘法、卷积和池化等操作。 张量还用于在训练和推理期间存储和操作神经网络的权重和偏差。 总体而言,张量是机器学习中至关重要的数据结构,可以有效地计算和表示复杂数据。
我不得不导入 Tensors.mqh 库。 可在我的 GitHub wiki上参阅它的有关内容,
我添加了张量来帮助我们收集每个张量的聚集。
CKohonenMaps::CKohonenMaps(matrix &matrix_, bool save_clusters=true, uint clusters=2, double alpha=0.01, uint epochs=100)
 {
   Matrix = matrix_;

   n = (uint)matrix_.Cols();
   rows = matrix_.Rows();
   m = clusters;

   cluster_tensor = new CTensors(m);

   w_matrix =matrix_utils.Random(0.0, 1.0, n, m, RANDOM_STATE);

   Print("w Matrix\n",w_matrix,"\nMatrix\n",Matrix);

   vector D(m); //Euclidean distance btn clusters


   for (uint epoch=0; epoch<epochs; epoch++)
    {
      double epoch_start = GetMicrosecondCount()/(double)1e6, epoch_stop=0;

      for (ulong i=0; i<rows; i++)
       {
         for (ulong j=0; j<m; j++)
           {
             D[j] = Euclidean_distance(Matrix.Row(i),w_matrix.Col(j));
           }

         #ifdef DEBUG_MODE
            Print("Euc distance ",D," Winning cluster ",D.ArgMin());
         #endif

   //--- weights update

         ulong min = D.ArgMin();

         if (epoch == epochs-1) //last iteration
            cluster_tensor.TensorAppend(Matrix.Row(i), min);

         vector w_new =  w_matrix.Col(min) + (alpha * (Matrix.Row(i) - w_matrix.Col(min)));

         w_matrix.Col(w_new, min);

         //Print("New w_Matrix\n ",w_matrix);
       }

      epoch_stop =GetMicrosecondCount()/(double)1e6;

      printf("Epoch [%d/%d] | %sElapsed ",epoch+1,epochs, CalcTimeElapsed(epoch_stop-epoch_start));

    }  //end of the training

//---

  #ifdef DEBUG_MODE
      Print("\nNew weights\n",w_matrix);
  #endif

//---

   Print("\nclusters");
   cluster_tensor.TensorPrint();
}
输出:
CS      0       04:13:26.624    Self Organizing map (EURUSD,H1) clusters
CS      0       04:13:26.624    Self Organizing map (EURUSD,H1) TENSOR INDEX <<0>>
CS      0       04:13:26.624    Self Organizing map (EURUSD,H1) [[1.2,2.3]
CS      0       04:13:26.624    Self Organizing map (EURUSD,H1)  [0.7,1.8]]
CS      0       04:13:26.624    Self Organizing map (EURUSD,H1) TENSOR INDEX <<1>>
CS      0       04:13:26.624    Self Organizing map (EURUSD,H1) [[3.6,4.8]
CS      0       04:13:26.624    Self Organizing map (EURUSD,H1)  [2.8,3.9]
CS      0       04:13:26.624    Self Organizing map (EURUSD,H1)  [5.2,6.7]
CS      0       04:13:26.624    Self Organizing map (EURUSD,H1)  [4.8,5.6]]
太好了,现在聚集存储在各自的张量之中,是时候据其做一些有用的事情了。
提取聚集
我们提取聚集,先要将聚集保存到 CSV 文件之中。
  matrix mat= {};

  if (save_clusters)
     for (uint i=0; i<this.cluster_tensor.TENSOR_DIMENSION; i++)
       {
          mat = this.cluster_tensor.Tensor(i); //Obtain a matrix located at I index in a cluster tensor

         string header[]; ArrayResize(header, (int)mat.Cols());

         for (int k=0; k<ArraySize(header); k++)
           header[k] = "col"+string(k);

         if (this.matrix_utils.WriteCsv("SOM\\Cluster"+string(i+1)+".csv",mat,header))
            Print("Clusters CSV files saved under the directory Files\\SOM");
       }
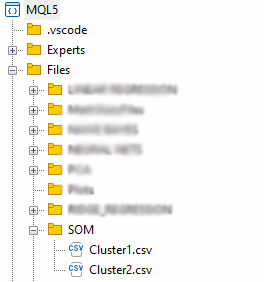
这些文件将存储在 “Files” 父目录内的 SOM 目录之下。
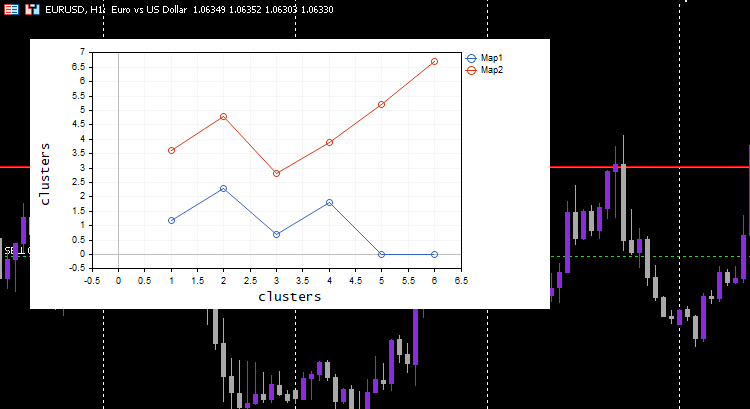
我们已经提取完数据,但 Kohonen 映射的基本部分是可视化聚集,并绘制算法为我们准备好的映射。 Python 库和其它框架通常使用 Hit 映射,我们将为此库使用 Curve 绘图。
   vector v;
   matrix plotmatrix(rows, m);

     for (uint i=0; i<this.cluster_tensor.TENSOR_DIMENSION; i++)
       {
          mat = this.cluster_tensor.Tensor(i);

          v  = this.matrix_utils.MatrixToVector(mat);

          plotmatrix.Col(v, i);
       }

    this.plt.ScatterCurvePlotsMatrix("kom",plotmatrix,"Map","clusters","clusters");
输出:
酷,一切正常,且绘图能按预期很好地可视化数据,我们尝试把算法应用在一些有用的东西上。
聚集指标值
我们为不同的 5 条移动平均线指标收集 100 根柱线,并尝试利用 Kohonen 映射对它们进行聚类。 这些指标将来自相同的图表、周期和应用的价格,但每个指标的周期不同。
#include <MALE5\Neural Networks\kohonen maps.mqh>
#include <MALE5\matrix_utils.mqh>


CMatrixutils matrix_utils;
CKohonenMaps *maps;

input int bars = 100;

int handles[5];
int period[5] = {10,20,30,50,100};
matrix Matrix(bars,5);
//+------------------------------------------------------------------+
//| Expert initialization function                                   |
//+------------------------------------------------------------------+
int OnInit()
  {
//---

   vector v;

   for (int i=0; i<5; i++)
      {
         handles[i] = iMA(Symbol(),PERIOD_CURRENT,period[i],0,MODE_LWMA,PRICE_CLOSE);
         matrix_utils.CopyBufferVector(handles[i],0,0,bars, v);

         Matrix.Col(v, i); //store indicators into a matrix
      }


   maps = new CKohonenMaps(Matrix,true,2,0.01,1000);

//---
   return(INIT_SUCCEEDED);
  }
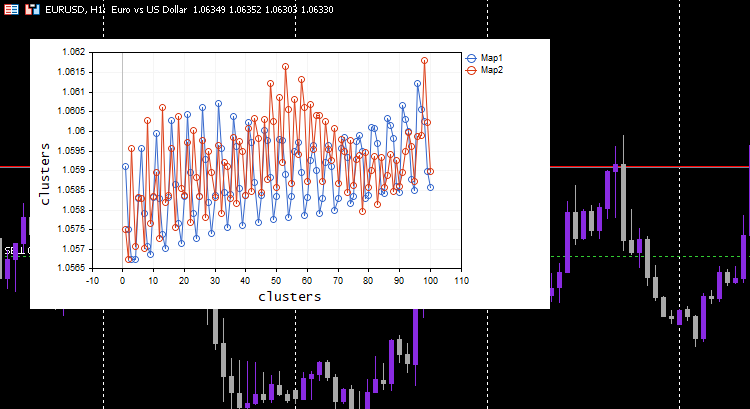
我选择了 learning rate/alpha = 0.01 和 epochs = 1000,下面是 kohonen 映射。
看起来很奇怪,我不得不检查日志中是否有这种奇怪的行为,所以我找到了。
CS      0       06:19:59.911    Self Organizing map (EURUSD,H1) clusters
CS      0       06:19:59.911    Self Organizing map (EURUSD,H1) TENSOR INDEX <<0>>
CS      0       06:19:59.911    Self Organizing map (EURUSD,H1) [[1.059108363197969,1.057514381244092,1.056754472954214,1.056739184229631,1.058300613902105]
CS      0       06:19:59.911    Self Organizing map (EURUSD,H1)  [1.059578181379783,1.057915286006,1.057066064352063,1.056875795994335,1.05831249905062]
....
....
CS      0       06:19:59.912    Self Organizing map (EURUSD,H1)  [1.063954363197777,1.061619428863266,1.061092386932678,1.060653270504107,1.059293304991227]
CS      0       06:19:59.912    Self Organizing map (EURUSD,H1)  [1.065106545015954,1.062409714577555,1.061610946072463,1.06098919991587,1.059488318852614…]
CS      0       06:19:59.912    Self Organizing map (EURUSD,H1) TENSOR INDEX <<1>>
CS      0       06:19:59.912    Self Organizing map (EURUSD,H1) []
CS      0       06:19:59.912    Self Organizing map (EURUSD,H1) CMatrixutils::MatrixToVector Failed to turn the matrix to a vector rows 0 cols 0
第二个聚类的张量为空,这意味着算法不能预测它,所有预测数据都属于聚类 0。
始终常规化您的变量
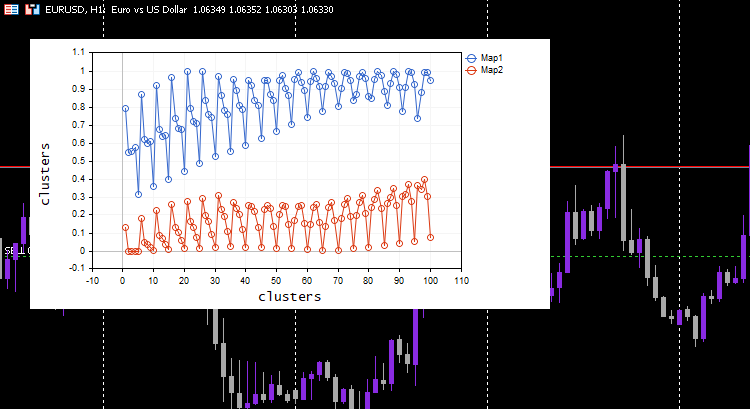
我已经重申过几次了,但我还将继续说,常规化您的输入数据对于您遇到的所有机器学习模型都至关重要,再一次,常规化的重要性被证明是显而易见。 我们来看看数据常规化后的结果。
我选择了最小-最大缩放器常规化技术。
#include <MALE5\Neural Networks\kohonen maps.mqh>
#include <MALE5\preprocessing.mqh>
#include <MALE5\matrix_utils.mqh>

CPreprocessing *pre_processing;
CMatrixutils matrix_utils;
CKohonenMaps *maps;

input int bars = 100;

int handles[5];
int period[5] = {10,20,30,50,100};
matrix Matrix(bars,5);
//+------------------------------------------------------------------+
//| Expert initialization function                                   |
//+------------------------------------------------------------------+
int OnInit()
  {
//---

   vector v;

   for (int i=0; i<5; i++)
      {
         handles[i] = iMA(Symbol(),PERIOD_CURRENT,period[i],0,MODE_LWMA,PRICE_CLOSE);
         matrix_utils.CopyBufferVector(handles[i],0,0,bars, v);

         Matrix.Col(v, i);
      }

   pre_processing = new CPreprocessing(Matrix, NORM_MIN_MAX_SCALER);

   maps = new CKohonenMaps(Matrix,true,2,0.01,1000);


//---
   return(INIT_SUCCEEDED);
  }
这次优美的 Kohonen 映射会显示在图表上。
很好,但是常规化数据将数据转换为较小的值,但是,有些人只想为了理解形态而对数据进行聚类,并把提取的数据用在其它程序中,此常规化过程需要集成到算法的核心当中,数据需要进行常规化和逆向常规化,如此得到的聚类处于原始值中,由于聚类技术不会更改数据,它只是对它们进行分组。运用这个 Preprocessing 类可以成功地完成常规化和逆向常规化的过程。
CKohonenMaps::CKohonenMaps(matrix &matrix_, bool save_clusters=true, uint clusters=2, double alpha=0.01, uint epochs=100, norm_technique NORM_TECHNIQUE=NORM_MIN_MAX_SCALER)
 {
   Matrix = matrix_;

   n = (uint)matrix_.Cols();
   rows = matrix_.Rows();
   m = clusters;

   pre_processing = new CPreprocessing(Matrix, NORM_TECHNIQUE);
   cluster_tensor = new CTensors(m);

   w_matrix =matrix_utils.Random(0.0, 1.0, n, m, RANDOM_STATE);

   #ifdef DEBUG_MODE
      Print("w Matrix\n",w_matrix,"\nMatrix\n",Matrix);
   #endif

   vector D(m); //Euclidean distance btn clusters


   for (uint epoch=0; epoch<epochs; epoch++)
    {

      double epoch_start = GetMicrosecondCount()/(double)1e6, epoch_stop=0;

      for (ulong i=0; i<rows; i++)
       {
         for (ulong j=0; j<m; j++)
           {
             D[j] = Euclidean_distance(Matrix.Row(i),w_matrix.Col(j));
           }

         #ifdef DEBUG_MODE
            Print("Euc distance ",D," Winning cluster ",D.ArgMin());
         #endif

   //--- weights update

         ulong min = D.ArgMin();

         if (epoch == epochs-1) //last iteration
            cluster_tensor.TensorAppend(Matrix.Row(i), min);


         vector w_new =  w_matrix.Col(min) + (alpha * (Matrix.Row(i) - w_matrix.Col(min)));

         w_matrix.Col(w_new, min);
       }

      epoch_stop =GetMicrosecondCount()/(double)1e6;

      printf("Epoch [%d/%d] | %sElapsed ",epoch+1,epochs, CalcTimeElapsed(epoch_stop-epoch_start));

    }  //end of the training

//---

  #ifdef DEBUG_MODE
      Print("\nNew weights\n",w_matrix);
  #endif

//---

   matrix mat= {};

   vector v;
   matrix plotmatrix(rows, m);

     for (uint i=0; i<this.cluster_tensor.TENSOR_DIMENSION; i++)
       {
          mat = this.cluster_tensor.Tensor(i);

          v  = this.matrix_utils.MatrixToVector(mat);

          plotmatrix.Col(v, i);
       }

    this.plt.ScatterCurvePlotsMatrix("kom",plotmatrix,"Map","clusters","clusters");

//---


  if (save_clusters)
     for (uint i=0; i<this.cluster_tensor.TENSOR_DIMENSION; i++)
       {
         mat = this.cluster_tensor.Tensor(i);
         pre_processing.ReverseNormalization(mat);
         cluster_tensor.TensorAdd(mat, i);

         string header[]; ArrayResize(header, (int)mat.Cols());

         for (int k=0; k<ArraySize(header); k++)
           header[k] = "col"+string(k);

         if (this.matrix_utils.WriteCsv("SOM\\Cluster"+string(i+1)+".csv",mat,header))
            Print("Clusters CSV files saved under the directory Files\\SOM");
       }

//---

   Print("\nclusters");
   cluster_tensor.TensorPrint();

 }
为了向您展示它是如何工作的,我不得不回到我们开始时就拿到的简单数据集。
   matrix Matrix = {
                     {1.2, 2.3},
                     {0.7, 1.8},
                     {3.6, 4.8},
                     {2.8, 3.9},
                     {5.2, 6.7},
                     {4.8, 5.6}
                   };

   maps = new CKohonenMaps(Matrix,true,2,0.01,1000);
输出:
CS      0       07:14:44.660    Self Organizing map (EURUSD,H1) w Matrix
CS      0       07:14:44.660    Self Organizing map (EURUSD,H1) [[0.005340739158299509,0.01220740379039888]
CS      0       07:14:44.660    Self Organizing map (EURUSD,H1)  [0.5453352458265939,0.9172643208105716]]
CS      0       07:14:44.660    Self Organizing map (EURUSD,H1) Matrix
CS      0       07:14:44.660    Self Organizing map (EURUSD,H1) [[0.1111111111111111,0.1020408163265306]
CS      0       07:14:44.660    Self Organizing map (EURUSD,H1)  [0,0]
CS      0       07:14:44.660    Self Organizing map (EURUSD,H1)  [0.6444444444444445,0.6122448979591836]
CS      0       07:14:44.660    Self Organizing map (EURUSD,H1)  [0.4666666666666666,0.4285714285714285]
CS      0       07:14:44.660    Self Organizing map (EURUSD,H1)  [1,1]
CS      0       07:14:44.660    Self Organizing map (EURUSD,H1)  [0.911111111111111,0.7755102040816325]]
CS      0       07:14:44.660    Self Organizing map (EURUSD,H1) Epoch [1/1000] | 0.000 Seconds Elapsed
CS      0       07:14:44.660    Self Organizing map (EURUSD,H1) Epoch [2/1000] | 0.000 Seconds Elapsed
CS      0       07:14:44.660    Self Organizing map (EURUSD,H1) Epoch [3/1000] | 0.000 Seconds Elapsed
...
...
...
CS      0       07:14:44.674    Self Organizing map (EURUSD,H1) Epoch [999/1000] | 0.000 Seconds Elapsed
CS      0       07:14:44.674    Self Organizing map (EURUSD,H1) Epoch [1000/1000] | 0.000 Seconds Elapsed
CS      0       07:14:44.674    Self Organizing map (EURUSD,H1)
CS      0       07:14:44.674    Self Organizing map (EURUSD,H1) New weights
CS      0       07:14:44.674    Self Organizing map (EURUSD,H1) [[0.1937869656464888,0.8527427060068337]
CS      0       07:14:44.674    Self Organizing map (EURUSD,H1)  [0.1779676215121214,0.7964618795904062]]
CS      0       07:14:44.725    Self Organizing map (EURUSD,H1) Clusters CSV files saved under the directory Files\SOM
CS      0       07:14:44.726    Self Organizing map (EURUSD,H1) Clusters CSV files saved under the directory Files\SOM
CS      0       07:14:44.726    Self Organizing map (EURUSD,H1)
CS      0       07:14:44.726    Self Organizing map (EURUSD,H1) clusters
CS      0       07:14:44.726    Self Organizing map (EURUSD,H1) TENSOR INDEX <<0>>
CS      0       07:14:44.726    Self Organizing map (EURUSD,H1) [[1.2,2.3]
CS      0       07:14:44.726    Self Organizing map (EURUSD,H1)  [0.7,1.8]
CS      0       07:14:44.726    Self Organizing map (EURUSD,H1)  [2.8,3.899999999999999]]
CS      0       07:14:44.727    Self Organizing map (EURUSD,H1) TENSOR INDEX <<1>>
CS      0       07:14:44.727    Self Organizing map (EURUSD,H1) [[3.600000000000001,4.8]
CS      0       07:14:44.727    Self Organizing map (EURUSD,H1)  [5.2,6.7]
CS      0       07:14:44.727    Self Organizing map (EURUSD,H1)  [4.8,5.6]]
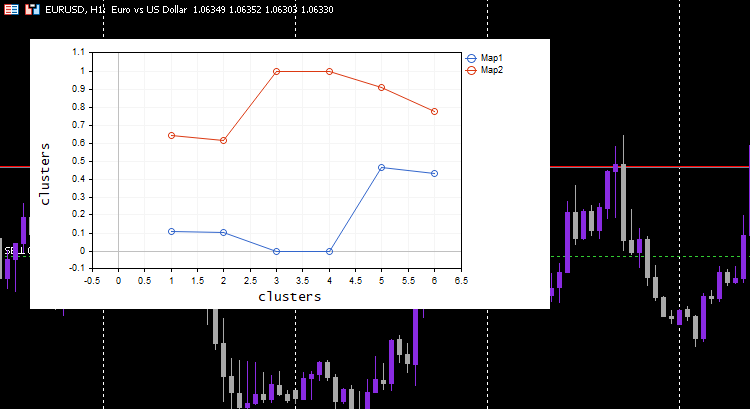
这个过程就像魔术一样工作,尽管机器学习模型采用常规化后的数据,但模型能够对数据进行聚类,并且仍然能够给出非常规化/原始数据,就是什么都没有发生。 请注意,绘制的聚类是常规化后的数据,这一点很重要,因为很难在其上绘制不同尺度的数据。 这一次,依据简单测试数据集绘制聚类要好得多;
扩展 Kohonen 映射
尽管 Kohonen 映射和其它数据挖掘技术主要不是为了尝试进行预测,因为它们含有学习的参数,这些参数是权重,我们可以扩展它们,以便当我们给它们新数据时获得聚集。
uint CKohonenMaps::KOMPredCluster(vector &v)
 {
  vector temp_v = v;
  pre_processing.Normalization(v);

  if (n != v.Size())
   {
     Print("Can't predict the cluster | the input vector size is not the same as the trained matrix cols");
     return(-1);
   }

   vector D(m); //Euclidean distance btn clusters

   for (ulong j=0; j<m; j++)
       D[j] = Euclidean_distance(v, w_matrix.Col(j));

   v.Copy(temp_v);
   return((uint)D.ArgMin());
 }

//+------------------------------------------------------------------+
//|                                                                  |
//+------------------------------------------------------------------+

vector CKohonenMaps::KOMPredCluster(matrix &matrix_)
 {
   vector v(n);

   if (n != matrix_.Cols())
      {
         Print("Can't predict the cluster | the input matrix Cols is not the same size as the trained matrix cols");
         return (v);
      }

   for (ulong i=0; i<matrix_.Rows(); i++)
      v[i] = KOMPredCluster(matrix_.Row(i));

    return(v);
 }
我们给它没有见过的新数据,您和我知道哪个聚集属于 [0.5, 1.5] 和 [5.5, 6]。 此数据分别属于聚类 0 和 1。
   maps = new CKohonenMaps(Matrix,true,2,0.01,1000); //Training

   matrix new_data = {
         {0.5,1.5},
         {5.5, 6.0}
      };

   Print("new data\n",new_data,"\nprediction clusters\n",maps.KOMPredCluster(new_data)); //using it for predictions
输出:
CS      0       07:46:00.857    Self Organizing map (EURUSD,H1) new data
CS      0       07:46:00.857    Self Organizing map (EURUSD,H1) [[0.5,1.5]
CS      0       07:46:00.857    Self Organizing map (EURUSD,H1)  [5.5,6]]
CS      0       07:46:00.857    Self Organizing map (EURUSD,H1) prediction clusters
CS      0       07:46:00.857    Self Organizing map (EURUSD,H1) [0,1]
很酷,Kohonen 映射已正确预测了它们。
策略测试器上 Kohonen 映射
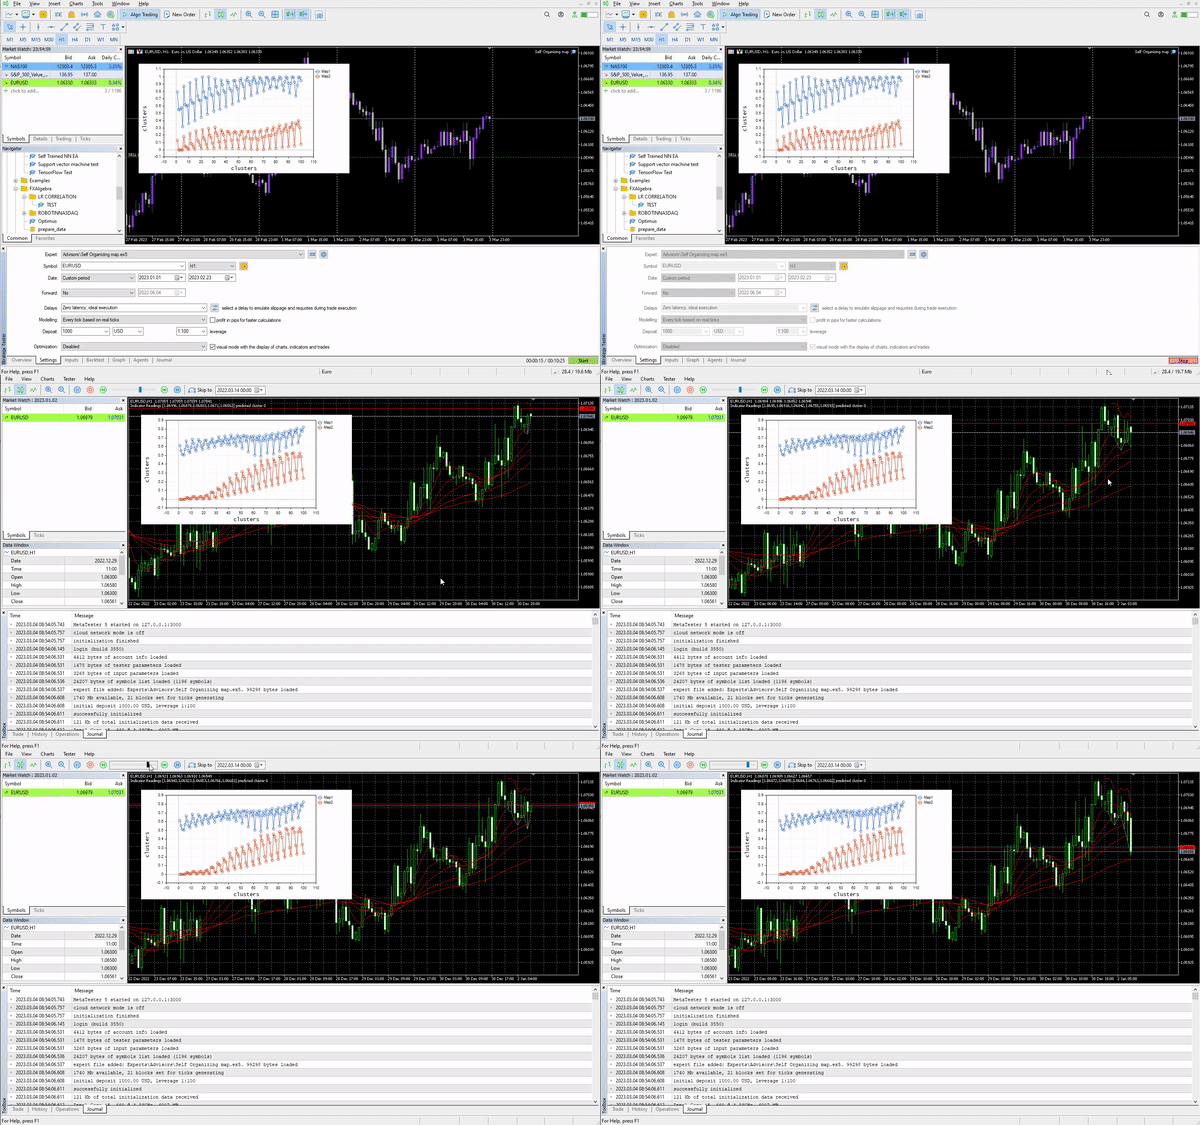
该算法运行完美,我能够注意到它在市场上涨时预测聚集 0,反之亦然,我不确定含义是否正确,我没有认真地分析行为,我把它留给你。
Kohonen 映射的优势
Kohonen 映射有几个优点,包括:
- 捕获输入数据和输出映射之间的非线性关系的能力意味着它们可以处理数据中的复杂形态和结构,这些形态和结构可能无法通过线性方法轻松捕获。
- 它们可以在数据中找到形态和结构,而无需标记数据。 这在标记数据稀缺或获取成本太高的情况下非常实用。
- 它们把输入数据映射到低维空间来帮助降低输入数据的维数,这有助于降低下游任务(如回归和分类)的计算复杂性。
- 保留输入数据和输出映射之间的拓扑关系,这意味着映射中的相邻神经元对应于输入空间中的相似区域,这有助于数据探索和可视化。
- 可以对输入数据中的噪声和异常值具有健壮性,只要噪声够大即可。
Kohonen 映射的缺点
- 最终的自组织映射品质可能对权重向量的初始化敏感,如果初始化不佳,SOM 也许会收敛到次优解、或卡在局部最小值。
- 对参数调整敏感:SOM 的性能可能对超参数的选择敏感,例如学习率、邻域函数和神经元数量。 调整这些参数可能非常耗时,并且需要领域专业知识。
- 对于大型数据集,计算成本高昂,且占用大量内存。 SOM 的大小随输入数据点的数量而缩放,因此大型数据集可能需要大量神经元和较长的训练时间。
- 缺乏正式的收敛标准:与某些机器学习算法(如神经网络)不同,SOM 没有正式的收敛标准。
底线
Kohonen 映射或自组织映射(SOM)是一种创新的交易方法,可以帮助交易者在市场上找到自己的方式。 通过使用无监督学习,Kohonen 映射可以识别市场数据中的形态和结构,令交易者能够做出明智的决策。 正如我们所看到的,Kohonen 映射能够识别数据中的非线性关系,并将数据聚类到各自的分组之中,但是,交易者应该意识到 Kohonen 映射的潜在缺点,例如对初始化的敏感性、缺乏形式收敛、以及上面讨论的其它缺点。 总体而言,Kohonen 映射有可能成为交易者工具包的宝贵补充,但与任何工具一样,应谨慎使用它们,并注意其优势和劣势。
请仔细。
在我的 GitHub 存储库 https://github.com/MegaJoctan/MALE5 上跟踪此算法的开发和变化。
| 文件 | 内容 & 用法 |
|---|---|
| Self Organizing map.mq5 | 测试本文中讨论的算法的 EA 文件。 |
| kohonen maps.mqh | 包含 kohonen 映射算法的函数库。 |
| plots.mqh | 一个函数库,其中包含在 MT5 图表上绘图的函数。 |
| preprocessing.mqh | 包含用于常规化和预处理输入数据的函数。 |
| matrix_utils.mqh | 包含用于 MQL5 中矩阵运算的附加函数。 |
| Tensors.mqh | 包含用于创建张量类的函数库。 |
参考文章:
本文由MetaQuotes Ltd译自英文
原文地址: https://www.mql5.com/en/articles/12261
注意: MetaQuotes Ltd.将保留所有关于这些材料的权利。全部或部分复制或者转载这些材料将被禁止。
本文由网站的一位用户撰写,反映了他们的个人观点。MetaQuotes Ltd 不对所提供信息的准确性负责,也不对因使用所述解决方案、策略或建议而产生的任何后果负责。
