Range Contraction Break
- Индикаторы
-
Ich Khiem Nguyen
 🚀 ТОРГУЙТЕ С EXNESS — ПОЛУЧАЙТЕ ДОСТУП К ПРЕИМУЩЕСТВАМ ALPHAONCHART
Ищете удобную торговую платформу и хотите получить доступ к дополнительным торговым инструментам и поддержке?
Зарегистрируйтесь в Exness по ссылке ниже, чтобы получить доступ к программе преимуществ AlphaOnChart: - Версия: 1.0
- Активации: 10
Range Contraction Breakout MT5
Algorithmic Breakout Detection Engine via Structural Range Compression
The Range Contraction Breakout indicator for MetaTrader 5 provides a structured analytical framework designed to identify directional breakout opportunities emerging from market consolidation phases. Financial assets typically cycle between volatility compression and directional expansion. During narrow consolidation intervals, manual identification of genuine structural expansion points across multiple charts is challenging and prone to market noise.
This software systematically detects consecutive candle-range contraction cycles and confirms the transition into directional expansion strictly upon candle close, delivering fully non-repainting signals.
Algorithmic Logic and Trade Validation
The calculation engine operates exclusively on closed bar data. Historical signal markers remain anchored to their respective price bars and do not recalculate, repaint, or shift over time.
Bullish Expansion Setup (BUY)
- Contraction Phase: The algorithm detects consecutive narrowing candle ranges reflecting market compression.
- Breakout Trigger: A bullish expansion candle closes strictly above the upper boundary of the identified contraction range.
- Execution Reference: Confirmation occurs precisely at the bar close. The opening price of the immediate subsequent candle serves as the execution reference.
Bearish Expansion Setup (SELL)
- Contraction Phase: The algorithm detects consecutive narrowing candle ranges reflecting market compression.
- Breakout Trigger: A bearish expansion candle closes strictly below the lower boundary of the identified contraction range.
- Execution Reference: Confirmation occurs precisely at the bar close. The opening price of the immediate subsequent candle serves as the operational reference.
Integrated Risk Management Framework
Rather than displaying isolated visual markers, the indicator projects an end-to-end trade execution structure directly onto the active chart:
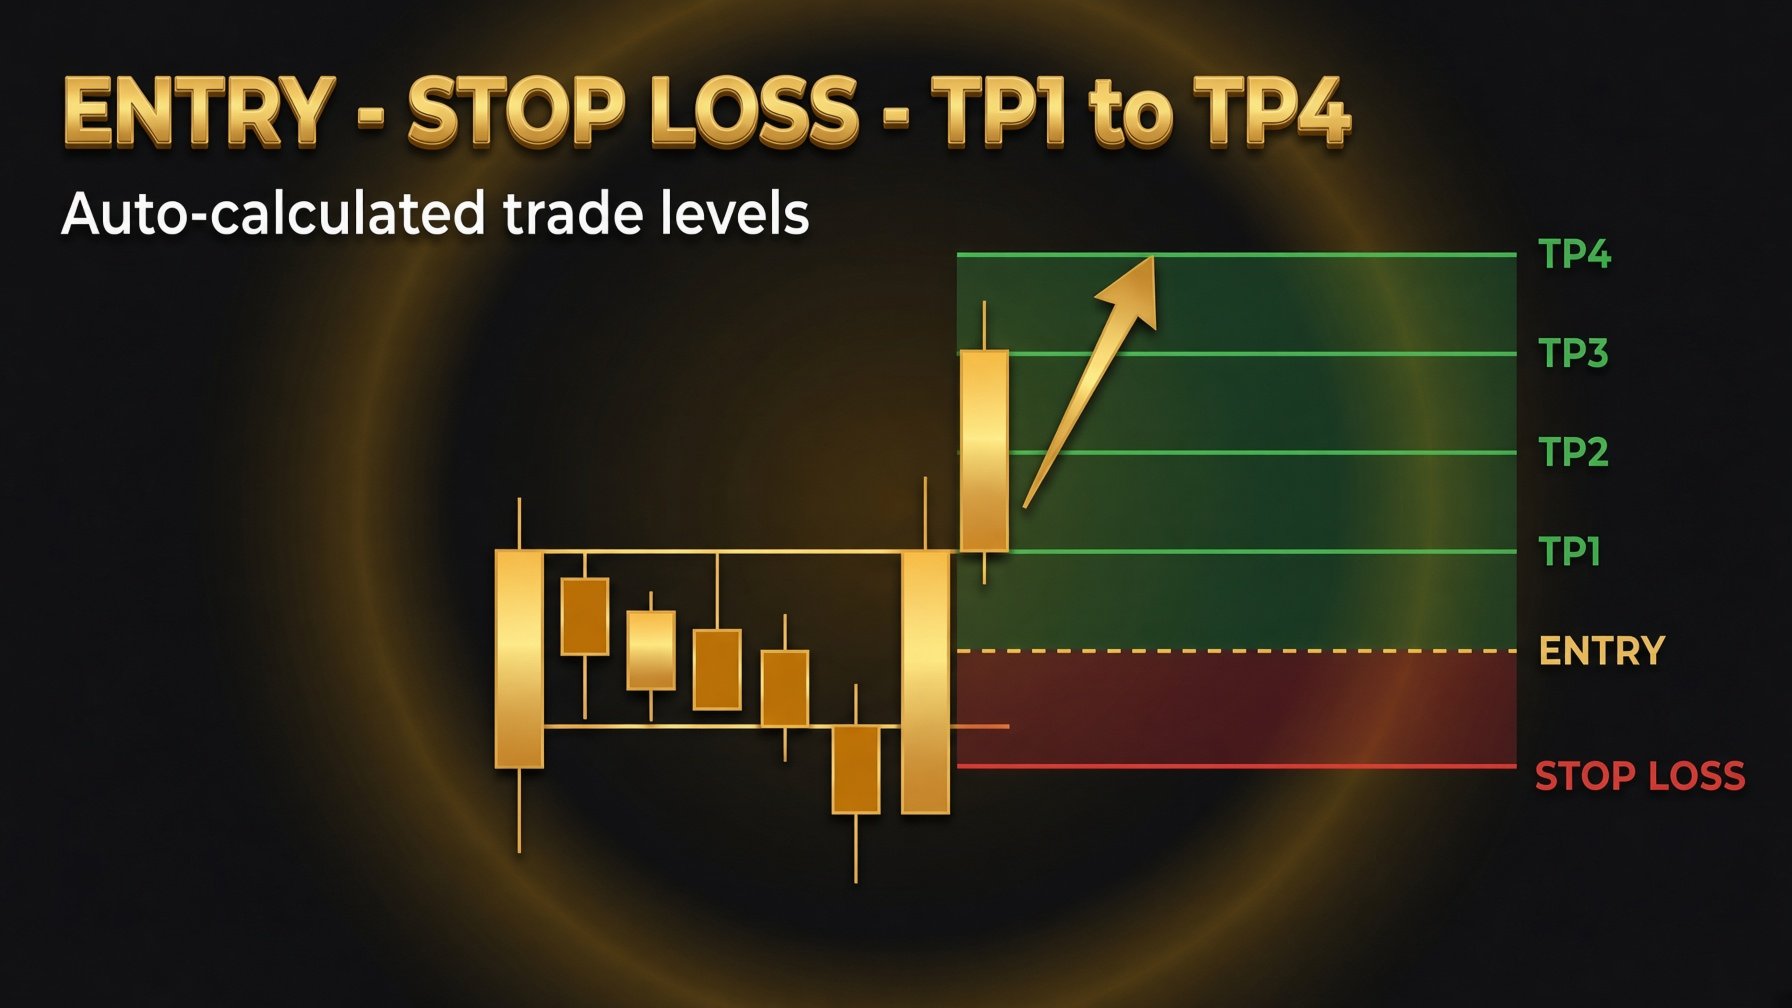
- Dynamic Structural Invalidation (Stop Loss): The Stop Loss boundary is anchored to recent structural swing points within the contraction zone. An optional user-defined volatility buffer can be applied to provide clearance beyond key price extremes.
- Standardized 4-Tier R-Multiple Targets: The system automatically projects four standardized profit objectives derived from the initial calculated risk:
- TP1 (0.5R): Conservative initial target / partial scaling reference.
- TP2 (0.8R): Structural liquidity target.
- TP3 (1.2R): Core trend expansion objective.
- TP4 (2.0R): Extended trend continuation objective.
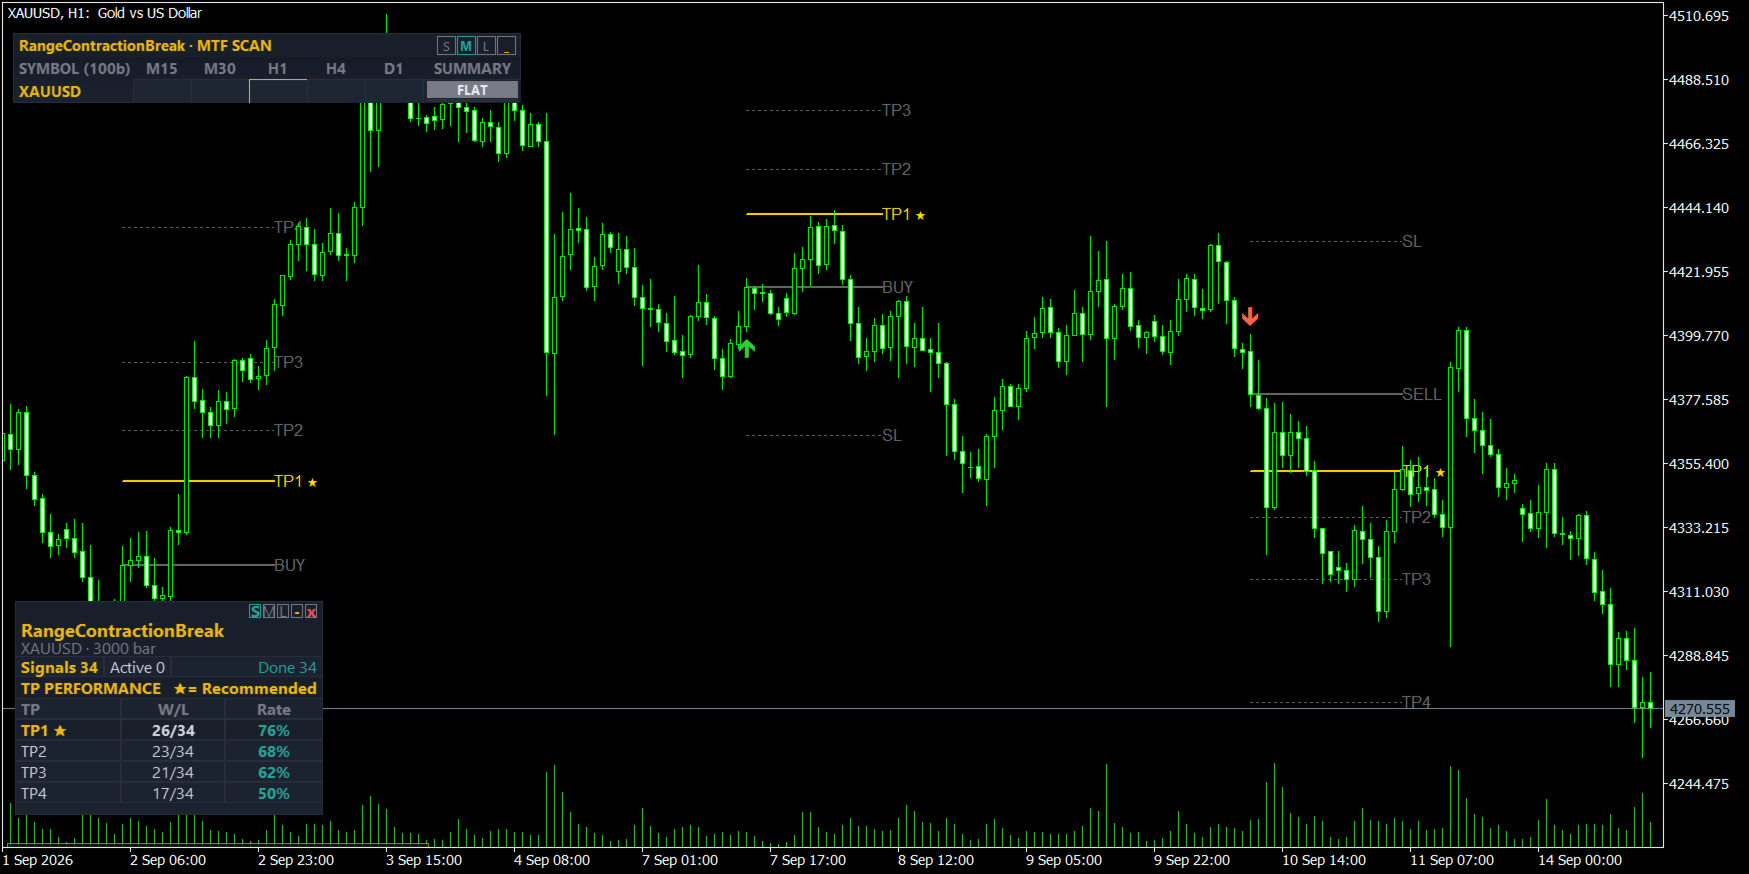
- Lifecycle State Tracking: Each setup is tracked visually on-chart with dedicated lifecycle states (Active, TP Hit, SL Hit).
Analytical Modules and Capabilities
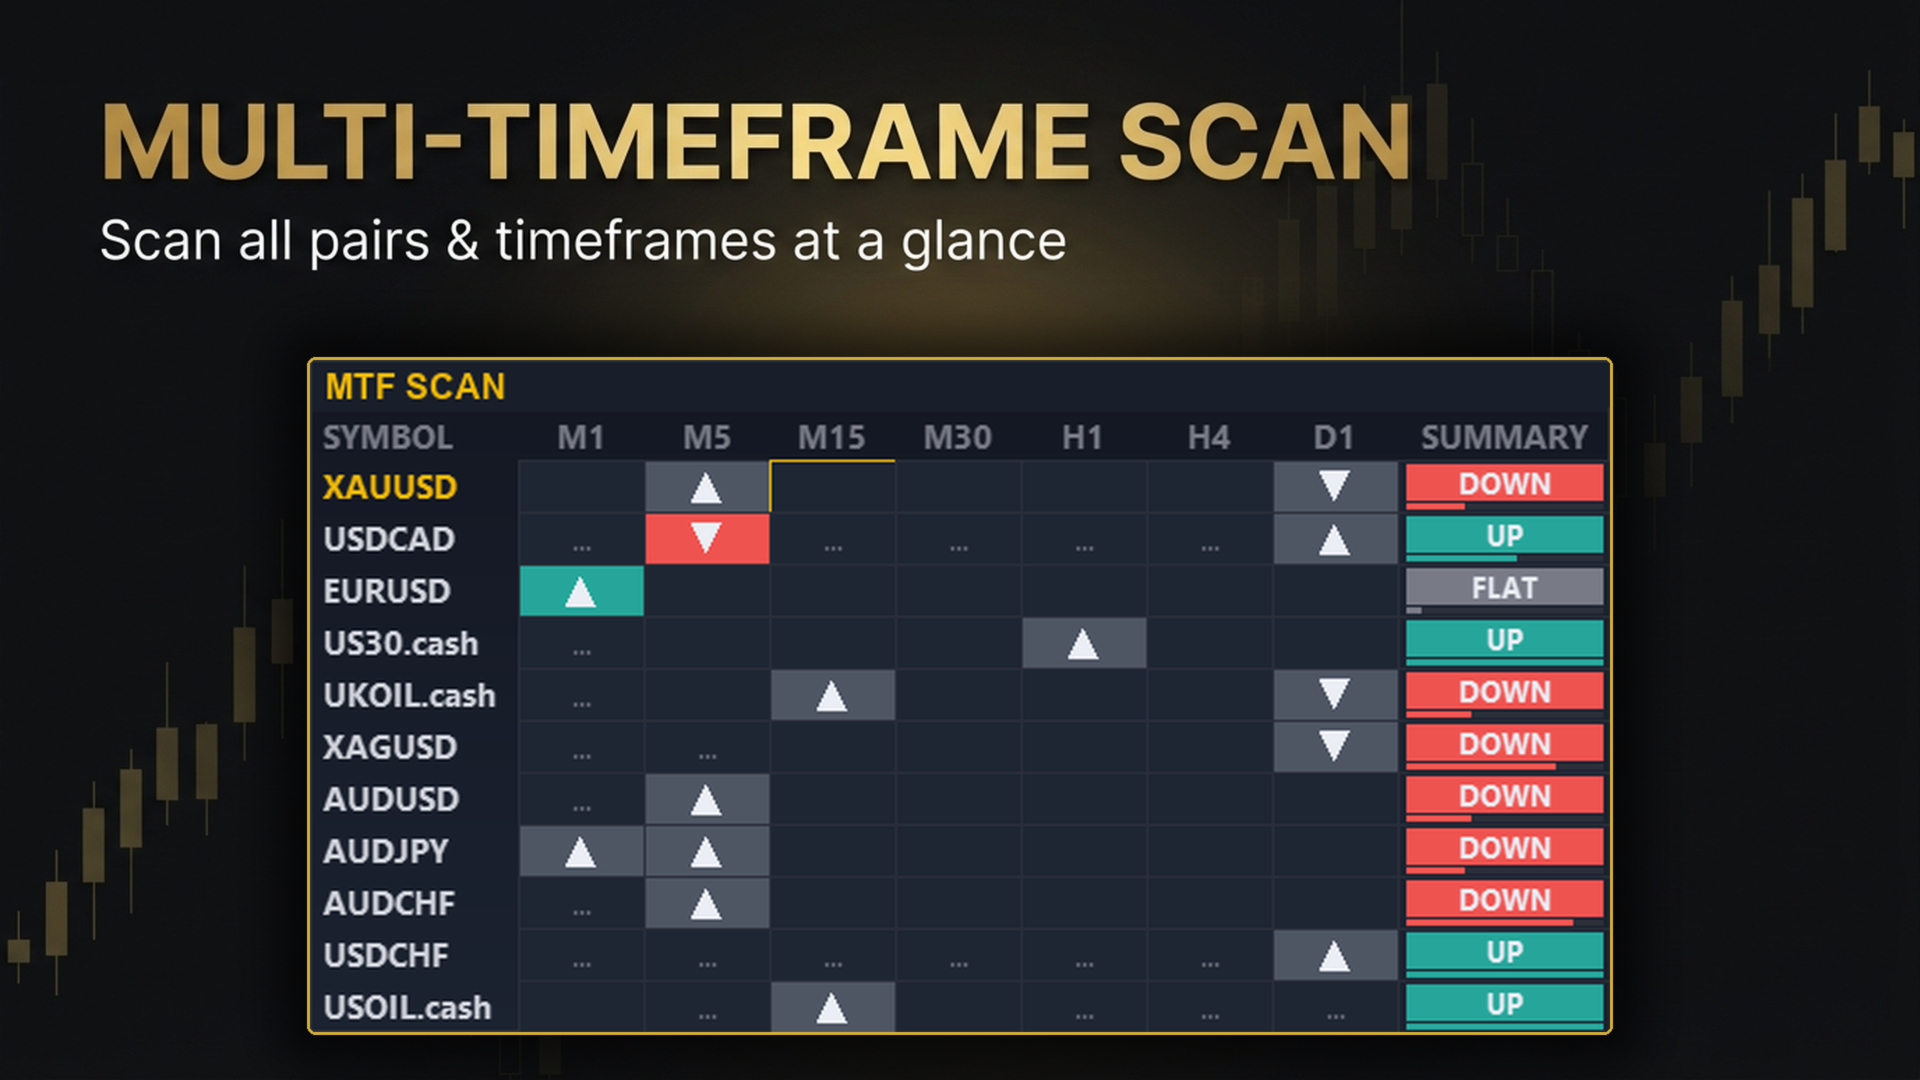
Multi-Symbol & Multi-Timeframe Scanner Dashboard
- Monitors multiple assets simultaneously across standard timeframes: M15, M30, H1, H4, and D1.
- Active Signal Discovery: Displays active BUY and SELL setups across all monitored symbols from a single workspace.
- Signal Status Tracking: Displays real-time progress of active trades (active, approaching TP, approaching SL).
- Higher Timeframe Confluence: Identifies directional confluence between lower-timeframe entry triggers and higher-timeframe trends.
- Market Bias Summary: Evaluates market conditions with an integrated directional reading (UP, DOWN, or FLAT).
- One-Click Chart Navigation: Clicking any dashboard cell immediately switches the active chart to the selected symbol and timeframe.
Whipsaw Mitigation (Signal Brake)
- Suppresses rapid, alternating BUY/SELL flip-flopping during tight consolidation ranges.
- Restricts redundant same-direction signals while a prior trade setup remains active.
- Enforces a minimum structural R-distance before a subsequent setup can trigger.
On-Chart Historical Backtest Panel
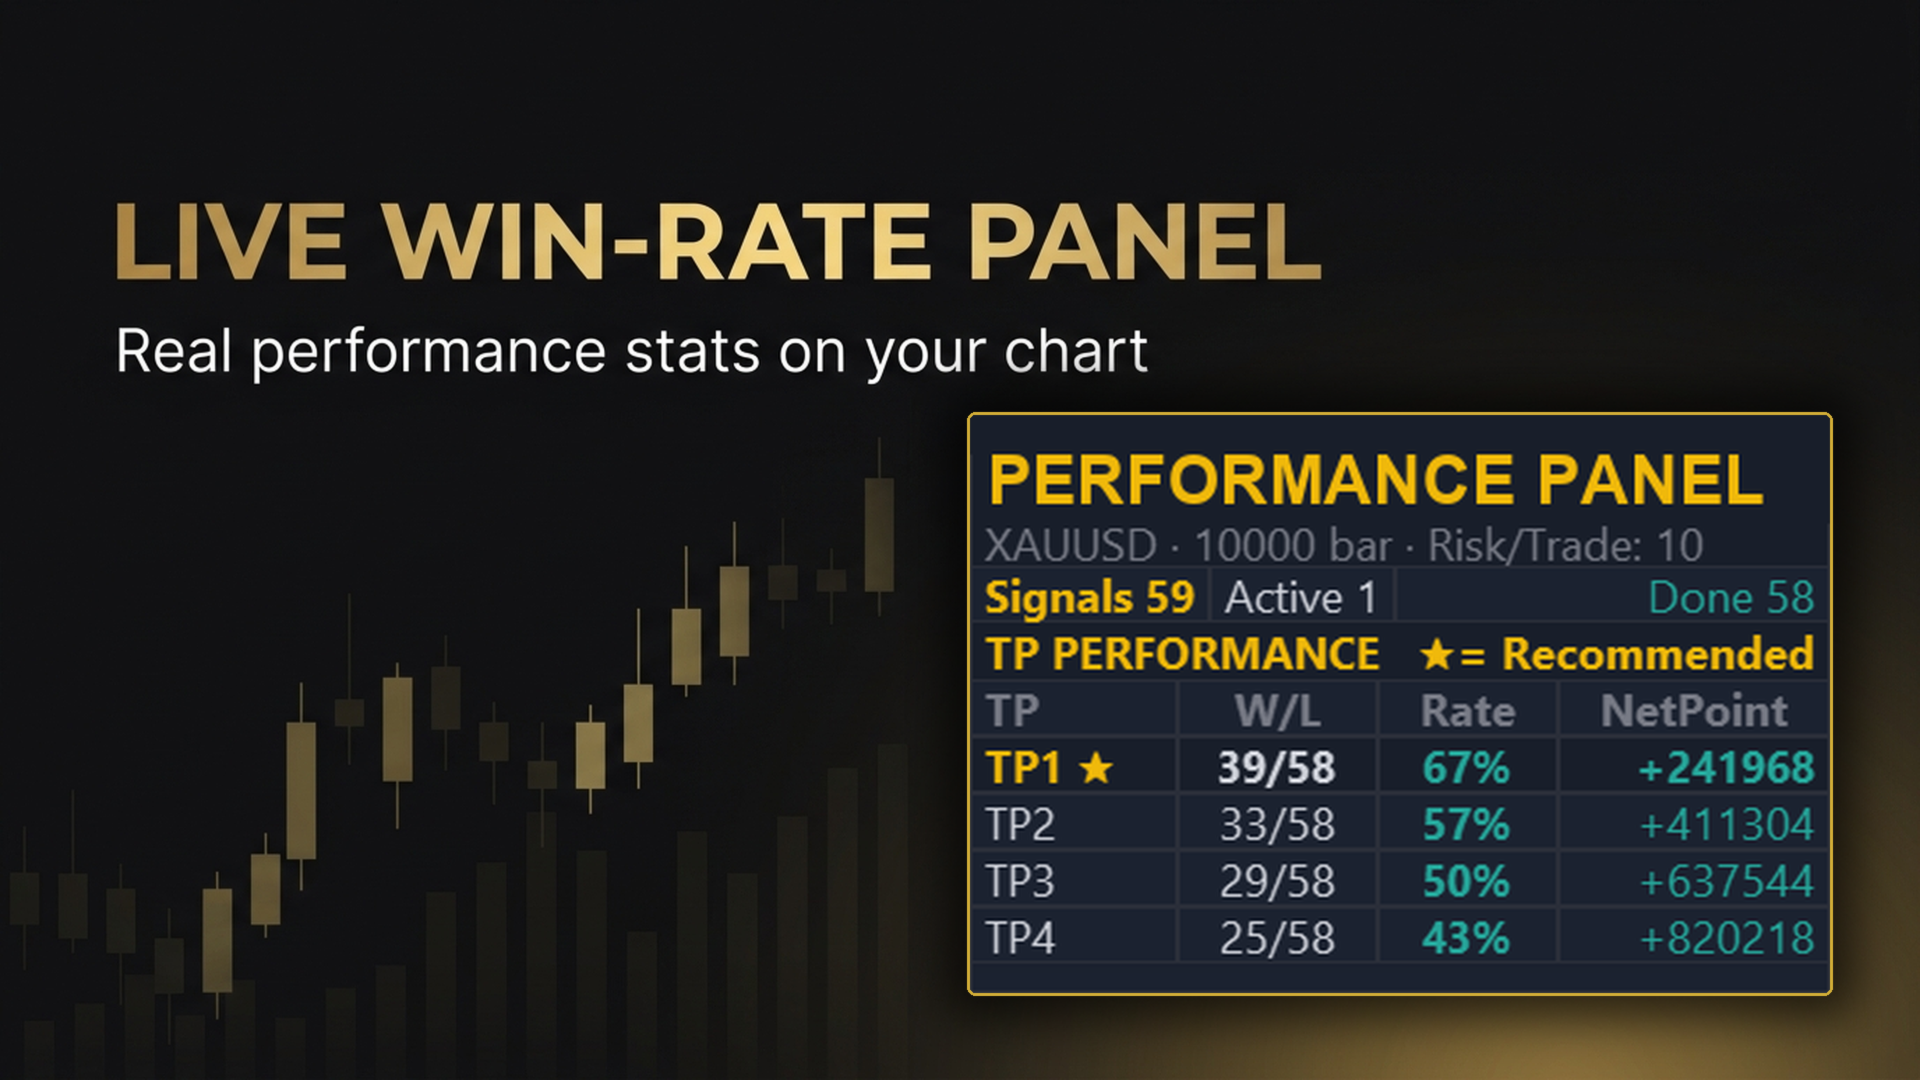
- An integrated panel summarizing historical performance for the currently applied settings:
- Historical hit-rate breakdown across TP1, TP2, TP3, and TP4.
- Sample size display over the configured lookback horizon.
- Identifies the historically optimal TP tier for the selected sample.
- Sample-size indicator to assist in evaluating statistical relevance.
Notice on Historical Data: These statistics reflect past price data for the tested symbol, timeframe, and settings only. Past results do not guarantee future performance.
Multi-Channel Alert Architecture
- MetaTrader 5 desktop pop-up notifications.
- Terminal audible alerts (.wav).
- Instant push notifications sent to mobile devices via MetaQuotes ID.
Non-Intrusive Graphic Interface
- Three pre-configured display presets: Small (S), Medium (M), and Large (L).
- One-click minimize and expand toggle.
- Draggable control panel that preserves custom chart coordinates across timeframe changes.
Operational Specifications
- Recommended Assets: High-liquidity instruments including major currency pairs, spot commodities, and major stock indices.
- Recommended Timeframes: M15, M30, and H1 provide balanced structural clarity with minimal false breakouts.
- Broker Environment: Compatible with both Netting and Hedging accounts. Low-spread ECN/Raw accounts are recommended to maximize target realization fidelity.
Support and Free Demo
- A free demo version can be evaluated directly in the Strategy Tester and on demo charts through the standard MQL5 Market demo feature.
- For setup inquiries or technical support, please send a message through the author's MQL5 profile.