Native Channels
- 지표
- 버전: 1.10
- 업데이트됨: 2 8월 2024
- 활성화: 7

This indicator recognizes all support and resistance levels.
A number of unique high-performance techniques have been applied, which made the existence of this indicator possible.
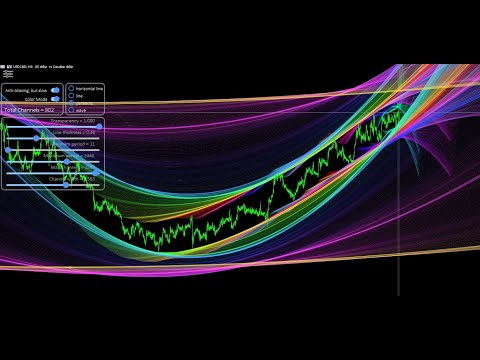
All formed channels are naturally visible:
- horizontal linear
- linear
- parabolic
- cubic (Polynomial 3 degrees - Wave)
This is due to a bundle of approximating channels.
The formed channels form "standing waves" in a hierarchical sequence.
Thus, all support and resistance levels are visible.
All parameter management is implemented by a user-friendly graphical interface. The parameters are saved when switching timeframes.
This indicator can be tested quite satisfactorily in the tester when downloading the free demo version, although its normal operation is much more productive and comfortable.
Additional key control:
- Press Ctrl and move the mouse to change the start position of the channel bundle.
- Key "H" - (Hidden) quick turn off / turn on the indicator. This can sometimes come in handy if you use other indicators on the same chart.
- Key "G" - (Grid) quick enable/disable grid and period separators
- Key "0" - horizontal linear channel (zero-degree polynomial)
- Key "1" - linear channel (polynomial of the first degree)
- Key "2" - parabolic channel (polynomial of the second degree)
- Key "3" - wave channel (third-degree polynomial)
There are two color modes:
- Each formed channel has its own color to easily distinguish the channel hierarchy.
- All channels have a red upper border and a green lower border to distinguish between support and resistance levels.
My recommendation is to use a parabolic channel with a channel width of 2 (two standard deviations - the lowest slider)

Ogni grafico e' un opera d'arte. Ma oltre all'estetica, e' un formidabile indicatore delle tendenze,evidenziando in tutte le sue sfumature supporti e resistenze che parlano un loro linguaggio 10 stelle!!!