Berma Bands

5

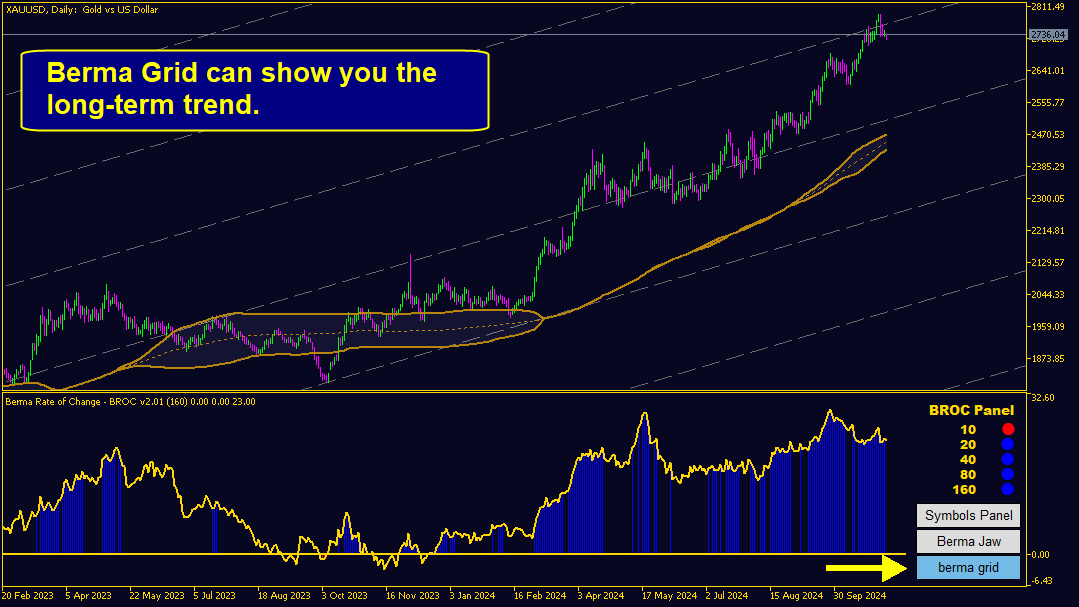
Berma Bands(BBs) 지표는 시장 동향을 파악하고 이를 활용하려는 트레이더에게 귀중한 도구입니다. 가격과 BBs 간의 관계를 분석함으로써 트레이더는 시장이 추세 단계인지 범위 단계인지를 분별할 수 있습니다.

자세한 내용을 알아보려면 [ Berma Home Blog ]를 방문하세요.

버마 밴드는 세 개의 뚜렷한 선으로 구성되어 있습니다. 어퍼 버마 밴드, 미들 버마 밴드, 로어 버마 밴드입니다. 이 선들은 가격 주위에 그려져 전체 추세에 대한 가격 움직임을 시각적으로 표현합니다. 이 밴드들 사이의 거리는 변동성과 잠재적인 추세 반전에 대한 통찰력을 제공할 수 있습니다.

버마 밴드 라인이 각각에서 분리될 때, 그것은 종종 시장이 횡보 또는 범위 이동 기간에 접어들고 있음을 시사합니다. 이는 명확한 방향 편향이 없음을 나타냅니다. 트레이더는 이러한 기간 동안 추세를 파악하기 어려울 수 있으며 더 명확한 추세가 나타날 때까지 기다릴 수 있습니다.

버마 밴드 라인이 단일 라인으로 수렴할 때, 종종 강력한 추세 환경을 나타냅니다. 이러한 수렴은 가격이 추세에 따라 움직일 만큼 변동성이 크기 때문에 명확한 방향 편향을 나타냅니다. 트레이더는 이러한 기간 동안 잠재적인 진입 및 종료 지점을 식별하기가 더 쉬울 수 있습니다. 추세의 모멘텀이 유리한 거래 기회를 제공할 수 있기 때문입니다. 그러나 전체 추세 내에서 잠재적인 풀백 또는 수정을 염두에 두는 것이 중요합니다.

버마 밴드는 상단 및 하단 밴드와의 가격 캔들 상호작용을 기반으로 명확한 매수 및 매도 신호를 제공합니다. 매수 신호는 가격 캔들이 처음으로 상단 버마 밴드 위에서 마감되어 잠재적인 상승 추세를 나타낼 때 발생합니다. 반대로 매도 신호는 가격 캔들이 처음으로 하단 버마 밴드 아래에서 마감되어 잠재적인 하락 추세를 나타낼 때 생성됩니다. 트레이더는 이러한 신호를 포지션 진입 또는 종료를 위한 가이드로 사용할 수 있지만, 트레이딩 결정을 내릴 때 다른 요소와 위험 관리 전략을 고려하는 것이 필수적입니다.

Berma Bands는 매수 및 매도 신호에 대한 실시간 알림을 제공하여 거래 효율성을 높일 수 있습니다. 이는 사운드 알림, 모바일 알림 또는 이메일 알림을 통해 달성할 수 있습니다. 이러한 알림은 거래자가 거래 화면에서 떨어져 있을 때에도 잠재적인 거래 기회에 대해 계속 알 수 있도록 도와 시장 움직임에 신속하게 대응할 수 있습니다.

베르마 밴드의 가장 중요한 투입물.

BB 캔들[최소 =2]: 밴드 계산에 사용된 캔들 수입니다. 2개 미만이면 표시기가 메시지를 인쇄하고 이 매개변수는 기본값(=160)으로 재설정됩니다.

화살표 및 수직선 표시:
이 매개변수를 사용하면 차트에서 잠재적인 매수 및 매도 신호를 볼 수 있습니다. 하나 또는 둘 다 표시하도록 선택할 수 있습니다.

차트 색상 구성표: 여기에서 차트를 더욱 전문적으로 보이게 할 기성 색상 구성표를 찾을 수 있습니다. 자신의 색상을 사용하고 싶다면 (아무것도 하지 않음)을 선택할 수 있습니다.

질문이 있으시면 개인 메시지를 통해 저에게 연락하시거나, 댓글 섹션에 글을 남겨주세요. 온라인이 되는 즉시 여러분의 메시지에 답장하겠습니다.


리뷰 36
equalitygr
194
equalitygr 2026.05.11 10:59 
 

Very simple and successful system.

I am updating my review that I have added 2 hours before.

Not only is this system the best and the simplest that I have ever seen, but the support of the developer is unbelievable. He is helping me a lot, giving me many examples and giving me tips for every detail of this system.

I am not an affiliate with this indicator.

123478888
19
123478888 2026.02.19 19:07 
 

Excellent and highly accurate trend indicator. Easy to use and provides clear signals. Highly recommended 👍

Juergen Loebach
1321
Juergen Loebach 2025.09.18 11:34 
 

The manual and video clips are particularly Very useful for beginners. indicator delivered very good results in the test.

추천 제품
RBreaker
Zhong Long Wu
RBreaker Gold Indicators는 금 선물을 위한 단기 데이 트레이딩 전략으로, 추세 추종과 데이 내 반전의 두 가지 거래 방식을 결합합니다. 추세 장에서 수익을 포착할 수 있을 뿐만 아니라, 시장이 반전될 때 적시에 이익을 확정하고 추세에 맞춰 반대 포지션을 잡을 수 있습니다. 이 전략은 미국 잡지 Futures Truth에서 15년 연속으로 가장 수익성 높은 트레이딩 전략 상위 10위 안에 선정되었습니다. 긴 라이프사이클을 자랑하며, 현재까지 국내외에서 널리 사용되고 연구되고 있습니다. 본 지표는 2026년 금 선물의 움직임을 반영하여 14일 ATR 지표를 기반으로 돌파 계수 A, 관찰 계수 B, 반전 계수 R을 보다 합리적인 값으로 정의했습니다. 매우 훌륭한 지표이며, 안정적인 연간 수익성을 달성했습니다. 강력히 추천합니다~ 위 지표는 변동성이 높은 상품에 적합하며, 매개변수는 금 선물, 주가 지수 선물 등에 적합합니다. 다른 상품이 필요한 경우 돌파 계수 A
CosmiCLab FIBO
Kirils Subins
CosmiCLab SMC FIBO CosmiCLab SMC FIBO is a professional trading indicator designed for traders who use Smart Money Concepts (SMC), market structure analysis and Fibonacci retracement levels. The indicator automatically detects market swings and builds Fibonacci levels based on the latest impulse movement. It also identifies market structure changes such as BOS (Break of Structure) and CHOCH (Change of Character), helping traders understand the current market direction. CosmiCLab SMC FIBO also pr
Fibaction
Abdelkhalek Orabi
Indicator Name: Fibaction – price action candle Detector Description: Fibo Signal Boxes is a powerful Smart Money Concept (SMC)-inspired indicator that auto-detects price action candles. bullish hammers and shooting stars, then draws precise Fibonacci entry zones and multiple take-profit levels directly on the chart. as for the SL personally i use 40 pips rules  Key Features: Detects bullish hammer and shooting star reversal candles. Automatically draws Fibonacci entry and TP boxes. as
"Impulses and Corrections 5" is created to help traders navigate the market situation. The indicator shows multi-time frame upward and downward "Impulses" of price movements. These impulses are the basis for determining the "Base" , which is composed of zones of corrections of price movements, as well as "Potential" zones for possible scenarios of price movement. Up and down impulses are determined based on a modified formula of Bill Williams' "Fractals" indicator. The last impulse is always "U
Trend Master V2
Oratile Pitsoane
What Is Trend Master Pro? Trend Master Pro   is a professional-grade trend trading indicator built for MetaTrader 5. It was designed with one goal in mind — to keep you on the right side of the market at all times by combining three powerful technical tools into a single, clean, easy-to-read display directly on your price chart. Instead of cluttering your screen with multiple separate indicators, Trend Master Pro fuses an   EMA Ribbon trend filter , a   ZigZag swing point engine , and a   breako
This trading indicator is non-repainting, non-redrawing, and non-lagging, making it an ideal choice for both manual and automated trading. It is a Price Action–based system that leverages price strength and momentum to give traders a real edge in the market. With advanced filtering techniques to eliminate noise and false signals, it enhances trading accuracy and potential. By combining multiple layers of sophisticated algorithms, the indicator scans the chart in real-time and translates comple
Automated Trendlines MT5
Georgios Kalomoiropoulos
추세선은 외환 거래에서 기술적 분석의 가장 필수적인 도구입니다. 불행히도, 대부분의 거래자는 올바르게 그리지 않습니다. 자동 추세선 표시기는 시장의 추세 움직임을 시각화하는 데 도움이 되는 진지한 거래자를 위한 전문 도구입니다. 추세선 강세 추세선과 약세 추세선에는 두 가지 유형이 있습니다. 상승 추세에서 Forex 추세선은 가격 움직임의 가장 낮은 스윙 포인트를 통해 그려집니다. 최소 두 개의 "최저 저점"을 연결하면 추세선이 생성됩니다. 하락 추세에서 추세선은 가격 움직임의 가장 높은 스윙 포인트를 통해 그려집니다. 최소 두 개의 "최고 최고점"을 연결하면 추세선이 생성됩니다. 추세선이 깨질 때? 강세 추세선은 약세 양초가 강세 추세선 아래에서 닫히고 양초의 고점이 추세선 위에 있을 때 깨집니다. 약세 추세선은 강세 양초가 약세 추세선 위로 마감되고 양초 저점이 추세선 아래에 있을 때 깨집니다. 추세선이 삭제되면? 강세 추세선은 전체 양초가 강세 추세선 아래에
Scan pattern
VLADISLAV AKINDINOV
The indicator is designed to help in making a decision on the direction of trading (buy or sell). It is a history scanner that searches for matches of the current pattern (combination of several current bars) with historical data in percentage terms by the relative vertical position of candles relative to each other, the size of each candle, the size of the candle body and the candle shadows. In history, the matches found are indicated by vertical lines on the candle of the beginning of the soug
Your Trend Friend
Luigi Nunes Labigalini
5 (1)
The trend is your friend! Look at the color of the indicator and trade on that direction. It does not  repaint. After each candle is closed, that's the color of the trend. You can focus on shorter faster trends or major trends, just test what's most suitable for the symbol and timeframe you trade. Simply change the "Length" parameter and the indicator will automatically adapt. You can also change the color, thickness and style of the lines. Download and give it a try! There are big movements w
MT5용 Crypto_Forex 지표 PINBAR 패턴, 재도색 및 지연 없음. - "PINBAR 패턴" 지표는 가격 변동 거래에 매우 강력한 지표입니다. - 이 지표는 차트에서 다음과 같은 핀바를 감지합니다. - 상승 핀바 - 차트에 파란색 화살표 신호(그림 참조). - 하락 핀바 - 차트에 빨간색 화살표 신호(그림 참조). -   PC 및 모바일 알림 기능 포함. - "PINBAR 패턴" 지표는 지지/저항 레벨과 결합하기 매우 좋습니다. ................................................................................ 여기를 클릭하여 고품질 트레이딩 로봇과 지표를 확인하세요! MQL5 웹사이트에서만 제공되는 오리지널 상품입니다.
Trade smarter, not harder: Empower your trading with Harmonacci Patterns This is arguably the most complete harmonic price formation auto-recognition indicator you can find for the MetaTrader Platform. It detects 19 different patterns, takes fibonacci projections as seriously as you do, displays the Potential Reversal Zone (PRZ) and finds suitable stop-loss and take-profit levels. [ Installation Guide | Update Guide | Troubleshooting | FAQ | All Products  ] It detects 19 different harmonic pric
RamLalla Magic Trend Indicator Overview RamLalla Magic Trend  is a sophisticated trend-following indicator that combines the power of CCI (Commodity Channel Index) and ATR (Average True Range) to create dynamic trend lines with visual cloud formations. This indicator provides clear trend direction signals through color-coded lines and fills, making it easier for traders to identify market momentum shifts. This stands out from the standard Super Trend Indicator. Key Features The indicator uses a
My products:   https://www.mql5.com/ru/users/astra077/seller In the product line: Candlestick Pattern Detector   — a free basic version. Candlestick Patterns Standard   — a paid single-chart version with extended patterns and filters:  https://www.mql5.com/ru/market/product/174530 Japanese Candlestick Patterns Pro MT5   — a professional single-chart version with a summary table:  https://www.mql5.com/ru/market/product/173411 Multi-Currency Candlestick Pattern Scanner   — the ultimate version: a
SMC Venom Model BPR 지표는 Smart Money(SMC) 개념 내에서 일하는 트레이더를 위한 전문 도구입니다. 가격 차트에서 두 가지 주요 패턴을 자동으로 식별합니다. FVG (공정 가치 갭)는 3개의 캔들의 조합으로, 첫 번째와 세 번째 캔들 사이에 갭이 있습니다. 이는 볼륨 지원이 없는 레벨 사이에 구역을 형성하여 종종 가격 수정으로 이어집니다. BPR (균형 가격 범위)은 두 개의 FVG 패턴의 조합으로, "브리지"를 형성합니다. 이는 가격이 낮은 볼륨 활동으로 움직일 때 브레이크아웃과 레벨로의 복귀 구역으로, 캔들 사이에 갭을 생성합니다. 이러한 패턴은 거래자가 차트에서 거래량과 가격 역학을 분석하여 주요 지지/저항 수준, 돌파 구역 및 진입 지점을 식별하는 데 도움이 되며, 여기서 대형 시장 참여자와 일반 참여자 간의 상호 작용이 발생합니다. 이 지표는 사각형과 화살표 형태로 패턴을 시각화하며 유연한 경고 설정도 지원합니다. 주요 특징: 패턴 표시 모드
Inverted_Chart_EA Utility Expert Advisor Inverted_Chart_EA creates and maintains a mirror-inverted chart of any symbol and timeframe. It automatically generates a custom instrument (e.g. US30_INV ) and keeps its price history updated in real time, with bars mirrored around a chosen pivot. This utility gives traders a new way to analyze the market from a different perspective by flipping the chart upside down. Why use an inverted chart? Highlight hidden patterns – price formations that look ordin
Trend Line Map Pro MT5
STE S.S.COMPANY
4.09 (11)
트렌드 라인 맵 표시기는 트렌드 스크리너 표시기의 애드온입니다. Trend screener(Trend Line Signals)에 의해 생성된 모든 신호에 대한 스캐너로 작동합니다. Trend Screener Indicator 기반의 Trend Line Scanner입니다. Trend Screener Pro 표시기가 없으면 Trend Line Map Pro가 작동하지 않습니다. It's a Trend Line Scanner based on Trend Screener Indicator. If you don't have Trend Screener Pro Indicator,     the Trend Line Map Pro will not work . MQL5 블로그에 액세스하여 추세선 지도 표시기의 무료 버전을 다운로드할 수 있습니다. Metatrader Tester 제한 없이 구매하기 전에 사용해 보십시오. : 여기를 클릭하세요 1. 쉽게 얻을 수 있는 이점 통화 및 시간 프레
Unlock the Market's Hidden Blueprint with Advanced Pattern Recognizer Tired of staring at charts, struggling to spot high-probability trading opportunities? What if you had a professional analyst scanning the markets 24/7, drawing perfect trendlines, and calculating precise profit targets for you? Introducing Advanced Pattern Recognizer for MetaTrader 5 – Your Automated Technical Analysis Powerhouse. This isn't just another indicator. It's a sophisticated algorithmic engine designed to do the he
SMC Smart Flow Pro
Thitipong Nookhunthod
Short Description: SMC Smart Flow Pro is an advanced Smart Money Concept indicator that automatically detects Break of Structure (BOS), Change of Character (CHoCH), and projects precise TP/SL target levels on all timeframes — built for serious traders who trade with institutional flow. Full Description: SMC Smart Flow Pro is a premium Smart Money Concept (SMC) indicator for MetaTrader 5, engineered for traders who want to trade alongside institutional order flow. By automatically mapping m
PZ Support Resistance MT5
PZ TRADING SLU
3.71 (7)
Unlock key market insights with automated support and resistance lines Tired of plotting support and resistance lines? This is a multi-timeframe indicator that detects and plots supports and resistance lines in the chart with the same precision as a human eye would. As price levels are tested over time and its importance increases, the lines become thicker and darker, making price leves easy to glance and evaluate. [ Installation Guide | Update Guide | Troubleshooting | FAQ | All Products  ] Boo
NeuralTick의 CleanTrend — 과거를 절대 다시 그리지 않는(No Repaint) 추세 지표입니다. 역사적으로는 아름답게 보이지만 실제 거래에서는 신호를 다시 그리는 지표들에 지치셨나요? 소음과 속임수에 지친 트레이더들이 CleanTrend를 선택하는 세 가지 이유: 100% 다시 그리지 않음. 라인 색상이 영원히 고정됩니다. 어떤 바(bar)도 사후에 변경되지 않습니다 — 전략 테스터에서 직접 확인하세요. 이중 노이즈 필터. 가격이 설정된 임계값(MinMove)을 초과 하고 여러 바(ConfirmBars)에 걸쳐 방향을 유지한 경우에만 신호가 나타납니다. 횡보장에서의 「톱니」 현상과 이별하세요. 상황을 놓치지 않는 알림 시스템. 팝업 창, 소리, 저널 기록, 스마트폰으로의 푸시 알림(MetaTrader 5 앱). 터미널이 종료되어 있어도 추세 변화를 즉시 파악할 수 있습니다. CleanTrend는 차트를 패널로 어지럽히지 않습니다 — 깔끔한 컬러
Has rsi signal
Evgenii Savinov
HAS RSI Signal — SL/TP 자동 계산 기능이 포함된 전문 트렌드 지표 HAS RSI Signal 은 검증된 클래식 지표와 현대적인 노이즈 필터링 알고리즘을 결합한 강력한 트레이딩 도구입니다. 이 지표는 Heiken Ashi Smoothed (HAS) 캔들과 RSI 오실레이터를 통해 시장을 분석하며, 추세 반전이나 과매수/과매도 구간 이탈 시 트레이더에게 명확한 진입 신호를 제공합니다. 주요 장점: 이중 필터링: Heiken Ashi Smoothed를 사용하여 시장의 '노이즈'를 제거하고, RSI를 통해 모멘텀의 강도를 확인합니다. 자동 레벨 계산: 단순히 신호만 주는 것이 아니라, 변동성( ATR )을 기반으로 최적의 손절매(Stop Loss) 및 이익 실현(Take Profit) 레벨을 자동으로 계산합니다. 시각적 편의성: 신호가 차트 위에 컬러 캔들 형태로 직접 표시되어 복잡하지 않고 직관적으로 추세를 파악할 수 있습니다. 알림 시스템: 터미널 알람, 사운드, 스마
Noize Absorption Index
Ekaterina Saltykova
Noize Absorption Index - is the manual trading system that measures the difference of pressure between bears forces and bulls forces. Green line - is a noize free index that showing curent situation. Zero value of index shows totally choppy/flat market.Values above zero level shows how powerfull bullish wave is and values below zero measures bearish forces.Up arrow appears on bearish market when it's ready to reverse, dn arrow appears on weak bullish market, as a result of reverse expectation.
FFx Patterns Alerter gives trade suggestions with Entry, Target 1, Target 2 and StopLoss .... for any of the selected patterns (PinBar, Engulfing, InsideBar, OutsideBar) Below are the different options available: Multiple instances can be applied on the same chart to monitor different patterns Entry suggestion - pips to be added over the break for the entry 3 different options to calculate the SL - by pips, by ATR multiplier or at the pattern High/Low 3 different options to calculate the 2 TPs -
Entry In The Zone and SMC Multi Timeframe is a real-time 2-in-1 market analysis tool that combines market structure analysis and a No Repaint BUY / SELL signal system into a single indicator, built on Smart Money Concepts (SMC) — a widely adopted framework used by professional traders to understand market structure. This indicator helps you see the market more clearly, make decisions based on structure rather than guesswork, and focus on high-probability zones where price is more likely to react
Utraspikedetector
Odete Argelio Simbine
UltraSpikeDETECTOR for MQL5 is a professional market indicator designed to detect sudden price spikes and market trends efficiently. It provides real-time alerts, clear visual signals, and full integration with the MQL5 platform. Fully customizable and adaptable to various trading strategies, it helps traders monitor market movements more effectively. This tool is intended to support informed decision-making and improve trading analysis. No profit guarantees are provided, ensuring compliance wit
ATrend
Zaha Feiz
4.83 (18)
ATREND: 작동 방식 및 사용 방법 ### 작동 방식 MT5 플랫폼을 위한 "ATREND" 지표는 기술 분석 방법론의 조합을 활용하여 트레이더에게 강력한 매수 및 매도 신호를 제공하도록 설계되었습니다. 이 지표는 주로 변동성 측정을 위해 평균 진폭 범위(ATR)를 활용하며, 잠재적인 시장 움직임을 식별하기 위한 트렌드 탐지 알고리즘과 함께 사용됩니다. 구매 후 메시지를 남기면 특별 보너스 선물을 받게 됩니다. ### 주요 특징: - 동적 트렌드 탐지: 이 지표는 시장 트렌드를 평가하고 신호를 조정하여 트레이더가 현재 시장 상황에 맞춰 전략을 조정할 수 있도록 돕습니다. - 변동성 측정: ATR을 사용하여 시장의 변동성을 측정하며, 이는 최적의 손절매(SL) 및 이익 실현(TP) 수준을 결정하는 데 중요합니다. - 신호 시각화: 이 지표는 차트에 매수 및 매도 신호를 시각적으로 표시하여 트레이더의 의사 결정을 향상시킵니다. ### 운영 단계 #### 입력 및 설정 - TimeFr
Overview The Market Perspective Structure Indicator is a comprehensive MetaTrader indicator designed to provide traders with a detailed analysis of market structure across multiple timeframes. It identifies and visualizes key price action elements, including swing highs and lows, Break of Structure (BOS), Change of Character (CHOCH), internal structures, equal highs/lows, premium/discount levels, previous levels from higher timeframes, and trading session zones. With extensive customization opt
Premium level Pro
Dmitriy Kashevich
Premium level is a unique indicator with more than 80% accuracy of correct predictions! This indicator has been tested for more than two months by the best Trading Specialists! The author's indicator you will not find anywhere else! From the screenshots you can see for yourself the accuracy of this tool! 1 is great for trading binary options with an expiration time of 1 candle. 2 works on all currency pairs, stocks, commodities, cryptocurrencies Instructions: As soon as the red arrow app
Maximum Trend Arrows OT MT5
Mulweli Valdaz Makulana
STRICTLY FOR BOOM INDEX ONLY!!!!! Here I bring the Maximum Trend Arrows OT1.0 MT5 indicator. This indicator is made up of a combination of different trend indicators for entries and exits, for entries an orange arrow will paint on the chart below the current market and a red flag for closing of trades and it produces buy arrows only. When the orange arrow appears, it will appear along with it's sound to notify you. The 1H timeframe is recommended, don't use it anywhere else than on the 1H timefr
SMC Reversal Indicator Plus Alert (SMC 리버설 인디케이터 플러스 알림) SMC Reversal Indicator Plus Alert 는 스마트 머니 컨셉(Smart Money Concepts, SMC)에 기반한 강력한 트레이딩 도구로, 트레이더가 높은 확률의 반전 구역과 정밀한 진입 신호를 기관 투자자 로직을 활용하여 식별할 수 있도록 설계되었습니다. 이 인디케이터는 H4 와 D1 타임프레임의 공급 및 수요 구역 을 자동으로 표시하며, 현재 거래일 기준으로 시작하여 가격이 반응할 가능성이 높은 영역을 명확히 볼 수 있도록 합니다. 이 구역은 확인된 스윙 고점과 저점(Swing Highs 및 Swing Lows)을 기반으로 하며, 리페인트 없이 신뢰할 수 있는 관심 영역을 제공합니다. 시스템의 핵심은 윅 리젝션(Wick Rejection) 감지 기능 입니다. 인디케이터는 당일 가격 움직임을 분석하고, 일일 최고점 또는 최저점에서 강한 반전 캔들을 식별합니
이 제품의 구매자들이 또한 구매함
Neuro Poseidon MT5
Daria Rezueva
4.79 (52)
Neuro Poseidon is a new indicator by Daria Rezueva. It combines precise trading signals with adaptive TP/SL levels - creating best possible trades as a result! Message me and get  Neuro Poseidon Assistant  as a gift to automize your trading process! What makes it stand out? 1. Proven profitability on all assets and timeframes 2. Only confirmed BUY and SELL signals present on the chart 3. Adaptive TP & SL levels generated by the software for each trade 4. Easy to understand - suitable for al
Transaction Speed MT5
Ivan Stefanov
5 (3)
이 지표는 시장에서 관심이 나타나는 영역 을 강조 표시한 후, 주문이 누적되는 영역 을 보여줍니다. 이는 **대규모 오더북(호가창)**처럼 작동합니다. 이것은 거대한 자금 을 위한 인디케이터입니다. 성능은 탁월하며, 시장에서 어떤 관심이 있든 반드시 포착할 수 있습니다 . (이것은 완전히 새로 작성되고 자동화된 버전 입니다 – 이제 수동 분석은 필요하지 않습니다.) **거래 속도(Transaction Speed)**는 새로운 개념의 인디케이터로, 시장에 대규모 주문이 언제, 어디에 쌓이는지를 보여주며 , 그 이점을 분석합니다. 매우 초기 단계에서 트렌드 전환 을 감지할 수 있습니다. FX 시장에서 흔히 사용하는 "거래량(volume)"은 오해입니다. 실제로는 시간당 가격 변화량 이므로, 올바른 용어는 거래 속도 입니다. 우리가 어떻게 사고하고, 행동하며, 분석하느냐 가 가장 중요합니다. 분석 패러다임의 전환 은 필수적입니다. 이 인디케이터는 외환 시장에서의 볼륨 개념을 논리적으로
Gem SIGNAL
Shengzu Zhong
5 (1)
GEM Signal Pro GEM Signal Pro는 MetaTrader 5용 추세추종형 지표로, 차트에서 더 명확한 신호, 더 구조적인 트레이드 설정, 그리고 더 실용적인 리스크 관리를 원하는 트레이더를 위해 설계되었습니다. 단순한 화살표만 표시하는 것이 아니라, GEM Signal Pro는 전체 트레이드 아이디어를 더 깔끔하고 읽기 쉬운 방식으로 보여줍니다. 조건이 확인되면 진입가, 손절가, 목표가를 차트에 표시하여 트레이더가 설정을 더 효율적으로 검토할 수 있도록 도와줍니다. 작동 방식 이 지표는 먼저 내부 로직에 따라 유효한 초기 신호를 식별합니다. 확인 조건이 충족되면, GEM Signal Pro는 차트에 전체 설정을 표시합니다. 이를 통해 트레이더는 거래 구조를 더 명확하게 보고, 수동 분석 작업을 줄일 수 있습니다. 차트에 표시되는 거래 레벨 확인된 신호에 대해, GEM Signal Pro는 다음을 표시할 수 있습니다. 진입가 손절가 목표가 1 목표가 2 목표가 3 손
UZFX {SSS} 스캘핑 스마트 시그널 v4.0 MT5는 급변하는 시장에서 정확한 실시간 시그널을 필요로 하는 스캘퍼, 데이 트레이더, 스윙 트레이더를 위해 설계된 리페인팅이 없는 고성능 트레이딩 지표입니다. (UZFX-LABS)에서 개발한 이 지표는 가격 움직임 분석, 추세 확인 및 스마트 필터링을 결합하여 모든 통화 쌍과 시간대에서 높은 확률의 매수 및 매도 신호, 경고 신호, 추세 지속 기회를 생성합니다. 거래에 대한 의구심을 떨쳐버리고, 명확성, 정밀성, 그리고 규율 있는 시장 실행을 원하는 트레이더를 위해 설계된 체계적인 신호 시스템을 따르기 시작하세요. 제 추천* 최적의 시간대: 15분 이상. {H1}이 제가 가장 선호하는 시간대입니다. 그리고 그 결과는 정말 놀라울 정도입니다...!! 주요 기능 업데이트 • 자동 매수 및 매도 신호 감지 • 고급 반전 인식 로직 • 잠재적인 시장 반전 전 조기 경고 신호 • 추세 지속 확인 신호 • 진입, 손절, TP1, TP2,
ARIPoint
Temirlan Kdyrkhan
1 (1)
ARIPoint is a powerful trading companion designed to generate high-probability entry signals with dynamic TP/SL/DP levels based on volatility. Built-in performance tracking shows win/loss stats, PP1/PP2 hits, and success rates all updated live. Key Features: Buy/Sell signals with adaptive volatility bands Real-time TP/SL/DP levels based on ATR Built-in MA Filter with optional ATR/StdDev volatility Performance stats panel (Success, Profit/Loss, PP1/PP2) Alerts via popup, sound, push, or email Cu
이 제품은 2026년 시장에 맞게 업데이트되었으며 최신 MT5 빌드에 최적화되었습니다. 가격 업데이트 안내: Smart Price Action Concepts는 현재 $200 에 제공됩니다. 다음 30회 구매 후 가격은 $299 로 인상됩니다. 특별 혜택: 구매 후 저에게 개인 메시지를 보내시면 무료 보너스 + 선물 을 받을 수 있습니다. 먼저, 이 트레이딩 도구는 리페인트 없음, 재그리기 없음, 지연 없음의 인디케이터이므로 전문적인 트레이딩에 적합하다는 점을 강조하고 싶습니다. Online course , and manual Smart Price Action Concepts Indicator는 초보자와 경험 많은 트레이더 모두에게 매우 강력한 도구입니다. 20개 이상의 유용한 인디케이터를 하나로 결합하고, Inner Circle Trader Analysis와 Smart Money Concepts Trading Strategies 같은 고급 트레이딩 아이디어를 통합합니다. 이 인디
Azimuth Pro
Ottaviano De Cicco
5 (7)
Azimuth Pro V2: Synthetic Fractal Structure and Confirmed Entries for MT5 Overview Azimuth Pro is a multi-level swing structure indicator by Merkava Labs . Four nested swing layers, swing-anchored VWAP, ABC pattern detection, three-timeframe structural filtering, and closed-bar confirmed entries — one chart, one workflow from micro-swings to macro-cycles. This is not a blind signal product. It is a structure-first workflow for traders who care about location, context, and timing. ️ Summer Sale
Quant Direction MT5
Georgios Kalomoiropoulos
Quant Direction 은 3D 시장 분석 도구입니다. 다양한 매개변수에 걸쳐 정확한 백분율 편차를 계산하면서 완벽하게 객관적인 알고리즘 기반 시장 분석을 제공합니다. 첨단 AI 기반 모델링 도구와 엄격한 테스트를 거쳐 개발된 이 알고리즘은 타의 추종을 불허하는 정확도로 시장을 분석합니다. 플랫폼에서 모든 통화쌍 또는 금융 상품을 분석할 수 있습니다. 단기 거래, 데이 트레이딩, 스윙 트레이딩 등 어떤 유형의 거래를 하든 Quant Direction은 최적의 선택입니다. 운영자가 되는 것의 진정한 이점 퀀트 디렉션의 진정한 장점은 감정, 눈의 피로, 과도한 분석을 완전히 배제한다는 점입니다. 더 이상 수십 개의 차트를 일일이 살펴보며 방향을 찾거나 자신의 판단에 끊임없이 의문을 품을 필요가 없습니다. 이 시스템은 8개의 시간 간격(5개월에서 수개월까지)을 밀리초 단위로 처리합니다. 특정 시점의 주요 시장 참여자를 정확하게 식별하여 항상 성공 확률이 가장 높은 방향으로 거래할
The Oracle Pro
Ottaviano De Cicco
The Oracle Pro: Synthetic Multi-Timeframe Bias Engine for MT5 ️ Summer Launch Offer — Get The Oracle Pro for USD 199 (early buyers). Price rises with traction; final price USD 399. The Oracle Pro is a premium multi-timeframe bias engine for MetaTrader 5, built for demanding and professional traders. It answers one question with discipline: what is the directional bias on each timeframe right now, how strong is it, and how much do the timeframes agree? Everything is computed on closed bars only
This indicator automatically detects internal & swing market structure, Fibonacci Retracement and Fibo Levels. Features Full internal & swing market structure labeling in real-time Fibonacci Retracement Fibonacci Levels After purchasing the indicator, the full source code is provided, and via indicator buffers it can be easily integrated into your Expert Advisors (EAs) for automated trading strategies.
CGE Trading Suite
Carl Gustav Johan Ekstrom
5 (2)
Institutional-Grade Analytics for MT5 One indicator. The full analytical edge of a professional trading desk, built into your MT5 chart. CGE Trading Suite unifies everything a serious trader reads in a market — structure, momentum, timing, and capital flow — into one seamless MT5 workspace. 16 integrated modules act as a single system: ICT sessions and killzones, order-block and liquidity mapping, MIDAS volume curves, automated trend lines and channels, the Economic Confidence Model, and a live
RelicusRoad Pro MT5
Relicus LLC
4.96 (24)
RelicusRoad Pro: 퀀트 시장 운영 체제 70% 할인 평생 이용권 (한정 시간) - 2,000명 이상의 트레이더와 함께하세요 왜 대부분의 트레이더는 "완벽한" 지표를 가지고도 실패할까요? 진공 상태에서 단일 개념 만으로 거래하기 때문입니다. 문맥 없는 신호는 도박입니다. 지속적인 승리를 위해서는 컨플루언스(중첩) 가 필요합니다. RelicusRoad Pro는 단순한 화살표 지표가 아닙니다. 완전한 퀀트 시장 생태계 입니다. 독점적인 변동성 모델링을 사용하여 가격이 이동하는 "공정 가치 로드"를 매핑하고, 단순 노이즈와 실제 구조적 돌파를 구분합니다. 추측은 그만두세요. 기관급 로드 로직으로 거래를 시작하세요. 핵심 엔진: "Road" 알고리즘 시스템의 중심에는 시장 상황에 실시간으로 적응하는 동적 변동성 채널인 Road Algo 가 있습니다. 세이프 라인(평형) 과 가격이 수학적으로 반전될 가능성이 높은 확장 레벨 을 투영합니다. Simple Road: 일반적인 시장을 위
PrimeScalping
Temirlan Kdyrkhan
PrimeScalping is a powerful trading companion designed to generate high-probability entry signals with dynamic TP/SL/DP levels based on volatility. Built-in performance tracking shows win/loss stats, PP1/PP2 hits, and success rates — all updated live. Key Features: Buy/Sell signals with adaptive volatility bands Real-time TP/SL/DP levels based on ATR Built-in MA Filter with optional ATR/StdDev volatility Performance stats panel (Success, Profit/Loss, PP1/PP2) Alerts via popup, sound, push, or e
Meravith MT5
Ivan Stefanov
5 (1)
마켓 메이커를 위한 도구. Meravith는 다음과 같은 기능을 제공합니다: 모든 타임프레임을 분석하고 현재 유효한 추세를 표시합니다. 강세와 약세 거래량이 동일한 유동성 구간(거래량 균형 구간)을 강조 표시합니다. 서로 다른 타임프레임의 모든 유동성 레벨을 차트에 직접 표시합니다. 텍스트 기반 시장 분석을 생성하여 참고용으로 제공합니다. 현재 추세를 기반으로 목표가, 지지선 및 손절가를 계산합니다. 거래의 위험 대비 보상 비율(Risk/Reward)을 계산합니다. 계좌 잔고에 따라 포지션 크기를 산출하고 잠재 수익을 추정합니다. 시장에 중대한 변화가 발생할 경우 경고도 제공합니다. 지표의 주요 라인: 강세/약세 거래량 소진 라인 — 목표가로 사용됩니다. 시장 추세를 나타내는 라인. 시장이 강세인지 약세인지에 따라 색상이 변경되며 추세 지지선 역할을 합니다. 색상은 주로 시장 심리를 보여줍니다. 거래량 균형선(Eq). Eq(Volume Equilibrium) 라인은 시스템의 핵심입니
Presenting one-of-a-kind Gann Indicator for XAUUSD IQ Gold Gann Levels is a non-repainting, precision tool designed exclusively for XAUUSD intraday trading. It uses W.D. Gann’s square root method to plot real-time support and resistance levels, helping traders spot high-probability entries with confidence and clarity. William Delbert Gann (W.D. Gann) was an exceptional market analyst whose trading technique was based on a complex blend of mathematics, geometry, astrology, and ancient calculation
OmniSync Projection
Antonio-alin Teculescu
5 (1)
Chronos Fractal Engine is an innovative price projection indicator for MetaTrader 5, designed to transform your technical analysis by intelligently identifying and projecting historical price patterns. Built upon an advanced correlation algorithm and the fractal principles of the market, this powerful tool visualizes potential future price movements, giving you a unique edge in your trading decisions. What is Chronos Fractal Engine? At its core, the Chronos Fractal Engine employs a sophisticat
Ace Trend
Mikhail Sergeev
5 (3)
우리는 당신에게 트렌드 거래의 세계에서 게임의 규칙을 변경하는 혁신적인 지표를 제시한다. 이 표시기는 성능을 재고하고 거래 경험을 전례없는 높이로 높이도록 설계되었습니다. 우리의 표시기는 경쟁 업체와 차별화 된 고급 기능의 고유 한 조합을 자랑합니다. "실제 가격 요인"의 첨단 기술은 가장 어렵고 휘발성 시장 상황에서도 탁월한 안정성을 보장합니다. 불안정한 패턴,깨진 지표 및 의식적이고 통제 된 거래에 작별 인사를하십시오. 표시기는 단지 아름다운 그림이 아닙니다! 지표는 거래자의 편으로 확률을 이동시켜 이익을 얻어야 합니다. 표시 신호(완전 자동 모드)에 따라 거래 결과에 익숙해: https://www.mql5.com/ko/signals/2339244 표시기는 형성된 막대에 다시 그리지 않습니다. 막대가 형성된 경우 표시기 판독 값은 변경되지 않습니다. 이 표시기는 모든 시간대에 작동합니다. 표준은 시간대입니다. 귀하의 의견은 매우 중요합니다! 당신은 어떤 질문,제안이,또는 당신의
Valtor Edge Pro
Torben Petersen
Valtor Edge Pro – Precision Gold Signal Indicator with 3-Level Take-Profit, Session Filter & Live Stats Dashboard Valtor Edge Pro   is a   non-repaint   MetaTrader 5 indicator built exclusively for   XAUUSD (Gold) . It marks high-probability buy/sell signals directly on your chart — each one with a defined stop-loss and a complete three-level take-profit map (TP1 / TP2 / TP3). Designed for disciplined traders, it pairs a clean trend-following signal engine with a professional sidebar dashboard,
SmartScalping
Temirlan Kdyrkhan
SmartScalping is a powerful trading companion designed to generate high-probability entry signals with dynamic TP/SL/DP levels based on volatility. Built-in performance tracking shows win/loss stats, PP1/PP2 hits, and success rates — all updated live. Key Features: Buy/Sell signals with adaptive volatility bands Real-time TP/SL/DP levels based on ATR Built-in MA Filter with optional ATR/StdDev volatility Performance stats panel (Success, Profit/Loss, PP1/PP2) Alerts via popup, sound, push, or e
ScalpPoint
Temirlan Kdyrkhan
ScalpPoint is a powerful trading companion designed to generate high-probability entry signals with dynamic TP/SL/DP levels based on volatility. Built-in performance tracking shows win/loss stats, PP1/PP2 hits, and success rates — all updated live. Key Features: Buy/Sell signals with adaptive volatility bands Real-time TP/SL/DP levels based on ATR Built-in MA Filter with optional ATR/StdDev volatility Performance stats panel (Success, Profit/Loss, PP1/PP2) Alerts via popup, sound, push, or emai
안녕하세요, 트레이더 여러분! 많은 개인 투자자들이 느린 웹 스크립트에 의존하고 있습니다. 수익성 있는 거래를 위해서는 체계적인 프레임워크가 필수적입니다. Astro AI 지표는 단순한 차트 오버레이가 아닙니다. 터미널에서 직접 실행되는 두 개의 에이전트로 구성된 정교한 신경망입니다. 시스템 기술 상세 설명: 1. 에이전트 1: 분석가 (그래픽 신경망 – GNN) 시장은 개별 가격 막대로 이루어진 것이 아니라 상호 연결된 데이터 네트워크입니다. 기능: 에이전트 1은 그래픽 신경망을 사용하여 이러한 복잡하고 비선형적인 관계를 파악합니다. 장점: 기존 지표는 과거 이동 평균만을 고려하는 반면, 저희 GNN은 시장의 심층적인 구조적 관계를 실시간으로 처리하여 개별 트레이더의 거래량이 시장에 큰 영향을 미치기 전에 숨겨진 상관관계를 찾아냅니다. 2. 에이전트 2: 실행기 (근접 전략 최적화 – PPO) 패턴 인식은 절반의 성공일 뿐입니다. 현재 시장 변동에 기반하여 올바른
TrendProMaster
Temirlan Kdyrkhan
MasterTrend Indicator for MT5 A powerful trend-following and signal-evaluation tool MasterTrend   is a custom MT5 indicator that combines Moving Averages and ATR-based risk/reward logic to generate clear buy/sell signals. It visualizes dynamic SL/TP levels, evaluates past trade outcomes, and displays win/loss statistics in a clean on-chart panel. Key features include: Buy/Sell signals based on MA crossovers ATR-based SL/TP1/TP2/TP3 levels with visual lines and labels Signal outcome tracking wit
Ziva LSE System
Hassan Abdullah Hassan Al Balushi
ZIVA LSE System A Professional Liquidity & Structure Execution Framework Executive Overview ZIVA LSE System is a professionally engineered analytical framework designed to interpret market behavior through structural logic and liquidity dynamics. It is not positioned as a conventional indicator. Rather, it functions as a structured execution environment that organizes price action into a clear, disciplined decision-making model. The system is built to deliver consistency, clarity, and controlled
Flag Pattern Angelo
Brighton Mufaro Mudzingwa
Brandon Angelo Flag Pattern — how it works This indicator automatically detects classic bull and bear flag chart patterns in real time. The detection happens in three stages for each bar. First it looks for a flagpole — a sharp, strong directional move over a configurable number of bars ( FlagpoleBars , default 5) that must exceed a minimum percentage size ( FlagpoleMinPct ). For a bullish flag the pole must close net higher than it opened; for a bearish flag, net lower. Second it identifies th
MetaForecast M5
Vahidreza Heidar Gholami
5 (3)
MetaForecast는 가격 데이터의 조화를 기반으로 모든 시장의 미래를 예측하고 시각화합니다. 시장이 항상 예측 가능한 것은 아니지만 가격에 패턴이 있다면 MetaForecast는 가능한 정확하게 미래를 예측할 수 있습니다. 다른 유사한 제품과 비교했을 때, MetaForecast는 시장 동향을 분석하여 더 정확한 결과를 생성할 수 있습니다. 입력 매개변수 Past size (과거 크기) MetaForecast가 미래 예측을 생성하기 위한 모델을 만드는 데 사용하는 막대의 수를 지정합니다. 모델은 선택한 막대 위에 그려진 노란색 선으로 표시됩니다. Future size (미래 크기) 예측해야 할 미래 막대의 수를 지정합니다. 예측된 미래는 핑크색 선으로 표시되며 그 위에 파란색 회귀선이 그려집니다. Degree (차수) 이 입력은 MetaForecast가 시장에서 수행할 분석 수준을 결정합니다. Degree 설명  0 차수 0의 경우, "Past size" 입력에 모든 봉우리와
KT Alpha Hunter Arrows MT5
KEENBASE SOFTWARE SOLUTIONS
대부분의 화살표 인디케이터는 신호만 보여주고, 나머지 판단은 모두 트레이더에게 맡깁니다. KT Alpha Hunter Arrows는 완성된 트레이딩 플랜을 제공합니다. 각 신호 화살표가 표시될 때마다 진입선, 손절선, 네 개의 익절 목표, 그리고 현재 심볼과 시간대가 지금 거래할 가치가 있는지 알려주는 실시간 엣지 판정이 함께 그려집니다. 포함된 Trade Manager EA는 사용자가 직접 진입한 뒤의 실행 관리를 맡아, 시장이 흔들리고 감정이 개입되기 쉬운 상황에서도 거래 원칙을 유지할 수 있도록 도와줍니다. 리페인트 없음. 종가 확정 후 신호만 표시. Forex, Gold, Indices 및 사용자가 거래하는 다양한 MT5 지원 상품에 맞게 설계되었습니다. 주요 기능 캔들이 마감된 후에만 표시되는 리페인트 없는 매수 및 매도 화살표. 각 신호마다 진입선, 구조적 손절선, 네 개의 익절 목표 표시. 현재 차트에서 매수와 매도 셋업을 별도로 평가하는 Edge Dashboard.
LTL Long Trend Locator
Muhammad Usman Siddique
LTL 장기 추세 탐지기 v2.0 - 전문 추세 거래 지표 LTL 장기 추세 탐지기는 강력하고 지속적인 추세를 식별하여 트레이더가 시장에 진입하고 퇴출할 최적의 시점을 찾는 데 도움을 줍니다. 추세가 시작되고 끝나는 시점에 명확한 신호를 제공하여 올바른 방향으로 적시에 거래할 수 있도록 지원합니다. 강력한 시장 추세를 발견하고 명확한 진입점, 손절매 수준, 목표수익 수준을 통해 거래를 배치할 정확한 위치를 보여줍니다. 주요 기능: 명확한 매수/매도 신호: 시장이 상승 또는 하락할 준비가 되었을 때 화살표 표시 거래 라인 표시: 차트에 모든 수준이 명확히 표시된 완전한 거래 설정을 그립니다 추세 구역: 차트를 강세(녹색) 또는 약세(분홍색) 기간으로 색상 구분 통계 표시: 각 추세가 지속된 바 수와 포인트 수 표시 정보 패널: 현재 추세 상태 및 마지막 신호 시간 표시 알림 시스템: 새로운 신호 발생 시 팝업, 이메일 또는 소리 알림 수신 신호당 한 번만 알림(성가신 반복
MasterTrend
Temirlan Kdyrkhan
MasterTrend Indicator for MT5 A powerful trend-following and signal-evaluation tool MasterTrend   is a custom MT5 indicator that combines Moving Averages and ATR-based risk/reward logic to generate clear buy/sell signals. It visualizes dynamic SL/TP levels, evaluates past trade outcomes, and displays win/loss statistics in a clean on-chart panel. Key features include: Buy/Sell signals based on MA crossovers ATR-based SL/TP1/TP2/TP3 levels with visual lines and labels Signal outcome tracking wit
Account flip MT5 scalper
Presley Annais Tatenda Meck
Important: whether you rent or purchase,  contact the seller via the MQL5 private messaging system and  get the  Key Level Trade Manager  as a bonus gift for the best manual scalping experience. Account Flip MT5 Scalper Welcome to a 5 indicators in 1 scalping workstation. Rapidly growing a small account or passing a prop-firm challenge requires three things: high-probability setups, strict filtering, and explosive momentum. The   Acc
ZIVA Signal Intelligence
Hassan Abdullah Hassan Al Balushi
ZIVA Signal Intelligence An Adaptive, Modular Market Intelligence System ZIVA Signal Intelligence is not positioned as a conventional trading indicator. It is a fully integrated, proprietary market intelligence system engineered to deliver structured, high-precision interpretation of price behavior within a controlled analytical environment. Developed through an independent architectural approach, ZIVA does not rely on, derive from, or replicate existing indicators. It represents a standalone
제작자의 제품 더 보기
True Direction Oscillator
Muhammad Elbermawi
4.85 (364)
또는 (TDO) "순수 모멘텀 "의 원리를 사용하여 가격 변화율을 측정하는 지수입니다. 유가 증권 가격이 10에서 15로 상승하면 가격 변동률은 150%이지만 15에서 10으로 다시 하락하면 가격 변동률은 33.3%에 불과합니다. 이것이 "가격 변화율"(ROC) 또는 "모멘텀"과 같은 기술적 분석 지표가 내림차순에 제공된 것보다 상승하는 가격 움직임에 대해 더 높은 수치를 제공하는 이유입니다. TDO는 트레이더가 모멘텀을 올바르게 읽을 수 있도록 이 문제를 수정합니다. 중요한 정보 TDO 사용자 매뉴얼: https://www.mql5.com/en/blogs/post/717970 TDO FAQ : https://www.mql5.com/en/blogs/post/722015 TDO 비디오 라이브러리: https://www.mql5.com/en/blogs/post/722018 TDO 전문가 고문 예: https://www.mql5.com/en/blogs/post/731141 TDO
Bermaui Deviation Percent
Muhammad Elbermawi
4.94 (111)
또는 ( BD% )는 변동성을 포인트가 아닌 백분율로 측정하는 변동성 지수입니다. BD%의 개념은 0에서 100% 사이에서 움직이는 고전 표준 편차(CSD)에 따라 인덱스를 만드는 것입니다. BD%를 사용하여 다른 기간 또는 다른 기간의 동일한 증권에 대한 변동성을 비교할 수 있습니다. 또한 BD%를 사용하여 포인트가 아닌 백분율로 서로 다른 시장의 서로 다른 증권 간의 변동성을 비교할 수 있습니다. "BD%" 사용 방법 BD%가 90% 미만에서 이 수준을 상향 돌파하면 가격이 범위 내에서 움직일 수 있다는 신호입니다. BD%가 90%를 넘어 이 수준을 하향 돌파하고 가격이 이미 단순 이동 평균 위에 있다면 이는 새로운 상승 추세의 시작을 알리는 신호입니다. BD%가 하락세로 갈수록 변동성과 추세 강도가 증가하고 있습니다. BD%가 0%이면 변동성이 가장 높은 값에 있음을 의미합니다. BD%가 90%를 넘어 이 수준을 하향 돌파하고 가격이 이미 단순 이동 평균 아래에 있다면
Bermaui Bands
Muhammad Elbermawi
4.97 (68)
Bermaui Bands(BB)는 범위 및 추세 가격 움직임 사이를 필터링하는 데 도움이 되는 기술 분석 도구입니다. 이 지표의 이면에 있는 아이디어는 다음 단계에서 설명할 수 있습니다. 표준 편차를 0과 100 사이에서 이동하는 오실레이터로 계산합니다. 나는 그것을 Bermaui Deviation 퍼센트(BD %)라고 명명하겠습니다. "BD %"가 0에 가까우면 변동성이 극심합니다. 또한 "BD %"가 100에 가까우면 변동성이 매우 낮습니다. 높은 변동성은 추세 시장에 대한 큰 가능성을 의미하고 낮은 변동성은 횡보 또는 범위 시장을 의미합니다. 중간선은 표준편차가 SMA에 따라 계산되기 때문에 단순 이동 평균(SMA)입니다. Upper Bermaui Band를 얻으려면 계산에서 동일한 수의 막대를 사용하여 단순 이동 평균에 "BD %"를 추가하십시오. The Lower Bermaui Bands를 얻으려면 계산에서 동일한 수의 막대가 있는 단순 이동 평균에서 "BD %"를 빼십시오
Moving Average Cloud
Muhammad Elbermawi
4.92 (13)
또는 "맥". 이것은 추세를 포착하고 거래하는 데 도움이 되도록 설계된 지표입니다. 이 지표의 이면에 있는 아이디어는 다음 단계에서 설명할 수 있습니다. 빠르게 움직이는 평균 봉투를 그립니다. 느리게 움직이는 평균 봉투를 그립니다. MAC Upper Band는 두 Envelopes의 high 사이의 가장 높은 값입니다. MAC Lower Band는 두 Envelope의 낮은 값 사이의 가장 낮은 값입니다. MAC 히스토그램 클라우드는 방향 변화를 보여주기 위해 두 밴드 사이의 거리를 채웁니다. Blue Cloud는 상승 추세를 나타내고 Red Cloud는 하락 추세를 나타냅니다. MAC 버퍼를 사용하여 자신의 EA 또는 스캐너를 구축하는 방법을 보려면 다음 블로그를 읽으십시오. https://www.mql5.com/en/blogs/post/734293 MAC 사용 방법 MAC 클라우드를 필터로 사용하여 추세 방향을 식별하는 데 도움이 됩니다. 가능한 한 잘못된 신호를 제거
Bermaui Manual EA
Muhammad Elbermawi
5 (10)
그리드 시스템을 거래하는 반자동 전문 고문입니다. 아이디어는 시장에서 점차적으로 다른 포지션을 취한 다음 손익분기점 수준을 계산하는 것입니다. 가격이 미리 결정된 거리만큼 이 손익분기점을 지나면 모든 열린 주문이 마감됩니다. 중요한 정보 다음은 사용자 가이드입니다.   https://www.mql5.com/en/blogs/post/730567 내 다른 제품과 함께 이 EA를 사용해 볼 수 있습니다. https://www.mql5.com/en/users/bermaui314/seller 중요한 기능 EA는 예상치 못한 결과로부터 거래된 자본을 보호하기 위한 손절매 메커니즘을 가지고 있습니다. EURUSD - XAUUSD - 석유 - 비트코인과 같은 모든 MT4 기호를 거래할 수 있습니다. 모든 MT4 기간을 거래할 수 있습니다. VPS에서 EA를 실행하는 것이 좋습니다. 매개변수 및 기본 설정 1) 자금 관리 설정 시작 로트. 레버리지가 1:400 이상인 경우 기본 설정을 50
Classic Keltner Channel
Muhammad Elbermawi
4.86 (29)
또는 CKC. 이 지표는 Chester W. Keltner(1909–1998)가 설명한 고전적인 10일 이동 평균 규칙에 따라 작동합니다. 모든 매개변수는 기본적으로 Keltner 시스템의 클래식 버전으로 설정되며 사용자가 원하는 경우 변경할 수 있습니다. 중요한 정보 CKC 매뉴얼 읽기: https://www.mql5.com/en/blogs/post/736577 CKC 전문가 고문 예: https://www.mql5.com/en/blogs/post/734150 Keltner 채널 공식 정보 1. 표준가(= (고가 + 저가 + 종가) / 3)에서 단순 이동 평균으로 중심선을 계산합니다. 2. 고가와 저가의 평균 차이인 ADR(Average Daily Range)을 중심선에 대해 동일한 기간 및 계산 방법으로 계산합니다. 3. Keltner 매수 라인 = 센터 라인 + ADR. 4. Keltner 판매 라인 = 센터 라인 – ADR. Keltner 10일 이동 평균 규칙 Kel
Bermaui Pin Bars
Muhammad Elbermawi
5 (13)
버마우이 핀 바 또는 (BPB)는 차트에서 핀 바 가격 행동 패턴을 찾는 지표입니다. Pin Bars는 Hammer, Inverted-Hammer, Hanging Man, 슈팅 스타, Dragon Fly Doji 또는 Grave Stone Doji와 같이 높이가 높거나 낮은 그림자와 매우 작은 몸체를 가진 일본 촛대의 대안인 고전적인 바 패턴인 "Pinocchio Bars"의 지름길입니다. . Bermaui Pin Bars 표시기는 다음 단계에서 설명할 수 있는 공식에 따라 이 패턴을 찾습니다. 처음에 BPB는 양초 몸체의 중심을 계산합니다( = [Open + Close] / 2). 그런 다음 BPB는 몸체 중심과 촛불 사이의 거리를 낮게 찾습니다. 마지막 단계는 2단계 결과를 양초 범위로 나누는 것입니다. 양초 본체 중심이 양초의 고점 또는 저점에 너무 가까우면 BPB가 핀 막대 패턴을 감지하고 사용자에게 경고합니다. 버마우이 핀 바 공식 : https://www.mql5.com
MASR Bands
Muhammad Elbermawi
5 (5)
또는 M oving verage S upport를 R의 esistance 밴드. MASR 밴드 표시기는 지지 및 저항 수준으로 함께 작동하는 두 밴드로 둘러싸인 이동 평균입니다. 통계적으로 MASR 밴드는 시간의 93%에 가격 캔들을 포함합니다. 단계별로 계산하는 방법은 다음과 같습니다. 1. 첫 번째 단계는 X 기간 동안 최고 고가(HHV)와 최저 저가(LLV)를 계산하는 것입니다. 2. 두 번째 단계는 HHV를 LLV로 나누어 그들 사이의 거리가 얼마나 넓은지 백분율로 구하는 것입니다. 나는 이 단계의 결과를 MASR Filter라고 부른다. 3. MASR 필터 = 합계((HHV / LLV)-1) / 막대 수 4. 나는 이동 평균 저항의 지름길인 상위 밴드를 MAR이라고 부릅니다. 저는 이동 평균 지원의 지름길인 하단 밴드 MAS라고 부릅니다. 밴드 사이의 이동 평균을 중앙선이라고 합니다. 5. MAR = MASR 센터 + (75% x MASR 필터 x MASR 센터
Bermaui Channel
Muhammad Elbermawi
5 (19)
This is a price channel that shows five important price levels on the chart. Those levels are: 1. The Highest High (HH) of the previous x bars. 2. The Highest Low (HL) of the previous x bars. 3. The Center Line. 4. The Lowest High (LH) of the previous x bars. 5. The Lowest Low (LL) of the previous x bars. How does Bermaui Channels Captures Overbought  area Think of the distance between HH and HL levels as an overbought area. When the price candles or bars crosses the HL to the upside this indica
Bermaui RSI Candles
Muhammad Elbermawi
5 (4)
이 지표의 아이디어는 매수 및 매도 신호를 생성하기 위해 가격 차트와 비교할 수 있는 양초 형태로 RSI를 그리는 것입니다. 지표는 내 발명품이 아닙니다. 나는 몇 년 전에 인터넷에서 그것을 설립했습니다. 코드를 업데이트하고 경고 기능을 추가했으며 Bermaui Utilities 도구 그룹을 추가했습니다. 표시기는 촛대를 그리는 데 사용되는 모든 가격의 RSI(시가, 고가, 저가 및 종가의 RSI)를 계산합니다. RSI 양초 높은 심지를 그리기 위해 가장 높은 값을 사용하고 RSI 양초 낮은 심지를 그리는 데 가장 낮은 값을 사용합니다. RSI 양초의 몸체는 고점과 저점 사이에 있습니다. 시가의 RSI가 종가의 RSI보다 낮으면 RSI 양초가 강세로 간주됩니다. 시가의 RSI가 종가의 RSI보다 높으면 RSI 캔들은 약세로 간주됩니다. 사용 방법 RSI 양초 지표에서 추세선 브레이크아웃을 거래할 수 있으며, 이는 모멘텀이 가격을 앞서기 때문에 가격 차트의 추세를 이끌 것입니다. RS
필터:
mostafa gamal
74
mostafa gamal 2026.06.22 09:51 
 

사용자가 평가에 대한 코멘트를 남기지 않았습니다

Nada Rabei
27
Nada Rabei 2026.06.15 17:25 
 

사용자가 평가에 대한 코멘트를 남기지 않았습니다

equalitygr
194
equalitygr 2026.05.11 10:59 
 

Very simple and successful system.

I am updating my review that I have added 2 hours before.

Not only is this system the best and the simplest that I have ever seen, but the support of the developer is unbelievable. He is helping me a lot, giving me many examples and giving me tips for every detail of this system.

I am not an affiliate with this indicator.

Muhammad Elbermawi
53568
개발자의 답변 Muhammad Elbermawi 2026.05.11 11:32
Thanks a lot for your kind words 💚 I appreciate it.
mohamed ahmed
23
mohamed ahmed 2026.04.19 20:32 
 

사용자가 평가에 대한 코멘트를 남기지 않았습니다

Ahmed Abdellatif
55
Ahmed Abdellatif 2026.04.08 04:38 
 

사용자가 평가에 대한 코멘트를 남기지 않았습니다

Fadi Roman
273
Fadi Roman 2026.02.22 23:47 
 

사용자가 평가에 대한 코멘트를 남기지 않았습니다

Muhammad Elbermawi
53568
개발자의 답변 Muhammad Elbermawi 2026.02.24 05:34
Thanks a lot for your kind words 💚 I appreciate it.
123478888
19
123478888 2026.02.19 19:07 
 

Excellent and highly accurate trend indicator. Easy to use and provides clear signals. Highly recommended 👍

munther1974
39
munther1974 2026.01.21 09:05 
 

사용자가 평가에 대한 코멘트를 남기지 않았습니다

ahmed mamdoh
21
ahmed mamdoh 2026.01.20 09:47 
 

사용자가 평가에 대한 코멘트를 남기지 않았습니다

Mohammed Mustafa Alim Bushara
148
Mohammed Mustafa Alim Bushara 2026.01.11 02:28 
 

사용자가 평가에 대한 코멘트를 남기지 않았습니다

Muhammad Elbermawi
53568
개발자의 답변 Muhammad Elbermawi 2026.01.11 17:01
Thanks a lot for your kind words 💚 I appreciate it.
0xMohamEd
22
0xMohamEd 2026.01.05 21:00 
 

사용자가 평가에 대한 코멘트를 남기지 않았습니다

9930075
19
9930075 2026.01.05 13:15 
 

사용자가 평가에 대한 코멘트를 남기지 않았습니다

mondas pro
23
mondas pro 2025.12.25 15:29 
 

사용자가 평가에 대한 코멘트를 남기지 않았습니다

mohamed kilany
23
mohamed kilany 2025.12.09 01:02 
 

사용자가 평가에 대한 코멘트를 남기지 않았습니다

Muhammad Elbermawi
53568
개발자의 답변 Muhammad Elbermawi 2025.12.09 05:27
Thanks a lot for your kind words 💚 I appreciate it.
mahaon2
195
mahaon2 2025.10.15 14:00 
 

사용자가 평가에 대한 코멘트를 남기지 않았습니다

Mohamed Abdalla
38
Mohamed Abdalla 2025.09.26 14:08 
 

사용자가 평가에 대한 코멘트를 남기지 않았습니다

Juergen Loebach
1321
Juergen Loebach 2025.09.18 11:34 
 

The manual and video clips are particularly Very useful for beginners. indicator delivered very good results in the test.

KEWELL99 Hields
103
KEWELL99 Hields 2025.07.23 21:04 
 

I like the fact that Mohammed doesnt just provide visually intuitive indicators to identify trends and other trading tactics, with the Berma Bands he provides a strategy/system for us to follow that he obviously uses himself for profitability, I have previous indicators from Mohammed and he is one of the best sellers on here - the 5 stars though is for the product and the fact that he really wants to help, his service is excellent and he is always ready to help and chat - thank you Mohammed

walaaeldinsaleh
22
walaaeldinsaleh 2025.07.10 15:05 
 

사용자가 평가에 대한 코멘트를 남기지 않았습니다

garypang
248
garypang 2025.07.08 22:38 
 

This Indicator is a hidden gem, makes my trading very easy and confidence when taking trades. Truly appreciate Mr Muhammad Elbermawi excellent support and guidance.

12
리뷰 답변