Stefanov
- 지표
- 버전: 2.0
- 업데이트됨: 30 12월 2025
- 활성화: 10

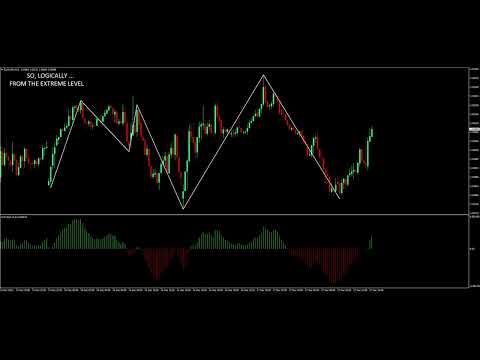
The indicator displays support and resistance zones defined logically using the MACD. The entire concept is explained in the video, with specific examples shown. The indicator works on any instruments and timeframes. It does not repaint.
After placing it on the chart, please go through all the timeframes sequentially, from monthly to 1-minute, so that all lines load correctly. After that, you can start using it.
The concept is unique and has not been seen in other systems or indicators.
After placing it on the chart, please go through all the timeframes sequentially, from monthly to 1-minute, so that all lines load correctly. After that, you can start using it.
The concept is unique and has not been seen in other systems or indicators.