Phoenix Candle Timer Panel
- インディケータ
- バージョン: 1.1
- アップデート済み: 8 1月 2026

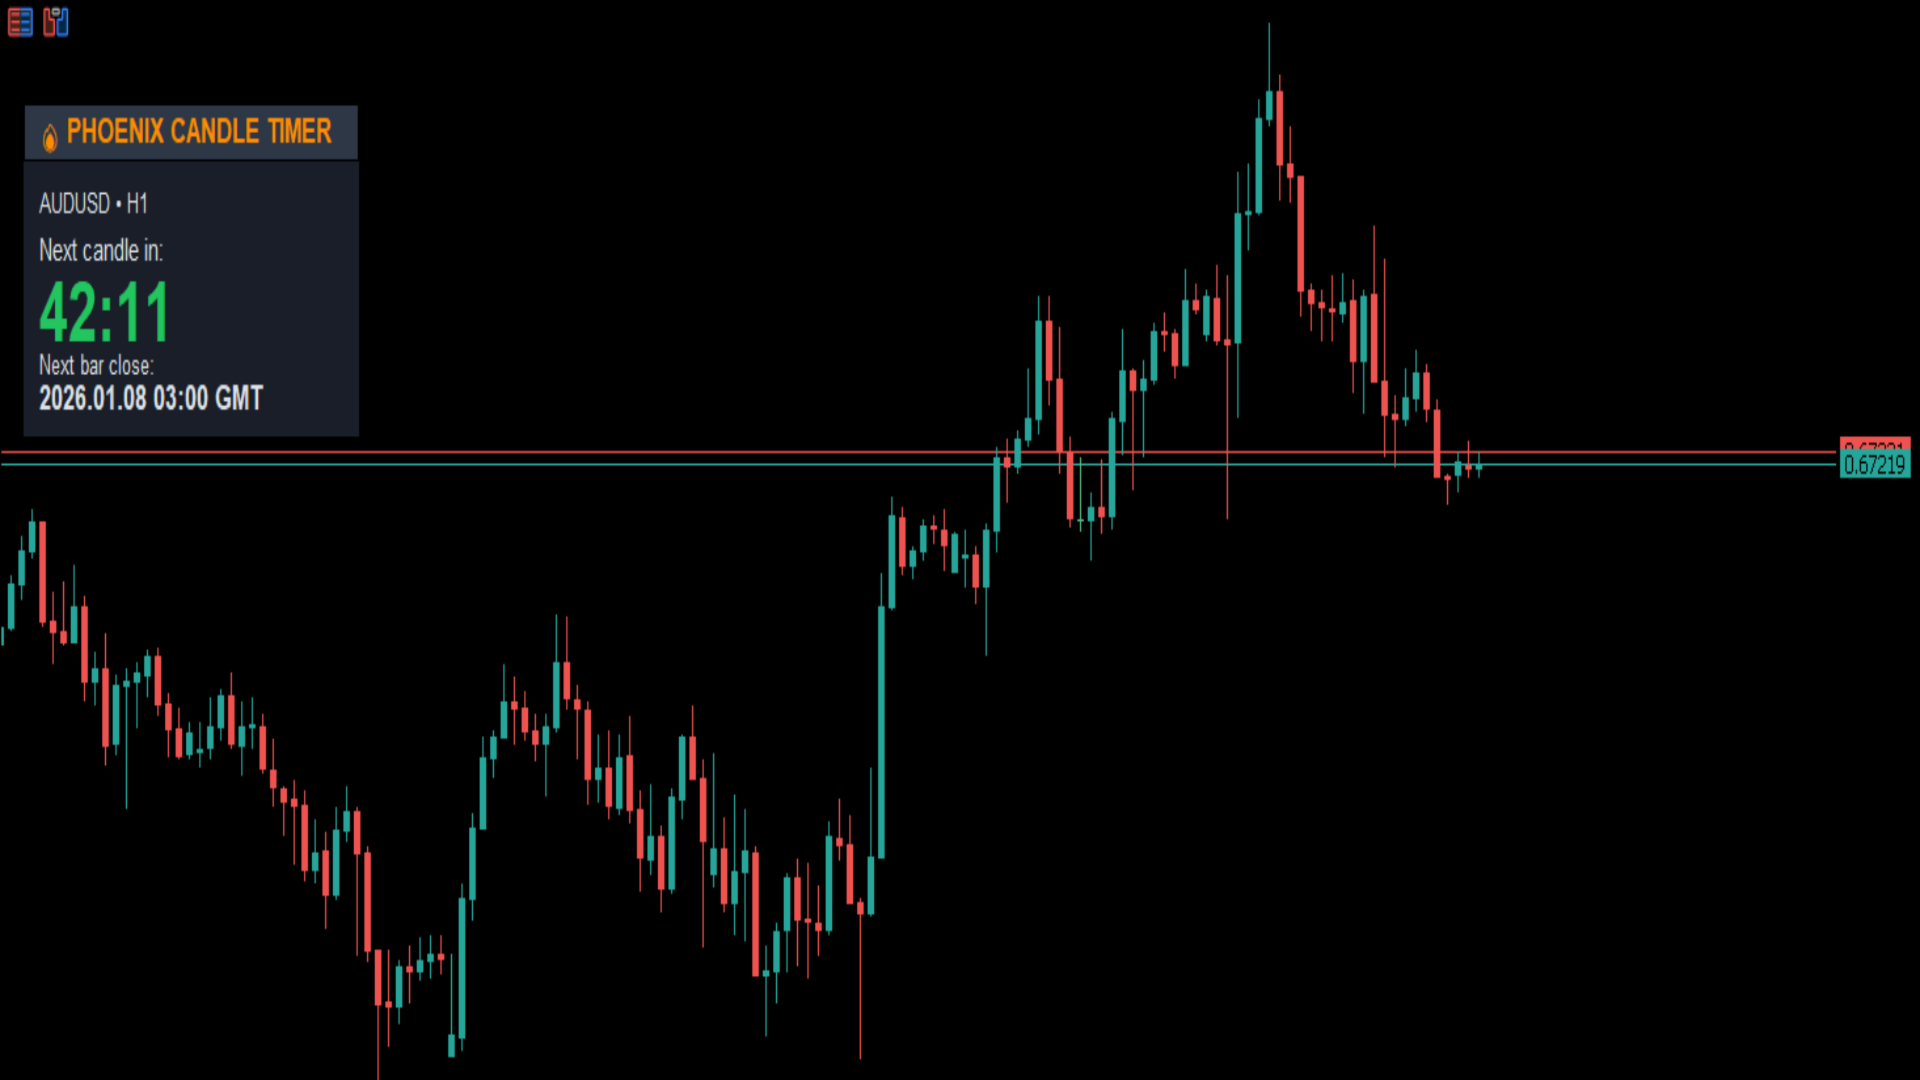
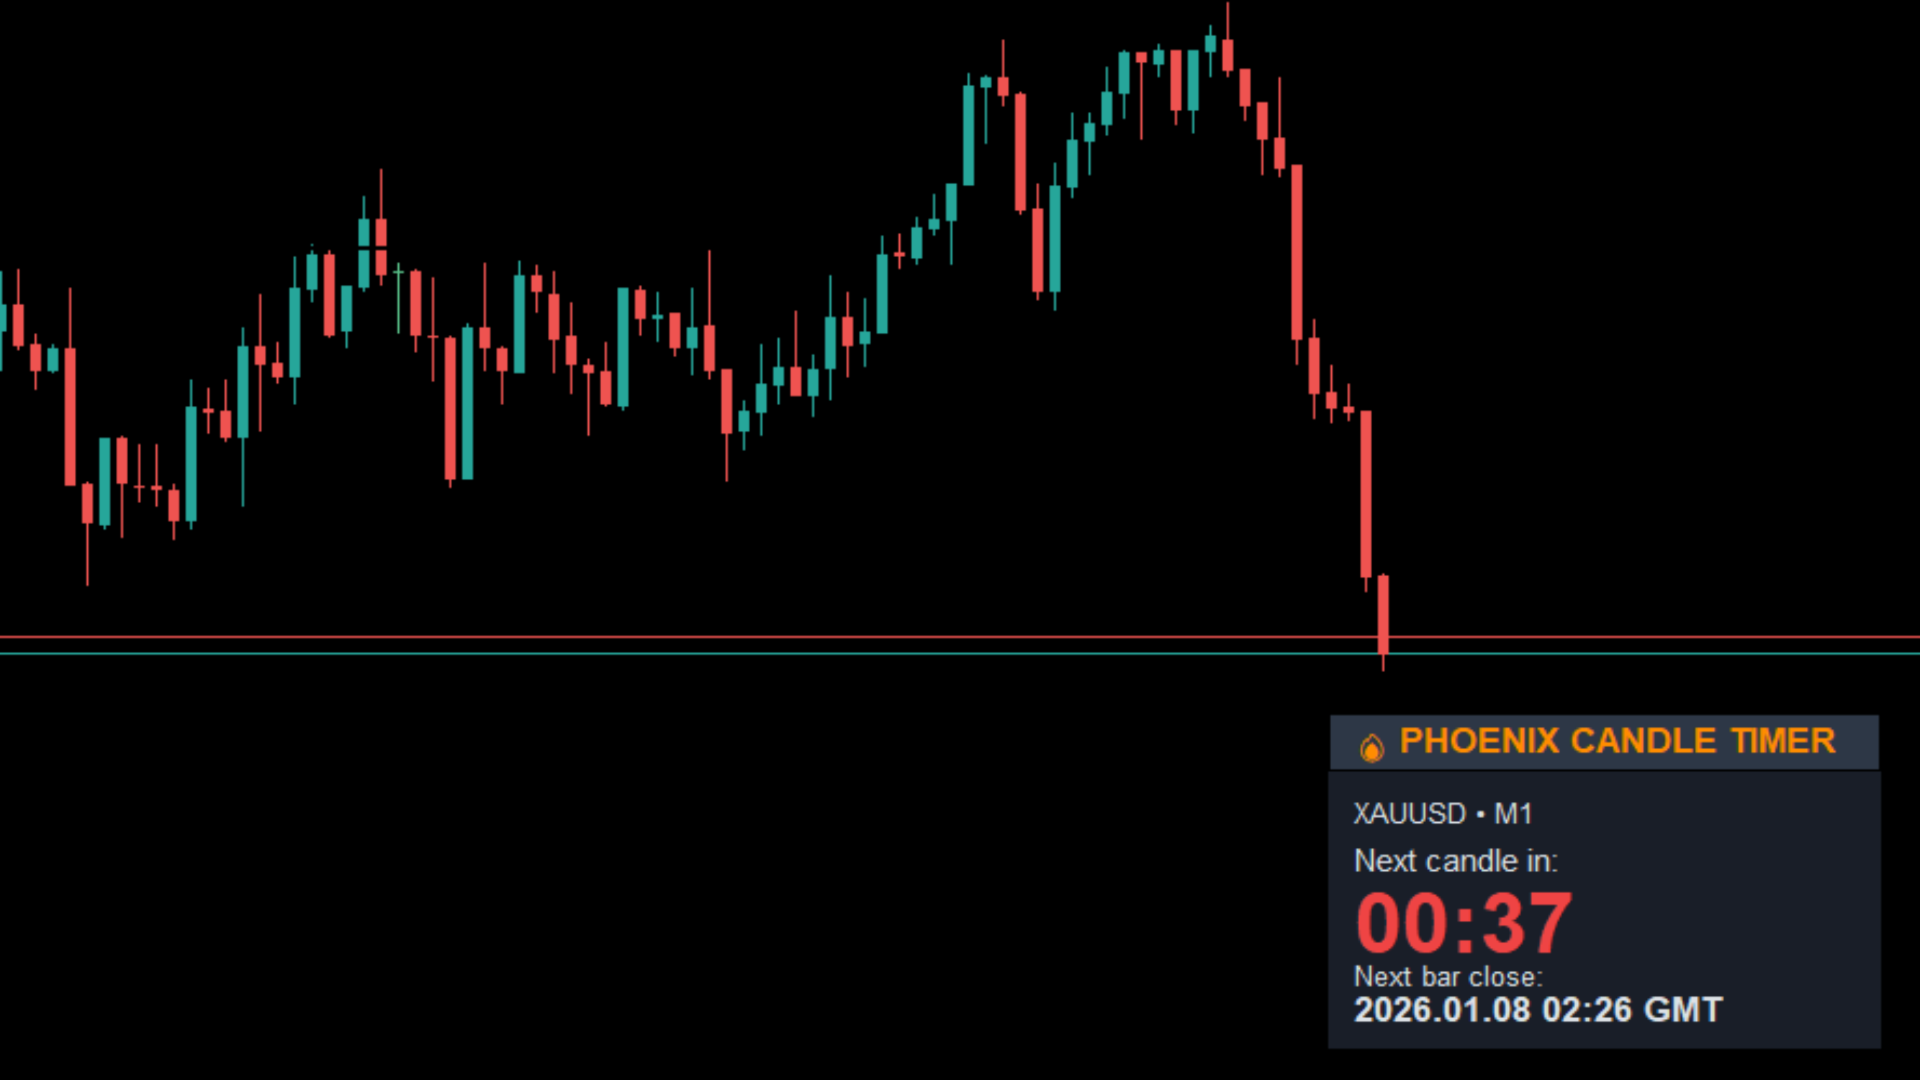
フェニックス・キャンドル・タイマー・パネル (MT5)
MetaTrader 5 向けリアルタイムキャンドルカウントダウンタイマー。現在のローソク足における正確な残り時間を表示し、執行タイミングとトレード規律の向上を支援します。
目的
正確なローソク足タイミングは、裁定取引者やアルゴリズム戦略にとって極めて重要です。ローソク足内で早すぎたり遅すぎたりしたエントリーは、リスク、スプレッドエクスポージャー、シグナルの有効性に影響を与える可能性があります。
フェニックス キャンドルタイマーパネルは、ブローカーサーバー時間に同期した明確なカウントダウン表示を提供します。タイマーはチャートの時間枠変更に自動的に適応し、リアルタイムで更新されるため、推測作業を排除し、全時間枠にわたる執行精度を向上させます。
インストール
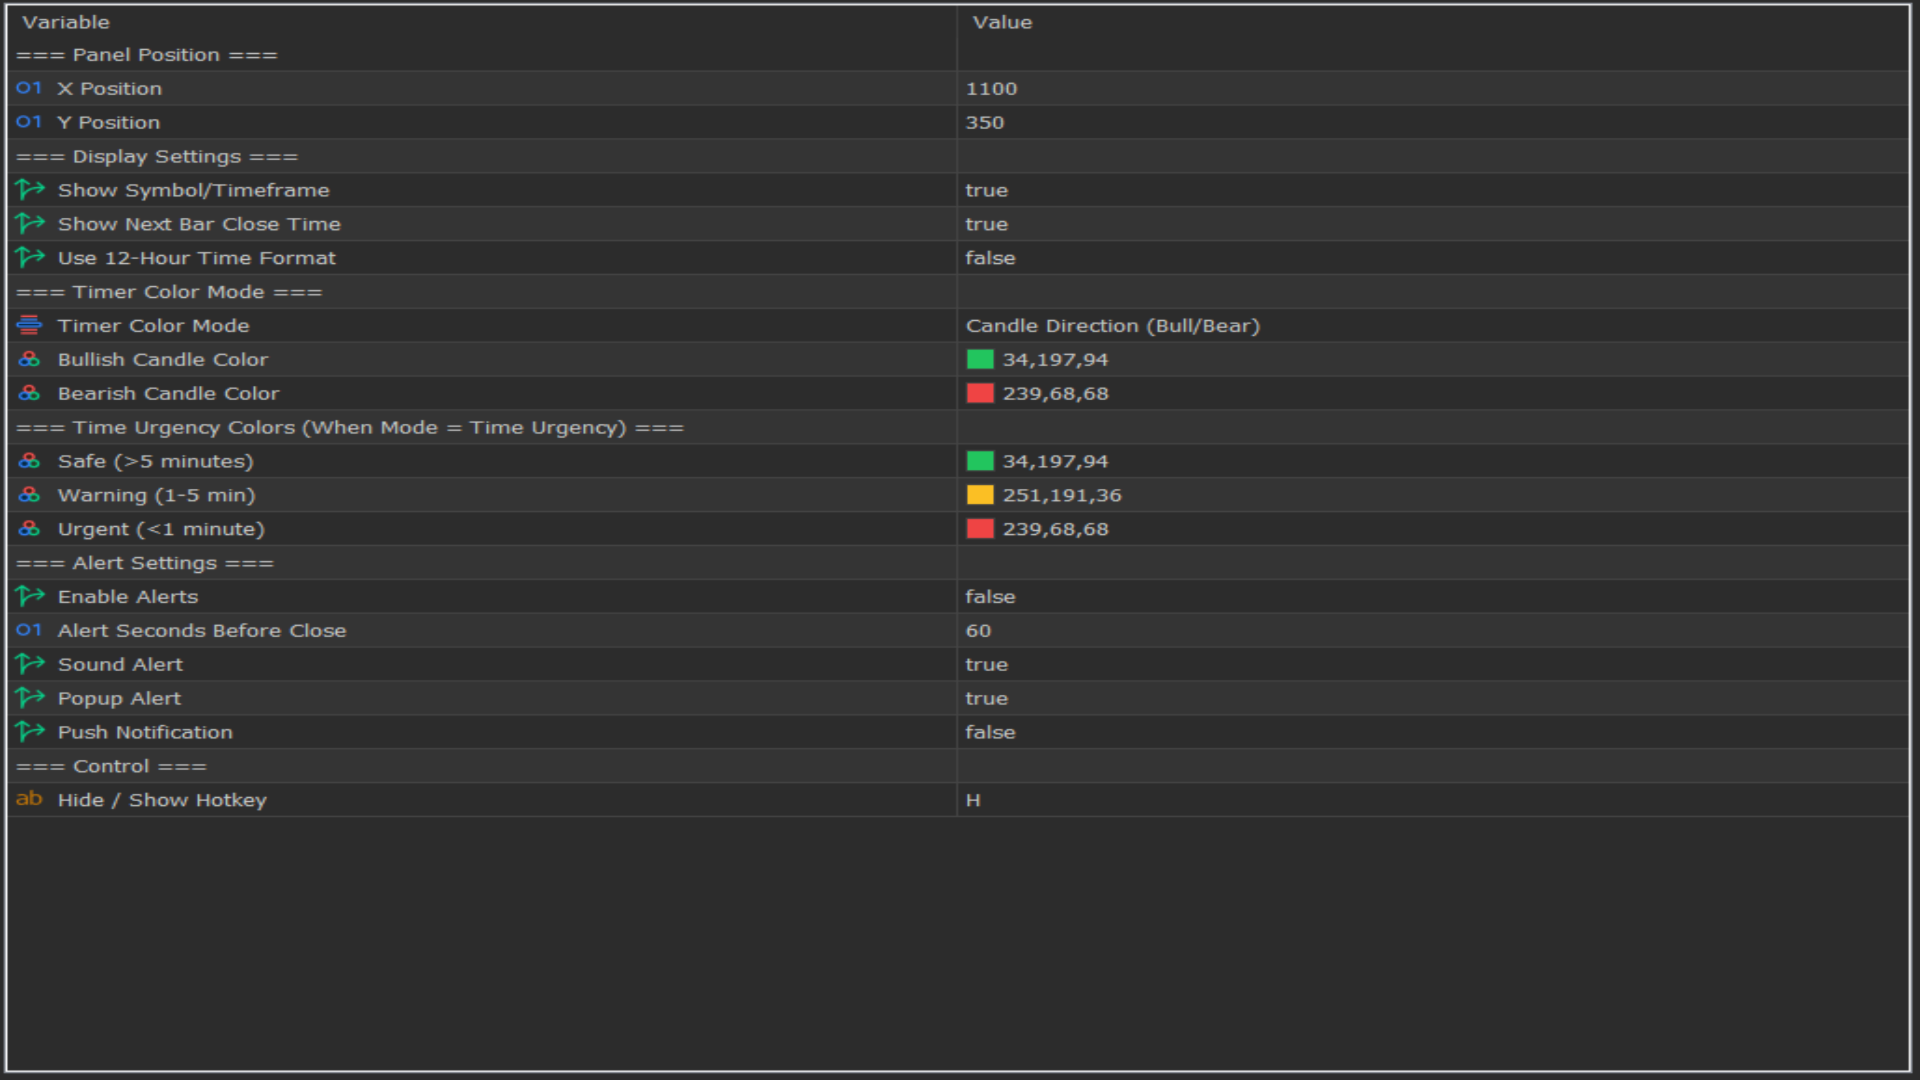
MQL5マーケットからダウンロードし、任意のチャートにアタッチしてください。タイマーパネルは即時表示され、設定は不要です。
動作環境
MetaTrader 5 ビルド3280以降。チャート上で実行する必要があるエキスパートアドバイザーです。ブローカーサーバー時間を使用し、全銘柄・全時間枠で動作します。
フィードバックとレビュー
本ツールが有用とお感じになりましたら、MQL5での5つ星レビューをご検討ください。皆様のフィードバックは、Phoenixの今後のアップデート、改善、新ツール開発に直接反映されます。トレーダーが真に価値を置く機能を拡充してまいります。
サポート
MQL5プライベートメッセージによる生涯サポート。24時間以内に対応いたします。
開発元:Phoenix Global Investments Ltd
© 2025 Phoenix Global Investments Ltd. All rights reserved.