Support and Resistance Screener Pro MT5
- インディケータ
-
STE S.S.COMPANY
 Hello,
my name is Ashraf a fintech Software Engineer.
I create amazing forex indicators and expert advisors for Metatrader 4 and Metatrader 5, the best trading platforms.
Use my service and let me build your trading strategies ( Indicator coding or EA coding ) by click on bellow link - バージョン: 13.20
- アップデート済み: 13 12月 2023
- アクティベーション: 10
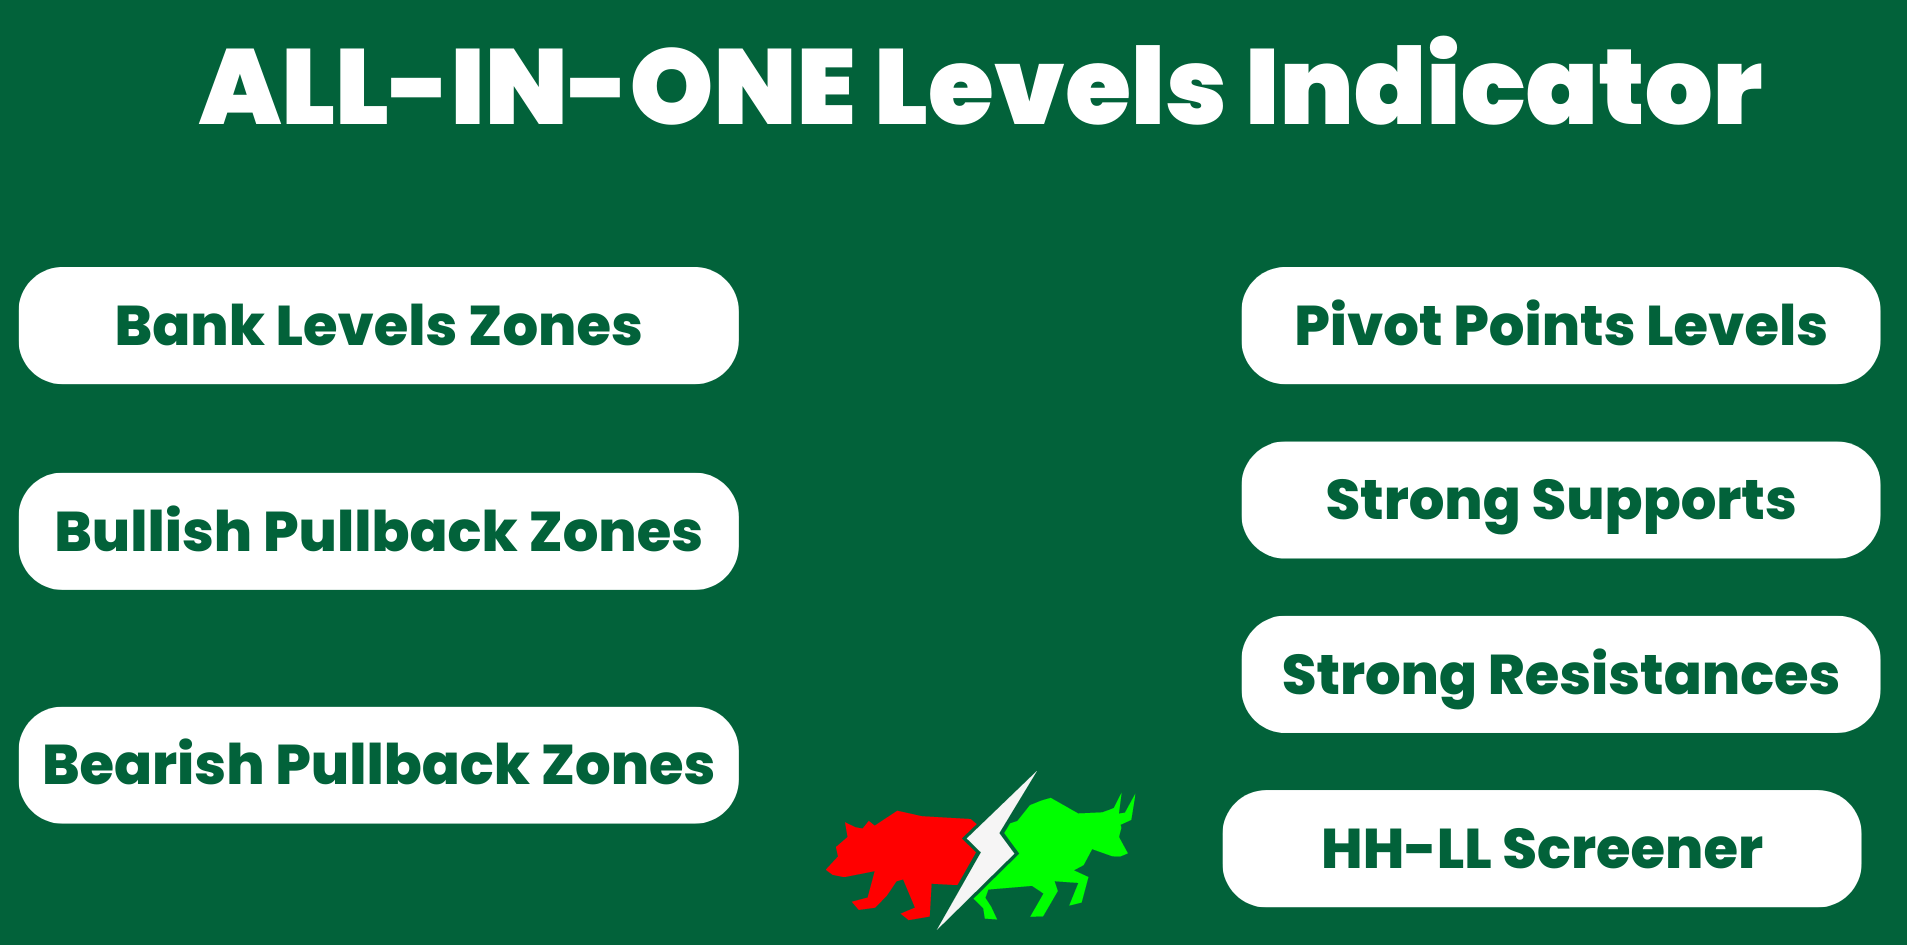
サポートとレジスタンススクリーナーは、1つのインジケーター内に複数のツールを提供するMetaTraderの1つのレベルインジケーターにあります。 利用可能なツールは次のとおりです。
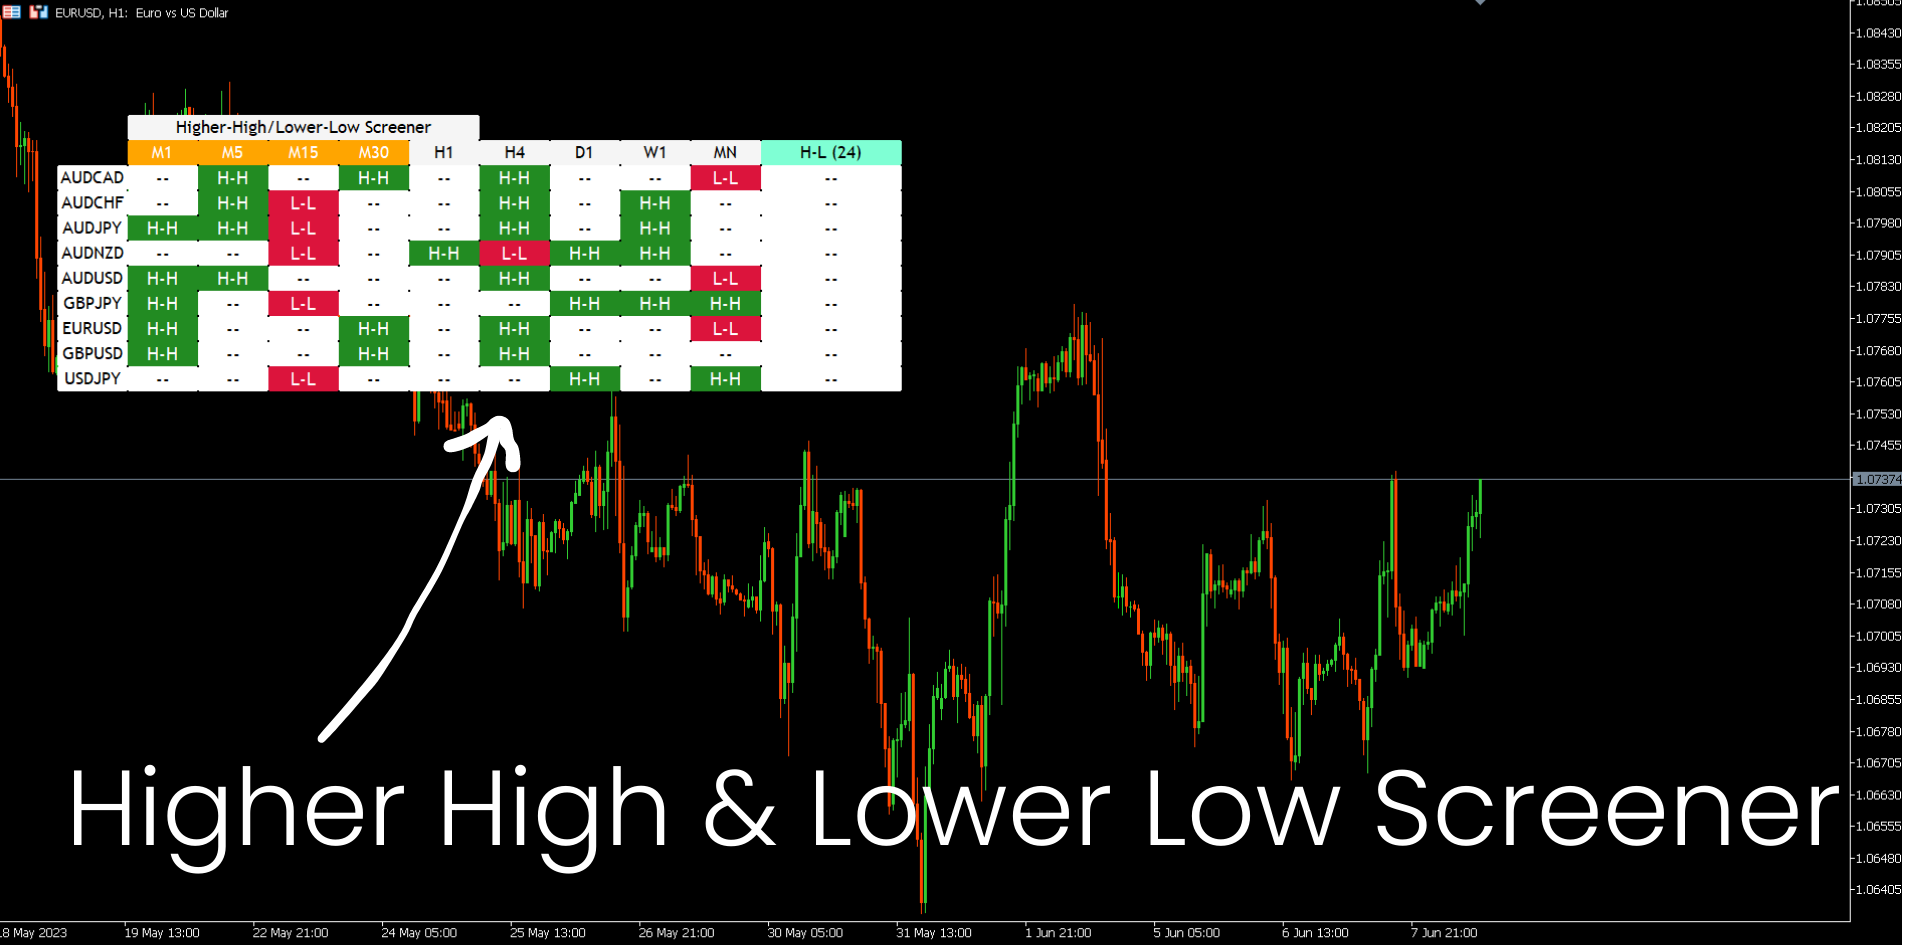
1.市場構造スクリーナー。
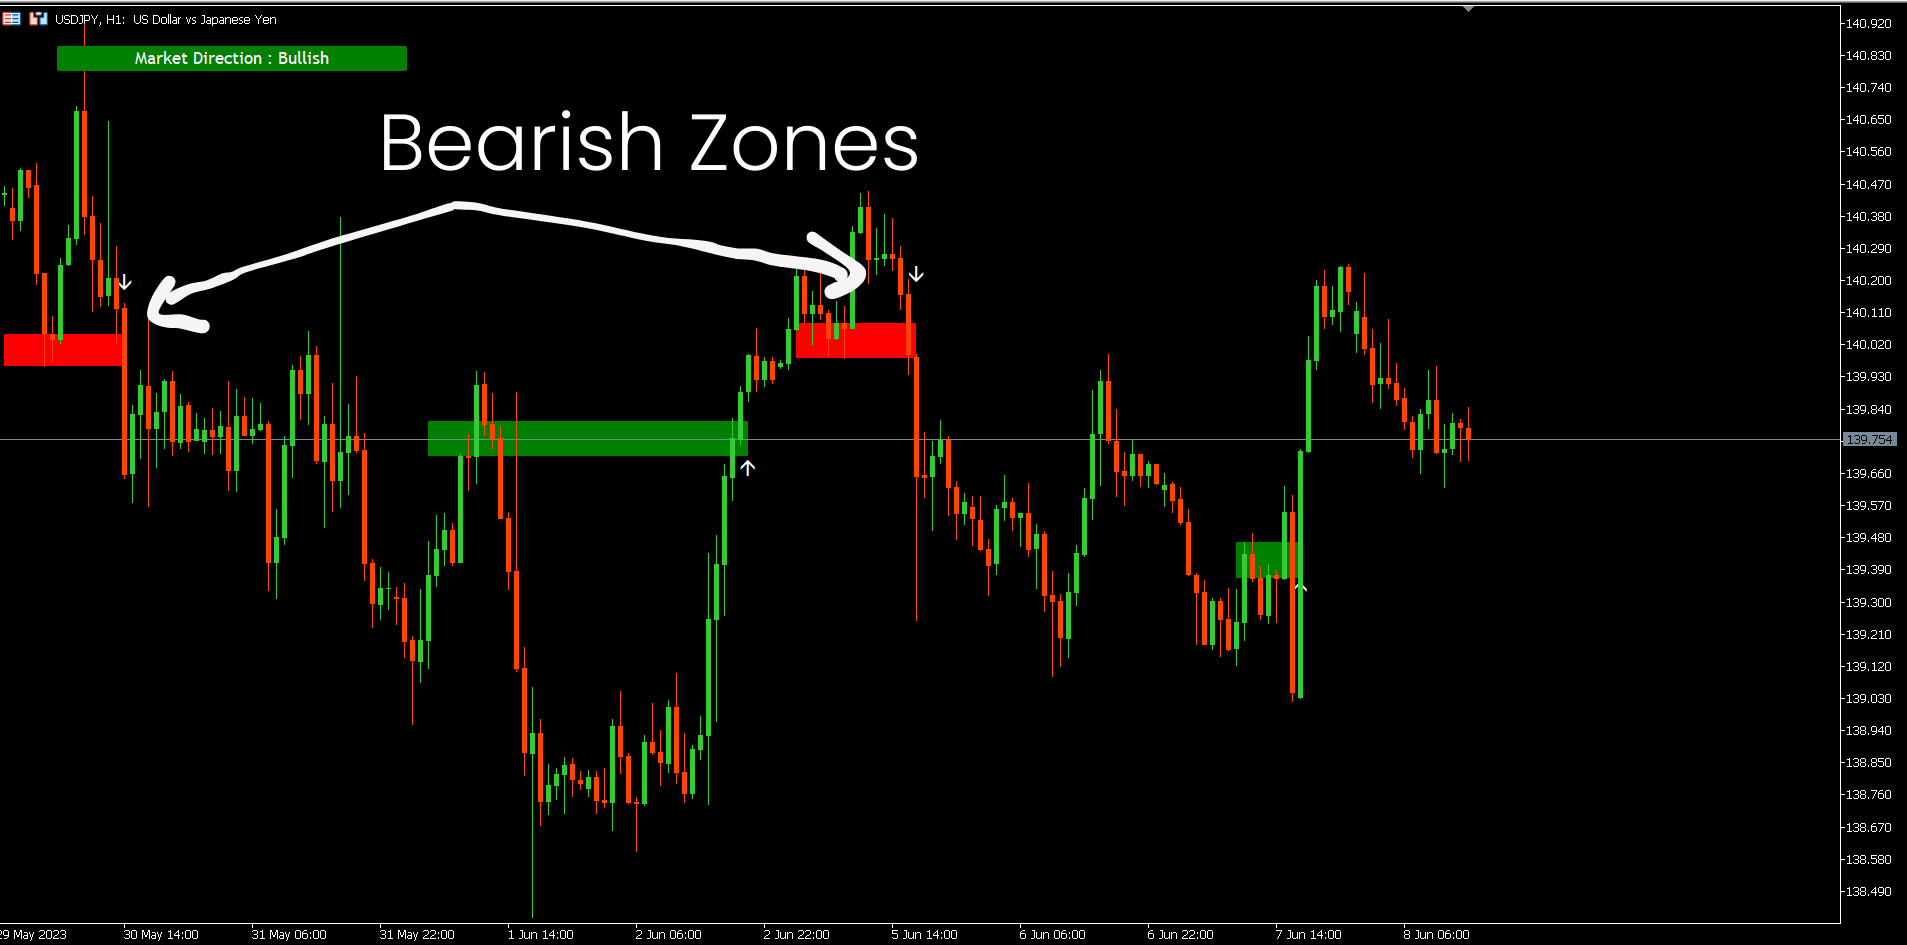
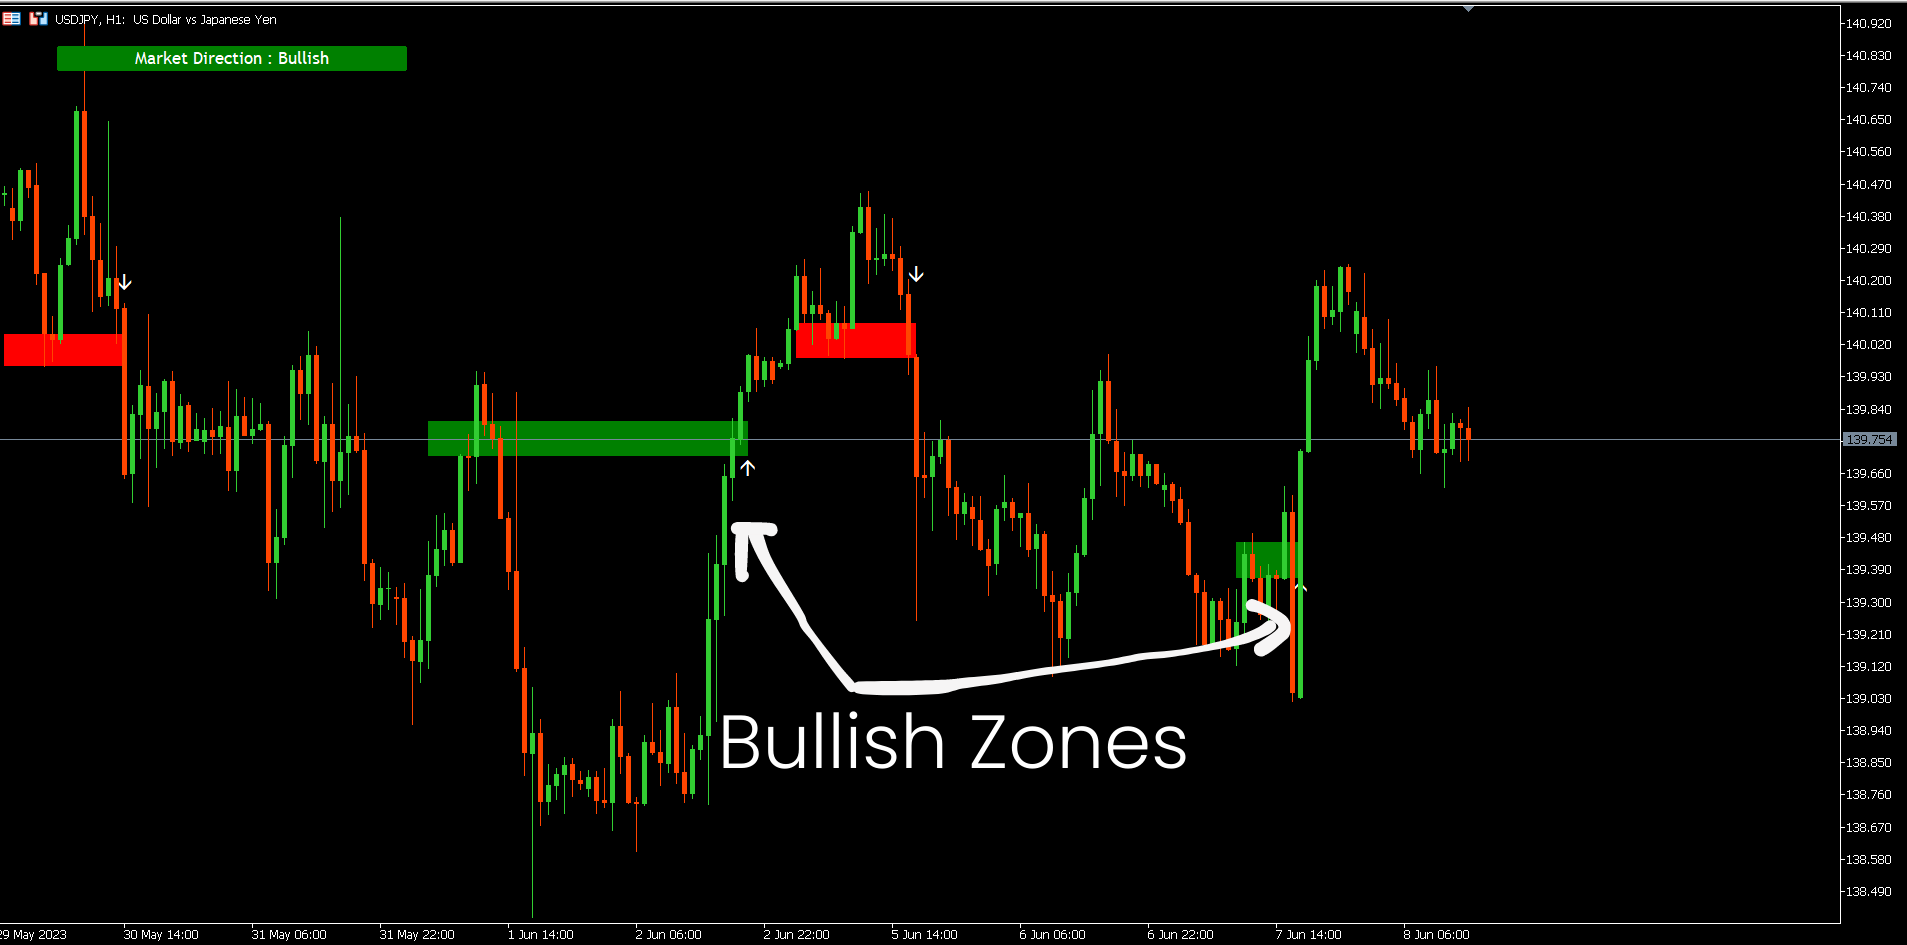
2.強気のプルバックゾーン。
3.弱気プルバックゾーン。
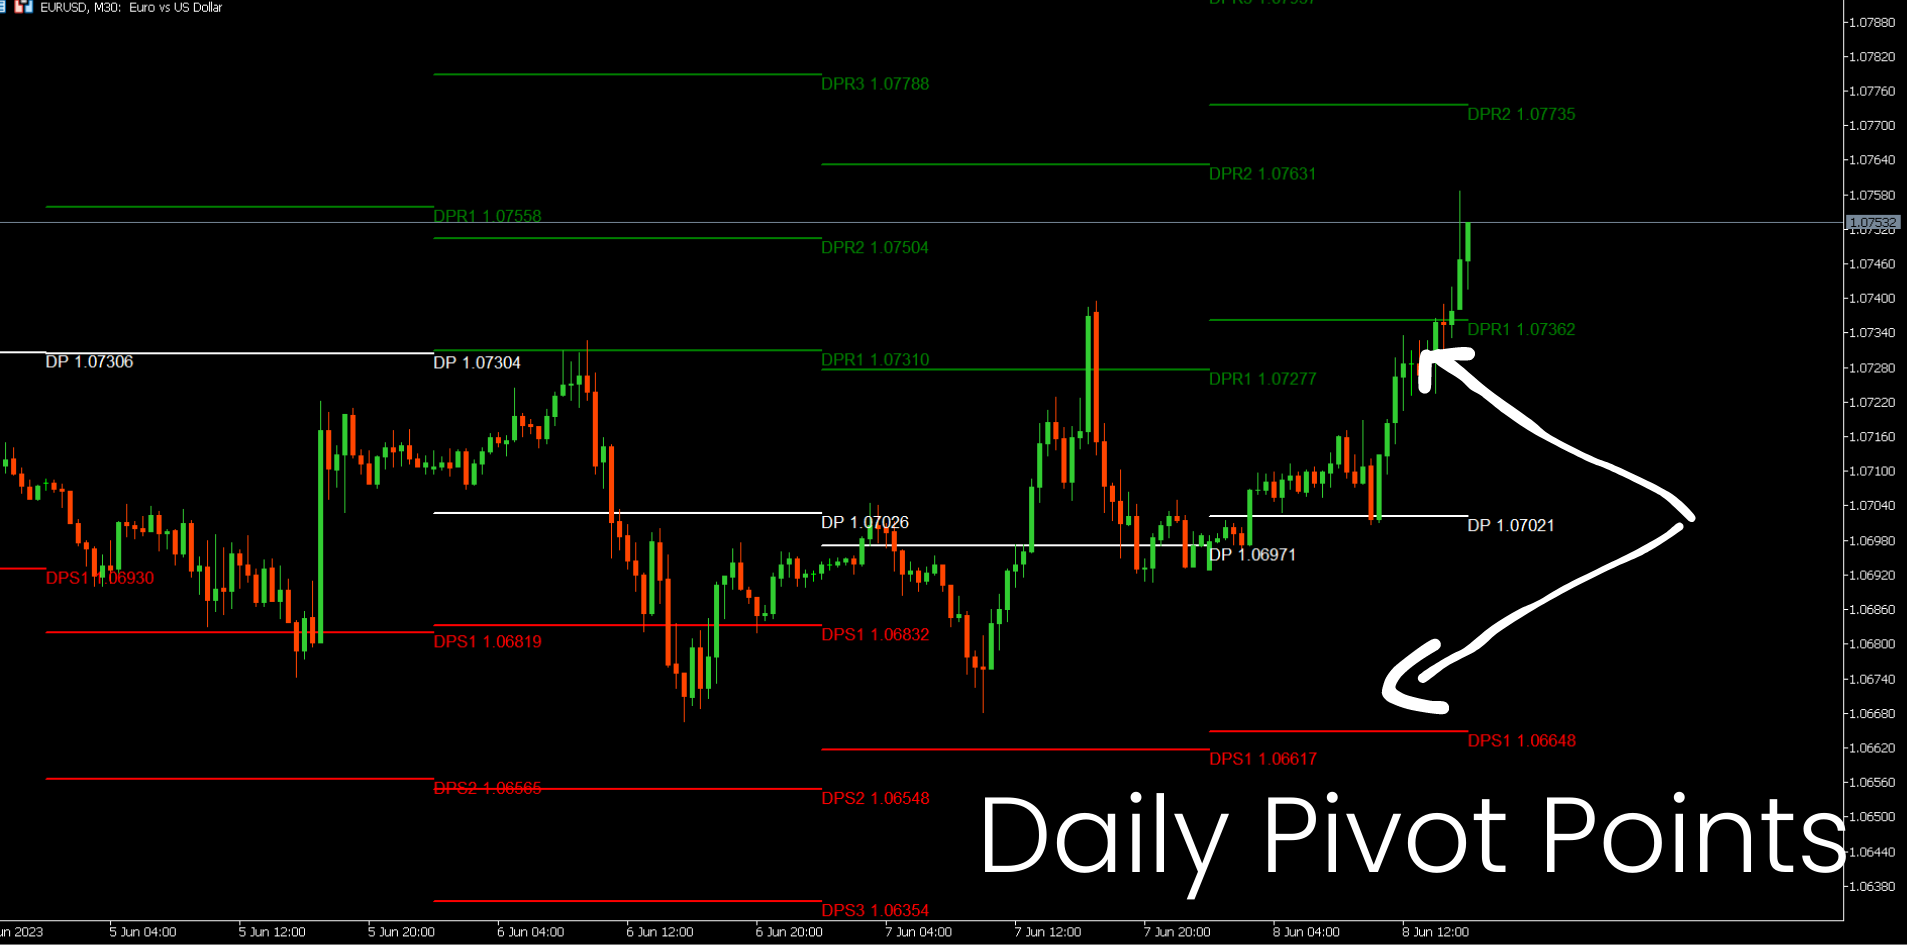
4.デイリーピボットポイント
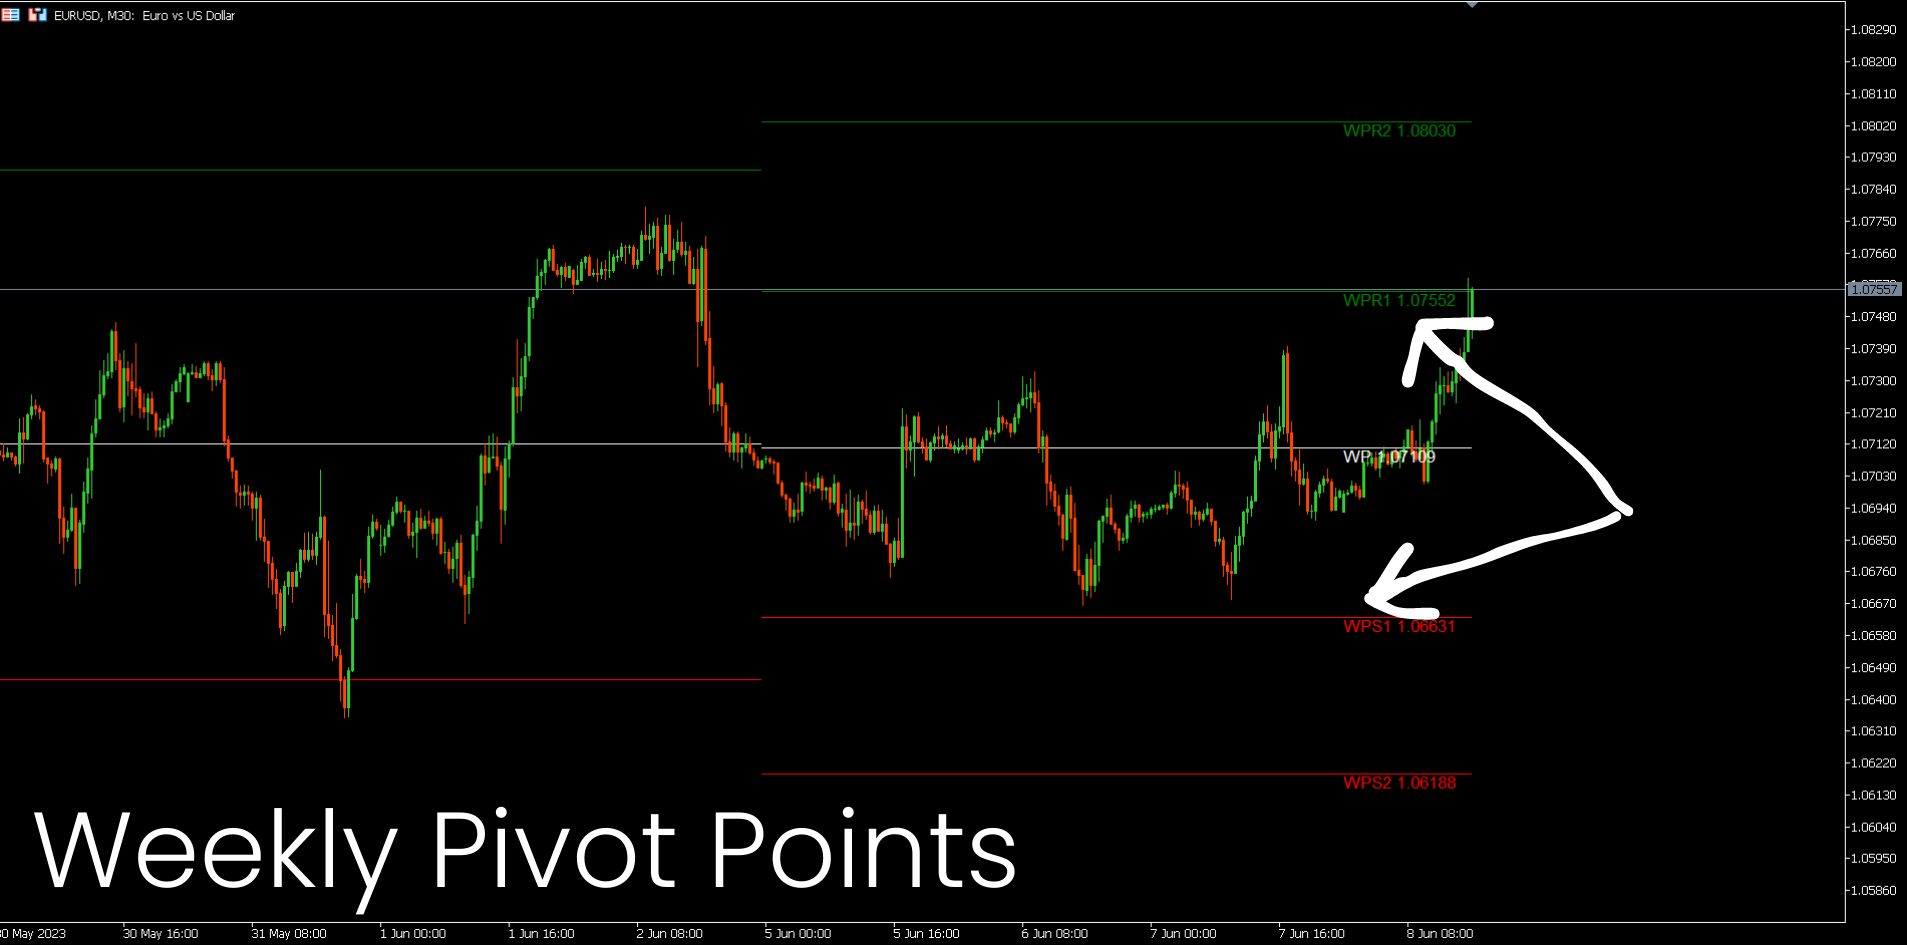
5.毎週のピボットポイント
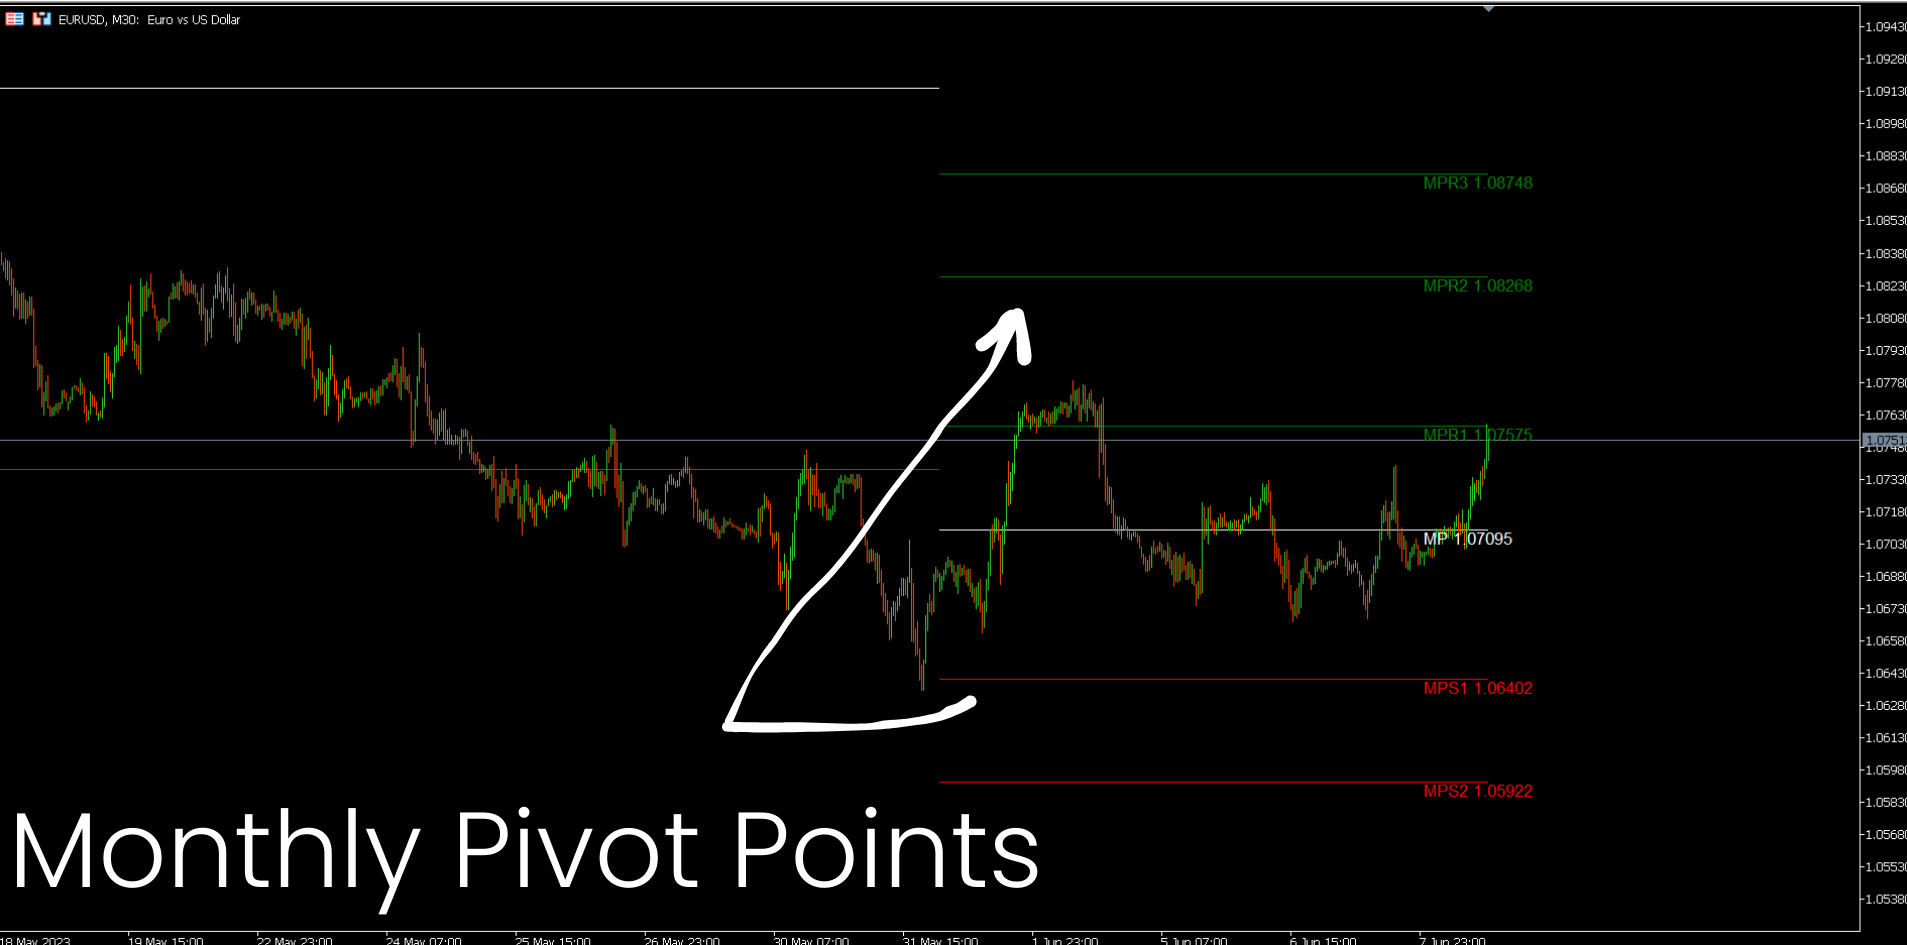
6.毎月のピボットポイント
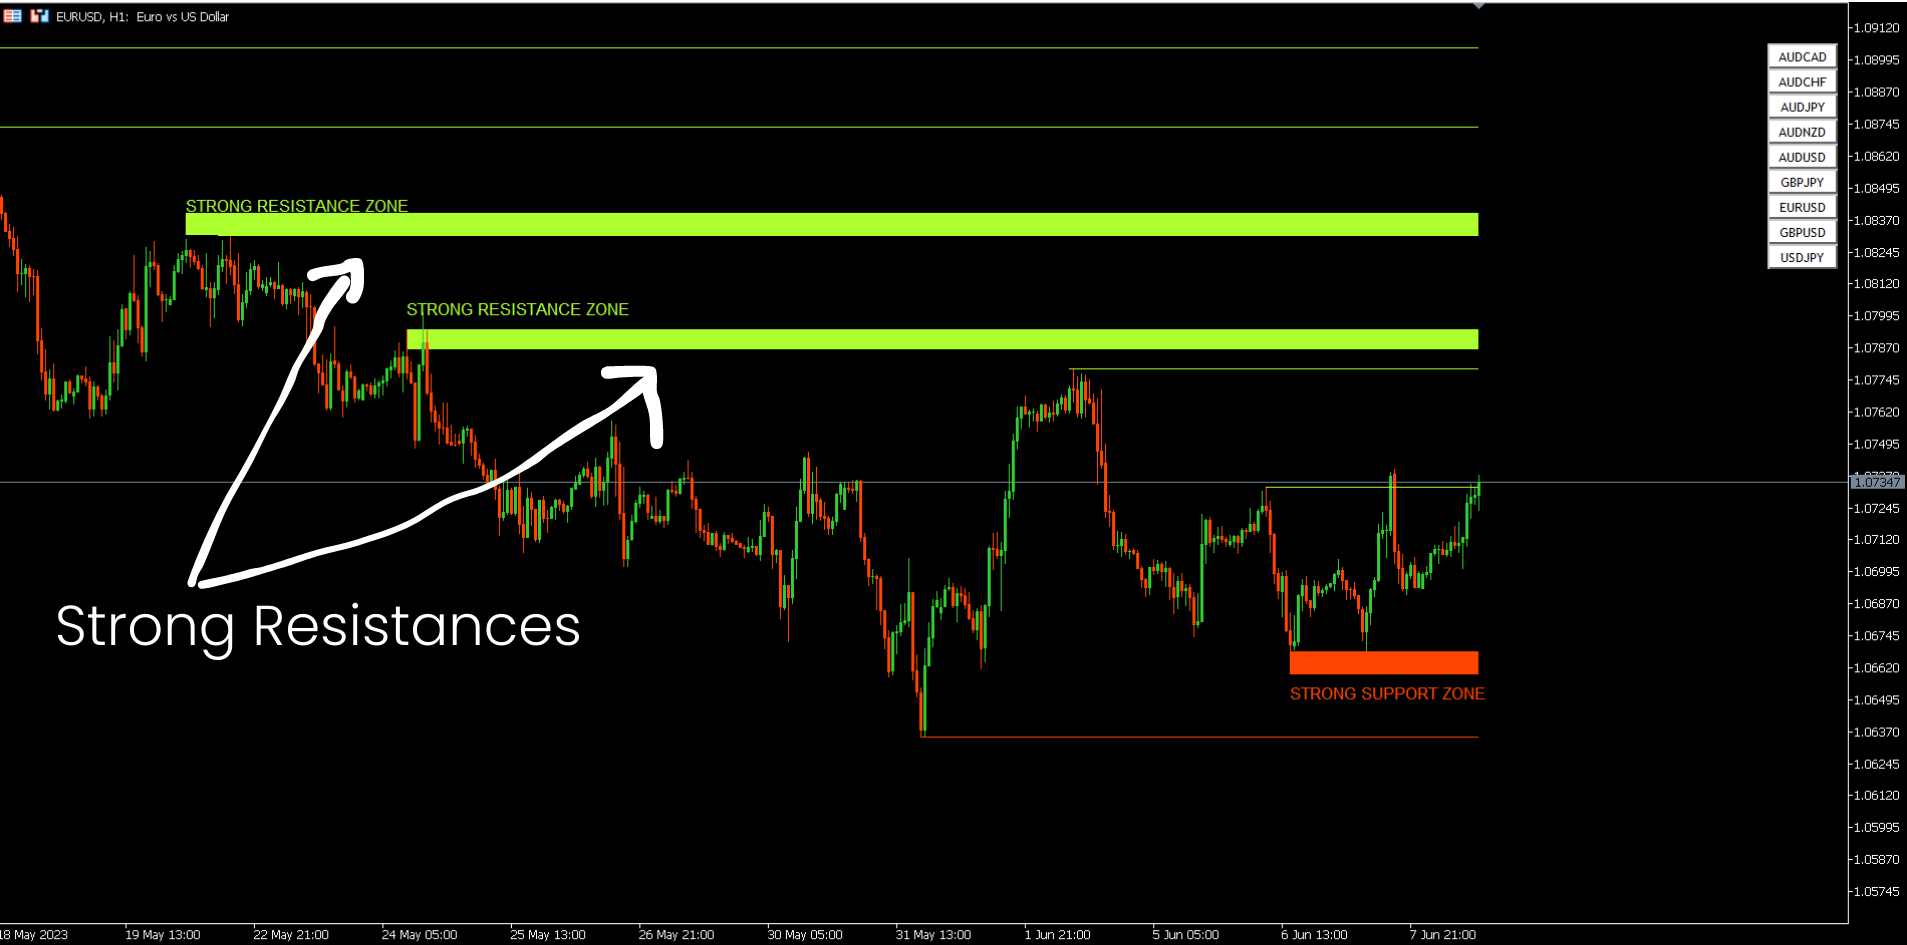
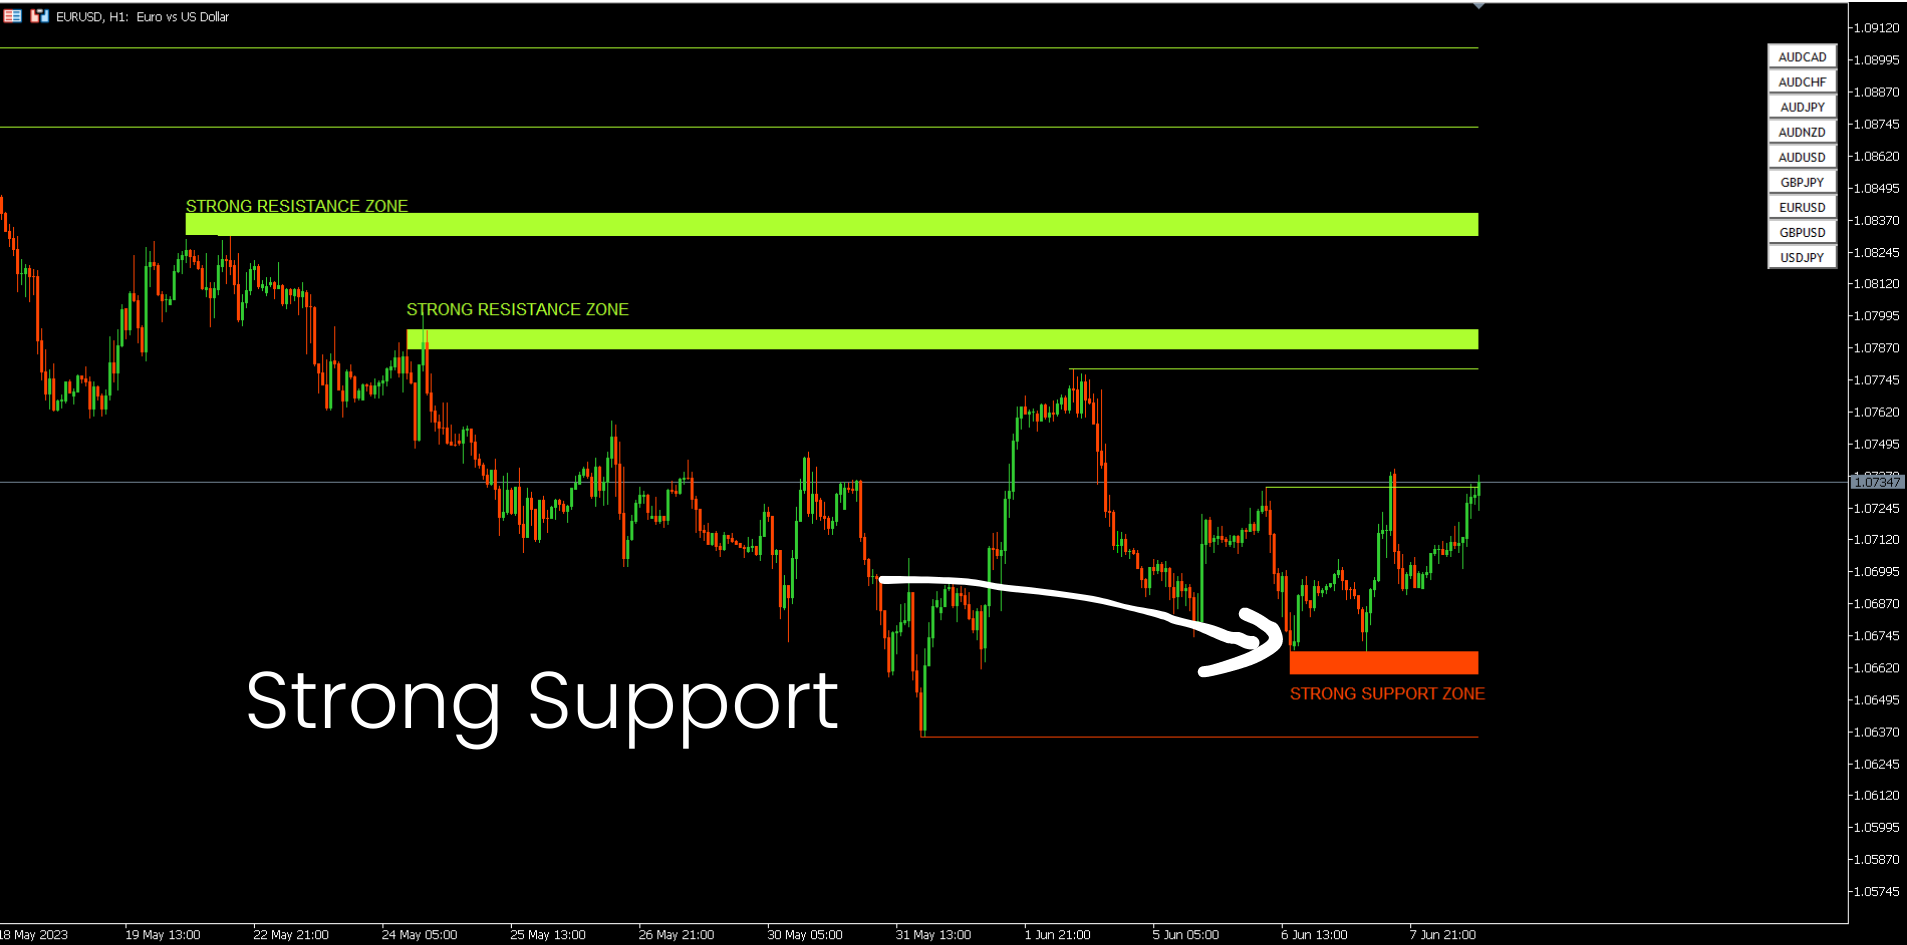
7.ハーモニックパターンとボリュームに基づく強力なサポートとレジスタンス。
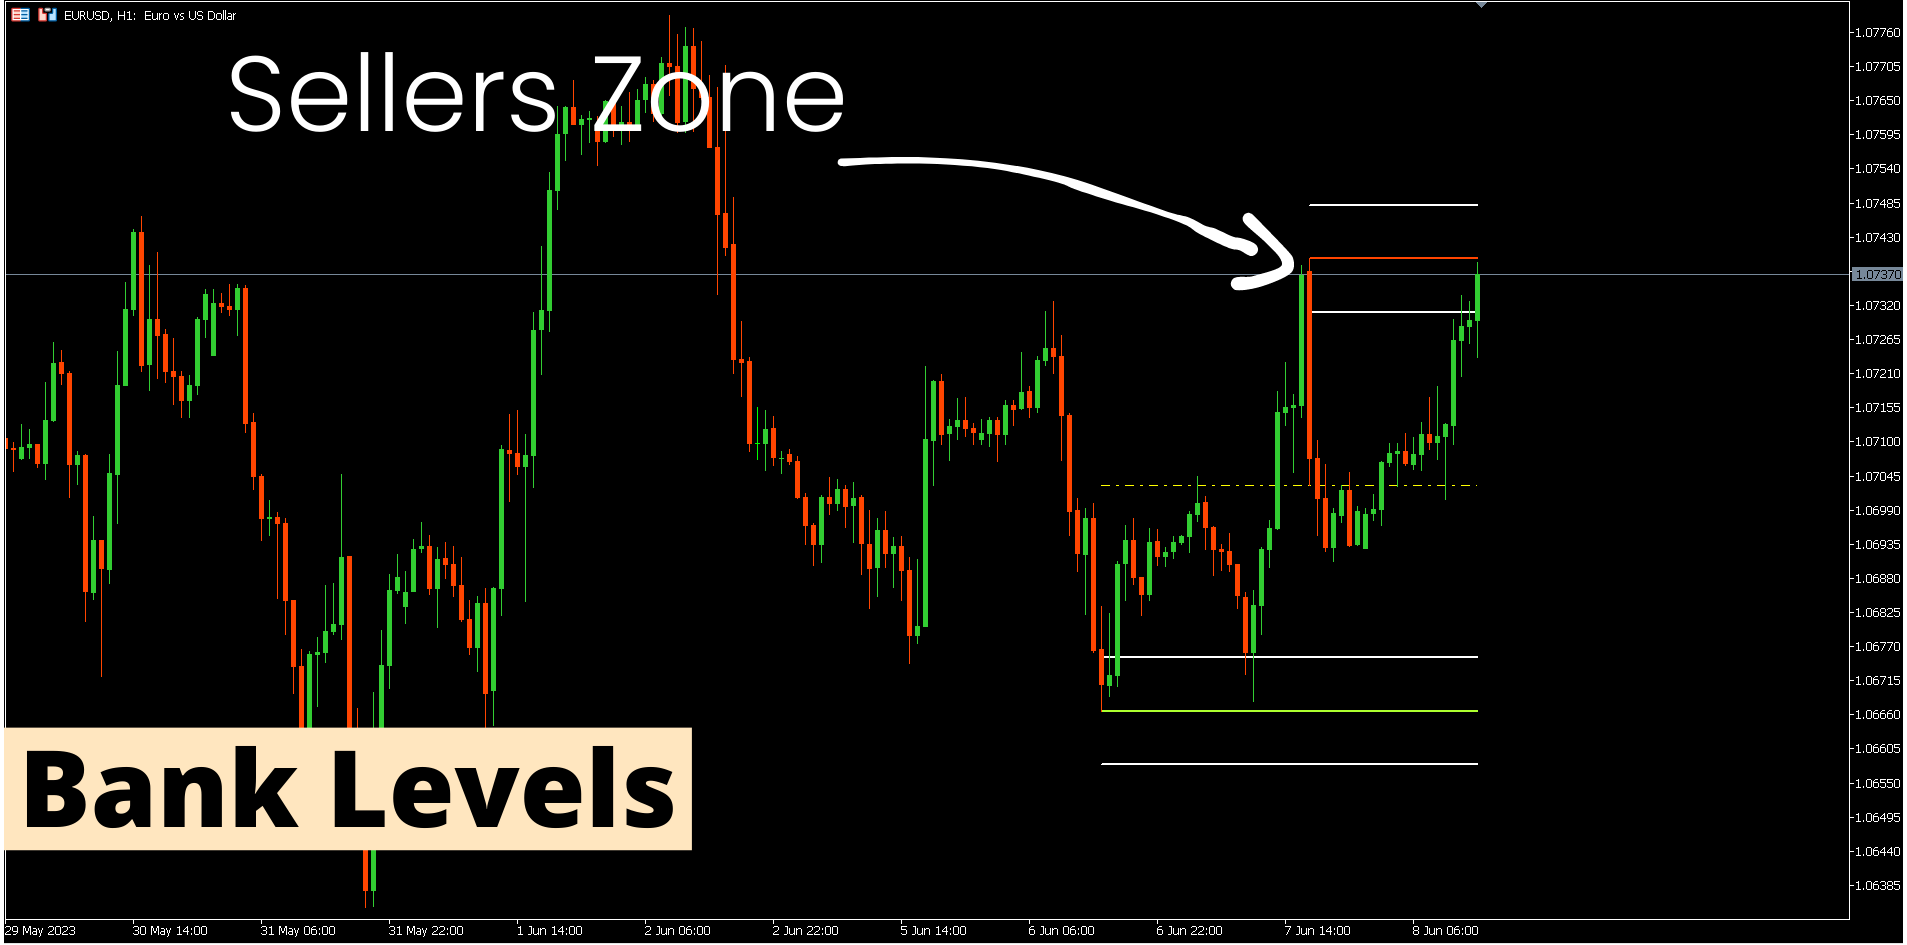
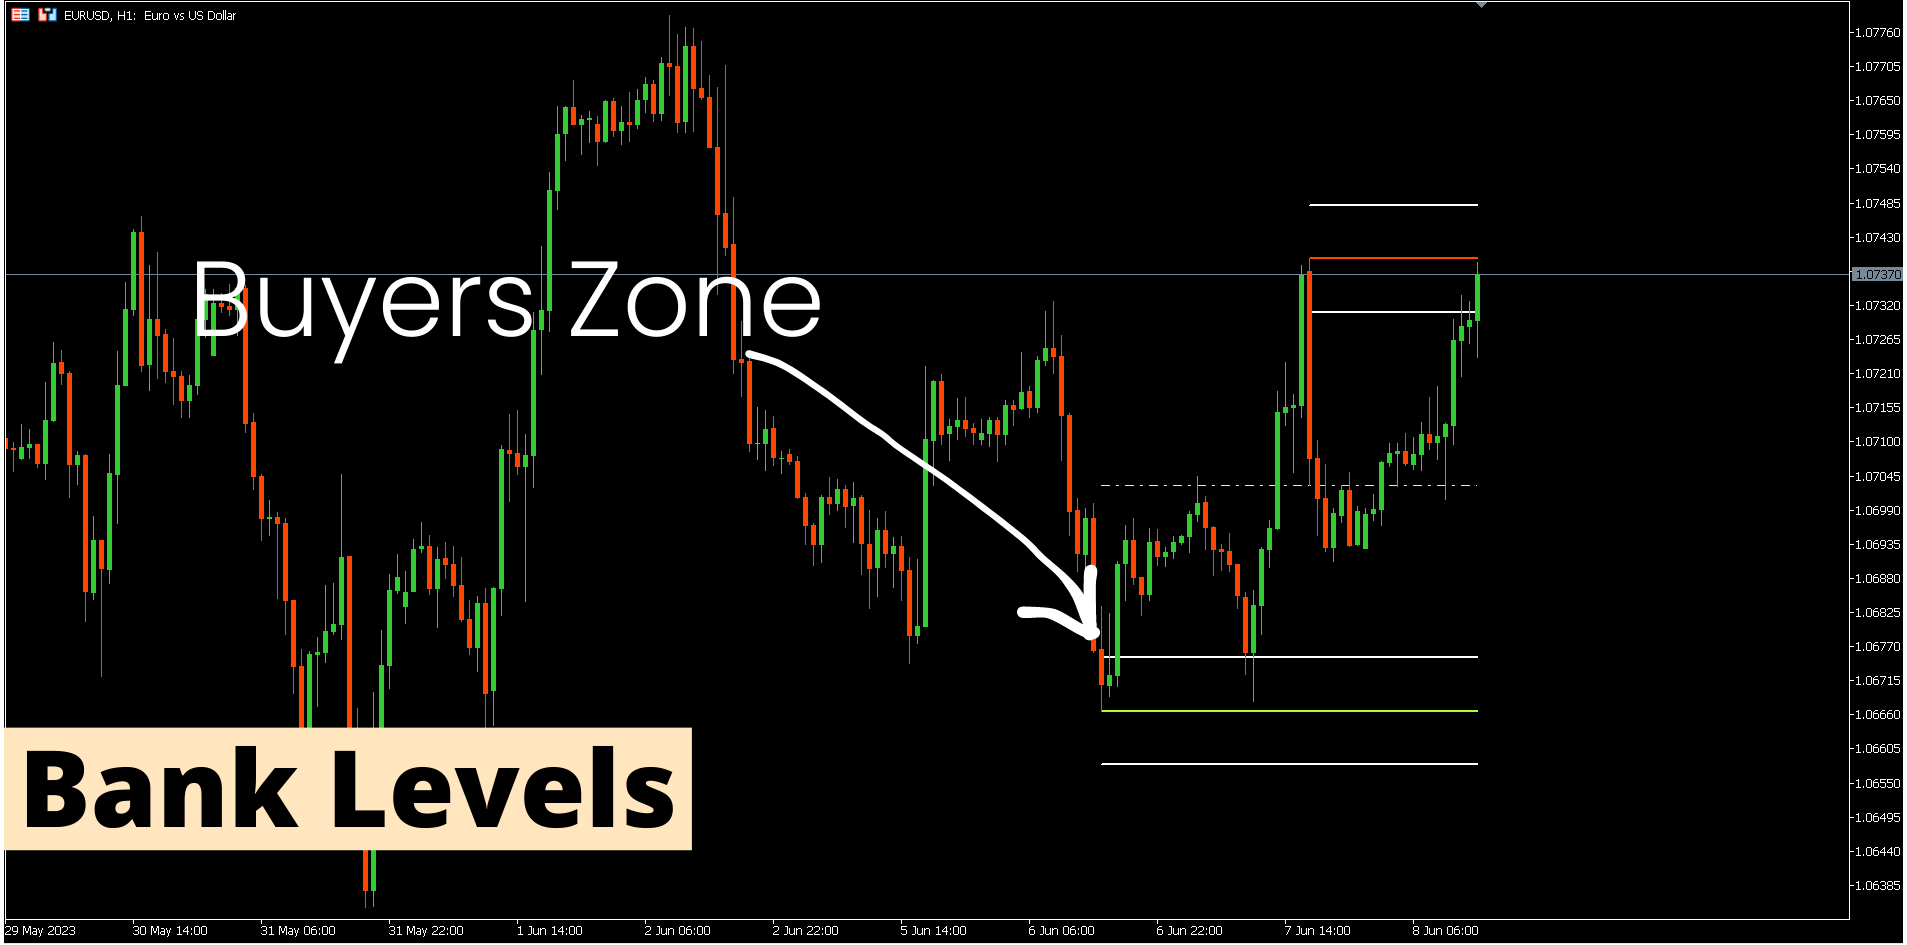
8.銀行レベルのゾーン。
期間限定オファー:HVサポートおよびレジスタンスインジケーターは、50ドルと生涯でのみご利用いただけます。 (元の価格125 $)
MQL5ブログにアクセスすると、分析例を含むすべてのプレミアム指標を見つけることができます。ここをクリックしてください。
主な機能
- ハーモニックおよびボリュームアルゴリズムに基づく強力なサポートおよびレジスタンスゾーン。
- ハーモニックおよびボリュームアルゴリズムに基づく強気および弱気のプルバックゾーン。
- 市場構造スクリーナー
- 毎日、毎週、毎月のピボットポイント。
ドキュメント
すべてのサポートおよびレジスタンススクリーナーのドキュメント(手順)と戦略の詳細は、MQL5ブログのこの投稿で入手できます:ここをクリックしてください。 コンタクト
著者
SAYADI ACHREF、フィンテックソフトウェアエンジニアおよびFinansyaの創設者。 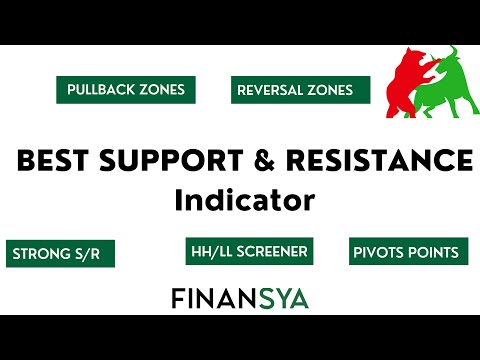


The Best Support and Resistance Indicator on the Market This indicator clearly outperforms every other support and resistance tool I have used in MetaTrader. Support and Resistance Screener Pro MT5 delivers highly accurate and meaningful levels, institutional zones, pivots, structures, and key points that would normally take a lot of time to analyze manually. What I like the most: - Very precise detection of real market zones. - Multi-timeframe and multi-symbol scanning. - Clean and organized visual presentation without noise. - Helps me take faster and better trading decisions. After using it, my market analysis improved immediately. It is a professional and reliable tool with no repainting. I fully recommend it 100%.