Touch VWAP MT5
- インディケータ
- バージョン: 1.0
- アクティベーション: 5

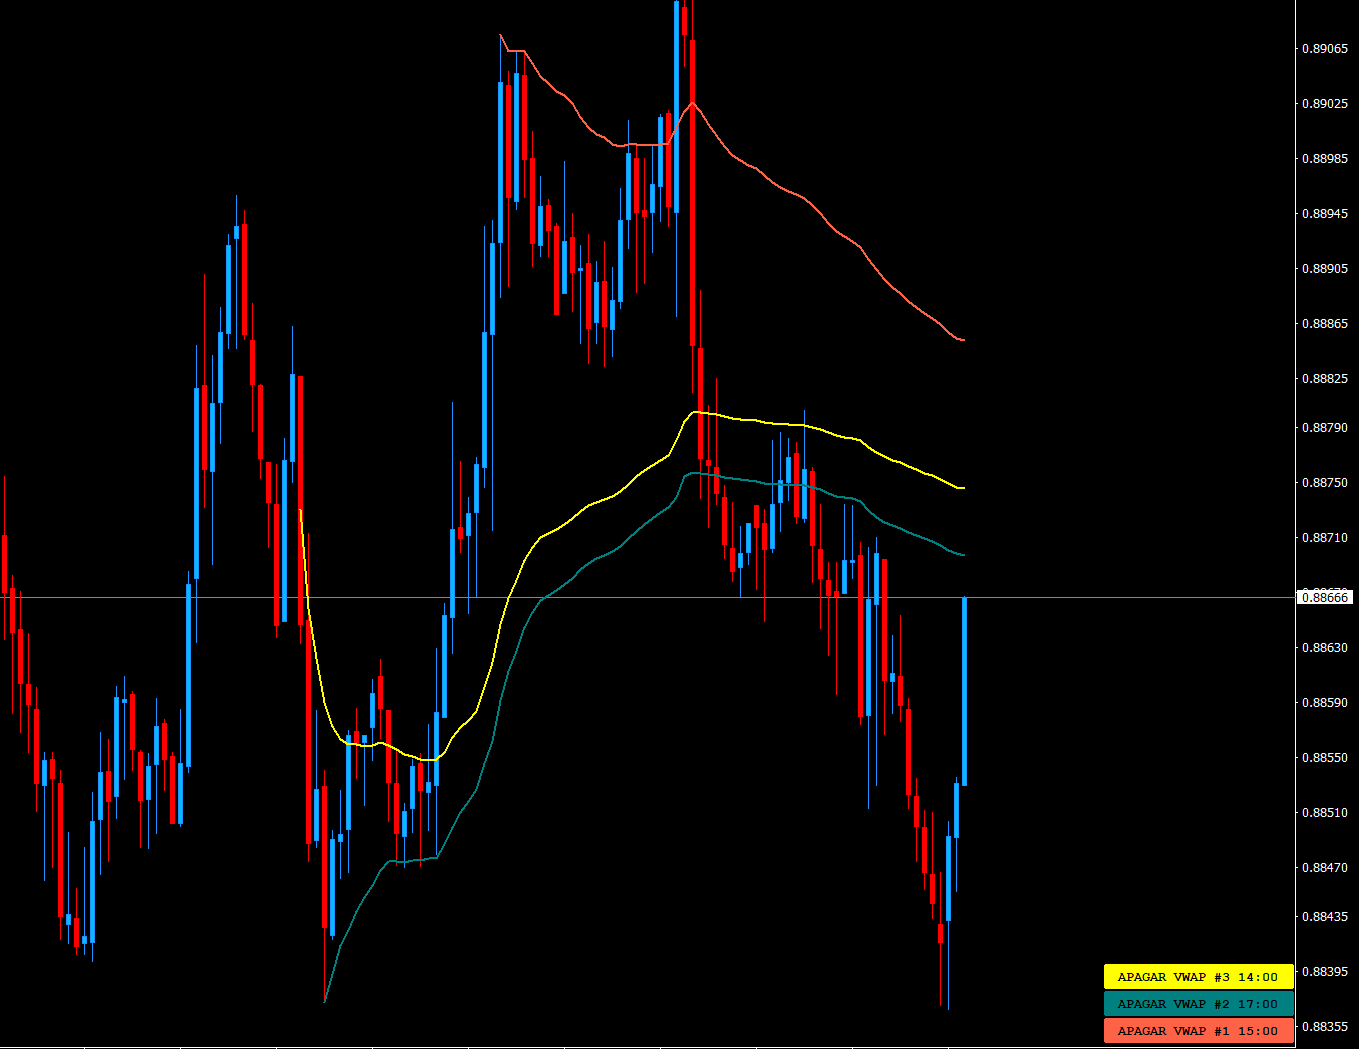
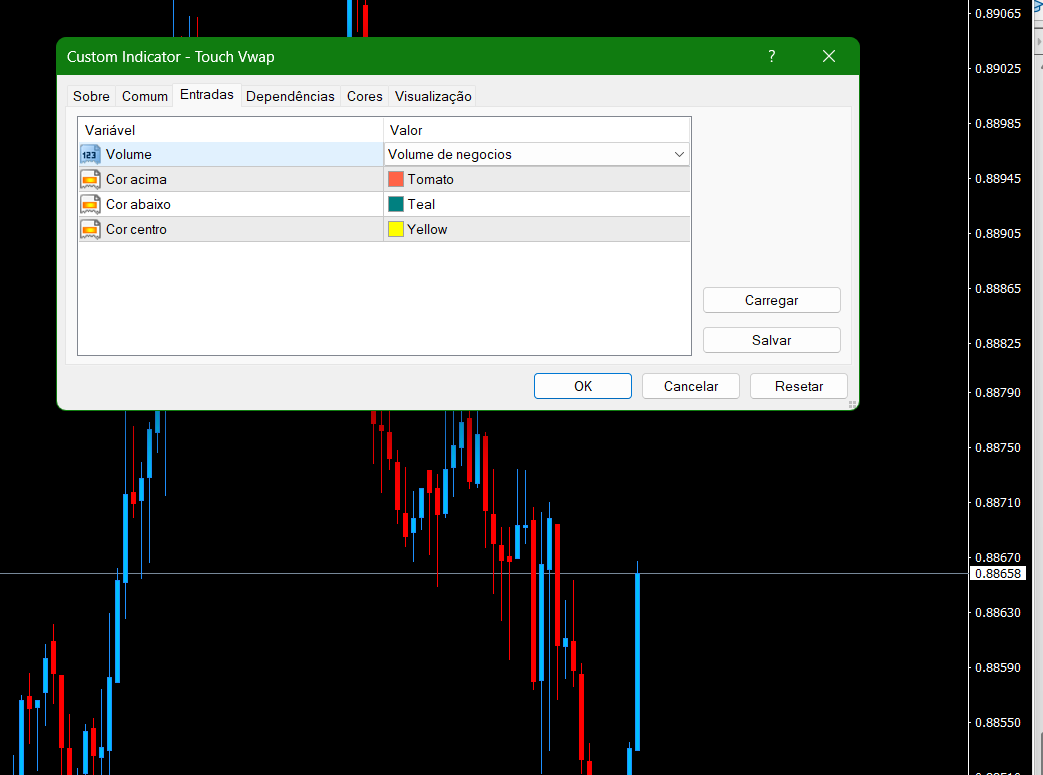
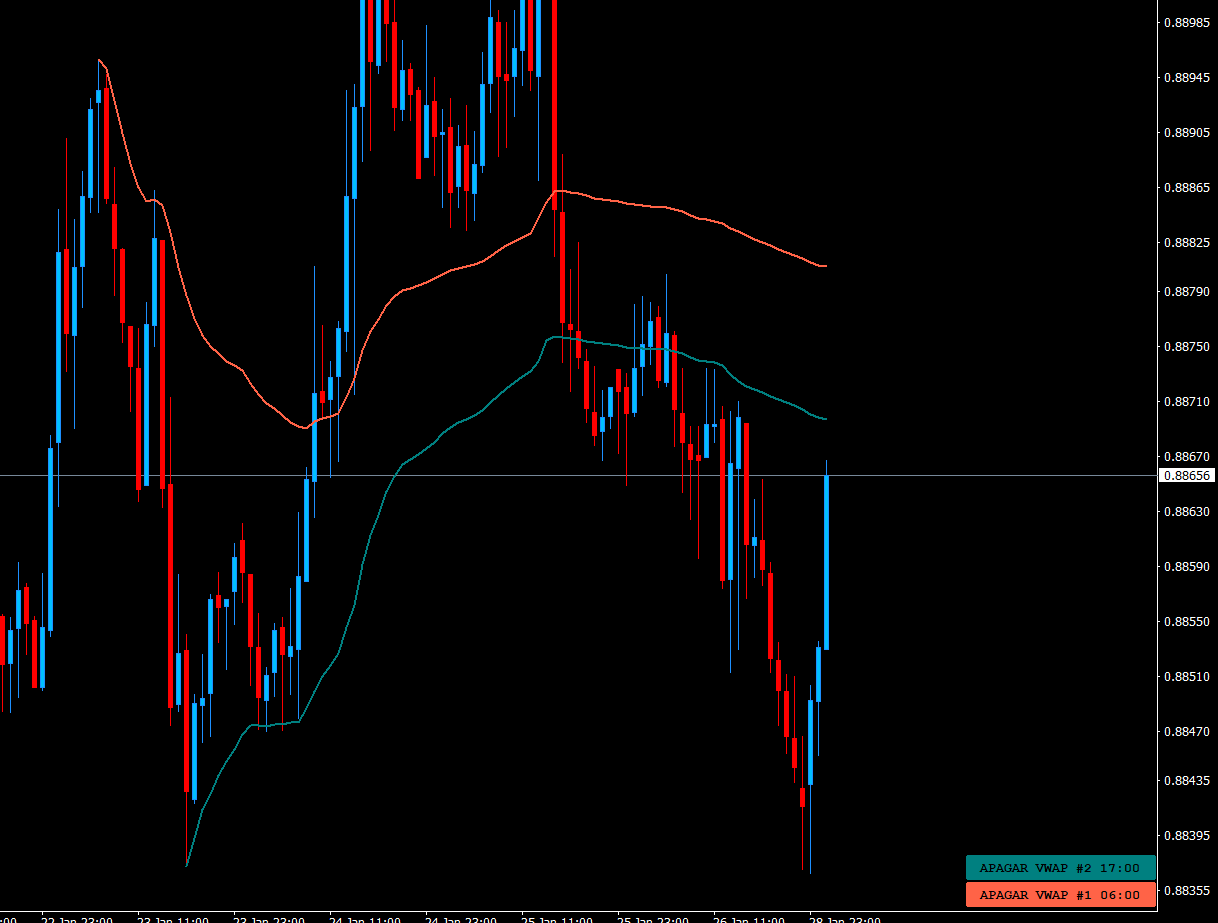
O Touch VWAP é um indicador que permite calcular uma Média Ponderada por Volume (VWAP) apenas apertando a tecla 'w' no seu teclado e após clicando no candle do qual deseja realizar o calculo, clicando abaixo do candle é calculada a VWAP baseado na minima dos preços com o volume, clicando sobre o corpo do candle é calculado uma VWAP sobre o preço medio com o volume e clicando acima do candle é calculado uma VWAP baseado na máxima dos preços com o volume, voce tambem tem a opção de remover a VWAP apenas clicando no botão de apagar.
MT4: https://www.mql5.com/pt/market/product/44923


ユーザーは評価に対して何もコメントを残しませんでした