Sync
- ユーティリティ
- バージョン: 4.12
- アップデート済み: 14 5月 2026
- アクティベーション: 20
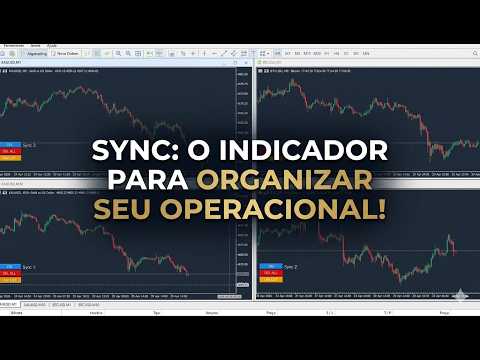
**Sync MT5 – リアルタイムマルチチャート分析マネージャー**
MT5プラットフォームをプロフェッショナルな分析ステーションに変革します。Syncは、複数のウィンドウ間でチャート、オブジェクト、クロスヘアを同期する包括的なツールであり、これまでにない精度と効率で取引できるようになります。
**主な機能**
1. **スマートチャート同期**
- 複数のチャート間でシンボルと時間枠をワンクリックで同期。
- グループシステム – 戦略や資産ごとにチャートを整理。
- 不必要な更新を防ぐ調整可能な感度。
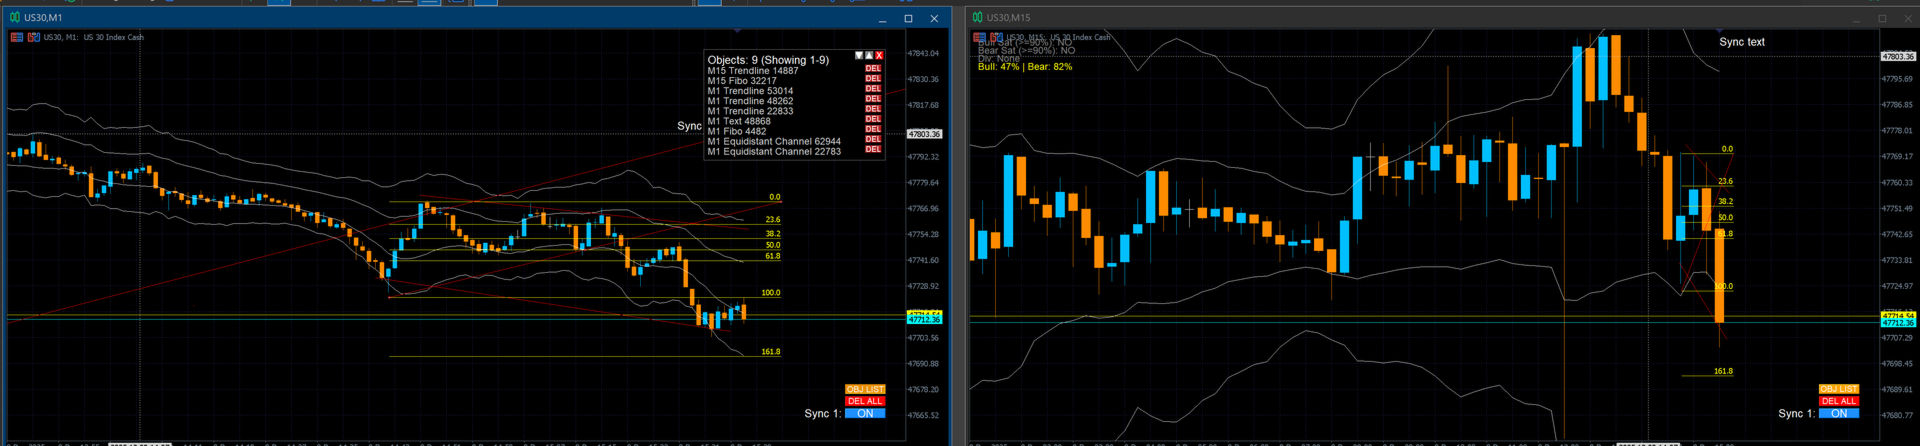
2. **高度なクロスヘア(デュアル軸)**
- グループ内のすべてのチャートで同期されたクロスヘア。
- ローカル時間またはサーバー時間での表示。
- 各チャートでクロスヘアポイントへの自動ナビゲーション。
- ESCキーによる迅速な有効化/無効化。
3. **完全なオブジェクト管理**
- チャート間でのライン、四角形、テキスト、矢印の自動同期。
- スクロールと検索機能付き管理パネル。
- 作成された最新100オブジェクトの履歴。
- 個別または一括削除(現在のチャートのみまたはグループ全体)。
4. **インテリジェントグループシステム**
- 最大32の独立グループ(0=グループなし、1-32=特定グループ)。
- 異なるグループのチャートは互いに干渉しません。
- 複数の戦略を同時に実行するトレーダーに最適。
5. **直感的なインターフェースとクイックコントロール**
- 同期を有効/無効にするON/OFFボタン。
- オブジェクトを素早くクリアする「DEL ALL」ボタン。
- 「OBJ LIST」ボタン付きオブジェクトリストパネル。
- 誤クリック防止機能。
**実用的な使用例**
- **比較分析:** 同一クロスヘアで複数資産を同時比較。
- **マルチ時間足分析:** 異なる時間足で同一価格ポイントを可視化。
- **戦略管理:** 戦略ごとにチャートを分離(例:グループ1=デイトレード、グループ2=スイングトレード)。
- **プロフェッショナルテクニカル分析:** 一度描画したオブジェクトを全チャートに表示。
- **教育/メンターシップ:** 生徒に分析の特定ポイントをリアルタイムで提示。
**カスタマイズ可能な設定**
```mql5
// 同期設定
input bool EnableSymbolSync = true; // チャート間でシンボルを同期
input bool EnableTimeframeSync = false; // 時間枠を同期
input bool EnableObjectSync = true; // グラフィックオブジェクトを同期
input bool EnableCrosshairSync = true; // クロスヘアを同期
input int AllowedCharts = 1; // 同期グループID (0-32)
// クロスヘア設定
input color cursorColor = clrLightGray; // カーソル色
input int crosshairThickness = 1; // 線の太さ
input ENUM_LINE_STYLE crosshairStyle = STYLE_DOT; // ラインスタイル
// オブジェクトパネル設定
input int RowsPerPage = 20; // パネル1ページあたりのオブジェクト数
input bool DeleteObjectsOnAllCharts = true; // 全チャートでオブジェクトを削除
```
**動作方法**
1. 同期したい各チャートにインジケーターをインストール。
2. 全てのチャートで同じグループ番号(`AllowedCharts`)を設定。
3. 必要な同期タイプを有効化。
4. コントロールを使用:
- **マウス + Shift:** 同期クロスヘアを移動。
- **ESC:** クロスヘアを有効/無効。
- **ON/OFFボタン:** 同期を有効/無効。
- **DEL ALL:** グループ内の全オブジェクトを削除。
- **OBJ LIST:** オブジェクト管理パネルを開く。
**利点**
- **時間節約:** 一度描画で全チャートに表示。
- **正確な分析:** 同期クロスヘアでチャート間の読み取り誤差を解消。
- **整理整頓:** 取引を独立したグループで分離。
- **柔軟性:** 必要な同期タイプのみを有効化。
- **パフォーマンス:** 最適化されたコードで、複数チャート開設時もスムーズ動作。
MT5チャート同期, マルチチャート同期, 十字カーソル同期, オブジェクト複製, マルチタイムフレーム分析, トレードステーション, 通貨ペア同期, チャートグループ, トレードツール, 分析マネージャー, レイアウト同期, プロトレーダー, MT5ユーティリティ, 描画同期, 同期スクロール, チャートリンカー, 効率化ツール, プライスアクション, テクニカル分析ツール, マルチモニター操作。
Great tools for market review. Works perfectly as described.