Fimathe Robot

5

Take your technical execution to the highest level with the Fimathe Robot Designed specifically for professional traders who demand absolute precision, stability, and tactical flexibility, this Expert Advisor automates the time-tested Fimathe methodology by combining the intelligence of modern algorithms with a robust, high-performance interface.

With a modern visual layout, the Painel Pro 5.5 offers complete operational freedom: execute trades in 100% manual mode with panel assistance or activate the powerful Automatic Robot with Advanced Trend Detection.

 What's New and Exclusive Features in Version 5.5

  • Premium Interactive Interface: An optimized visual panel equipped with movement enable

  • Advanced Risk Management & Dynamic Lot Sizing: Automatically calculates lot sizes based on your account's risk percentage (using either Balance or Equity), with custom limits (Overrides) for maximum drawdown protection.

  • Multiple REAL Stop Loss Modes: The robot's Stop Loss is intelligent and adaptive via SLDistanceMode, allowing automatic placement at the Neutral Zone, 1 Channel, 2 Channels, or 100% Customized distances.

  • Volatility Filter & Algorithmic Squeeze: Trend detection powered by Squeeze technology (the dynamic crossing of Bollinger Bands and Keltner Channels), integrated with 8 configurable technical triggers (MACD, RSI, Stochastic, CCI, etc.).

  • Dual Time Sessions (Global Trading): Total time control with two independent and configurable trading windows (e.g., trade the Asian Session, New York Session, or Both).

  • Multi-Level Trailing Stop: Protect your profits by automatically trailing your stop as the market hits specific targets (Take 1, Take 2, or Take 3).

  • Smart Channel Slicing: Automatically subdivides channels if the market's range in points exceeds your specified limits, refining your entries during periods of high volatility.

🛠️ Input Parameters Guide

Here is the detailed explanation of each configuration parameter of your robot, organized by functional blocks:

1. Interface & General Settings

  • InpPosicaoPainel: Defines the default chart region where the panel will be anchored (e.g., Top-Center, Top-Left, Bottom-Right).

  • InpTamanhoPainel: Visual scaling of the panel. Allows adjusting the layout scale (from 1x up to 10x) to fit perfectly on any monitor or 4K resolution.

  • AutoStartBotInTester: When enabled ( true ), the robot automatically starts in auto-trading mode when running inside the MT5 Strategy Tester.

  • InpModoBot: Toggles the EA's primary behavior between MODO_MANUAL (where you manually define and trade channels) and MODO_AUTOMATICO (where the robot scans and executes entries entirely on its own).

  • EntradaTrade: Defines the exact order activation trigger point: on the breakout of the CANAL_REFERENCIA (Original Fimathe) or at the TAKE1 level (PCM/C1 technique).

  • InpLanguage: The language used for the panel interface and system logs ( PT_BR or English ).

  • TrailingLevel: The minimum profit level required (Take 1, Take 2, or Take 3) for the system to activate the Trailing Stop feature and begin moving the stop into profit.

  • TargetTakeLevel: Defines how many protection channels the robot will use as the default target for Take Profit during regular trades.

  • TargetTakeLevelZN: Defines the number of target channels for Take Profit specifically when an entry occurs on a Neutral Zone breakout.

  • CandlesParaAnalise: The number of historical bars/candles the algorithm analyzes to calculate initial volatility and map out automatic channels.

  • TempoEsperaReinicio: The programmed cooldown time (in minutes) the robot waits after closing a position before re-analyzing the market and looking for new entries.

  • TempoMaximoSemPosicao: Inactivity safety buffer in minutes. If the robot goes longer than this limit without opening an order, it can trigger an alert or a restart routine.

  • MaxSpreadPips: High-spread protection filter. The robot blocks new trade entries if the broker's current spread is wider than this configured value.

  • PCM: Sensitivity adjustments for the protection channel measurement module (Multiple Channel Projection).

  • Calc_Average_Period / Calc_Max_Percent: Mathematical parameters used to calculate averages and maximum allowable percentages to validate the price channel structure.

  • TimeWaitHighVolatility: Cooldown period in minutes that the robot stays paused if it detects a candle with excessive market volatility.

  • MagicNumber: The unique identifier for this EA's orders. This allows it to manage its own positions exclusively without interfering with other robots on the same account.

  • OrderDeviation: The maximum allowed slippage in points when sending an order to the broker server.

  • MaxGapMultiplier: Safety multiplier for Gap detection. Prevents the robot from entering late if a violent market gap occurs at bar open exceeding this ratio.

  • EnableDiagLog: Enables or disables the print of detailed diagnostic logs in the MT5 "Experts/Journal" tab, ideal for optimization and technical auditing.

2. Risk Management

  • LoteMode: Defines the position sizing mode: LOTE_FIXO (always uses a static volume) or LOTE_PERCENTUAL (calculates the lot size dynamically based on the stop loss in points and account size).

  • LotSize: The fixed order volume (in lots) to be used if LoteMode is set to fixed.

  • RiskPercent: The exact percentage of account equity/balance you are willing to risk per trade if the position hits the actual Stop Loss (e.g., 1.0 = risking 1% of the account).

  • UseEquity: When set to true , the dynamic lot calculation is based on the account's Equity (Margin); if false , it uses the static Balance.

  • SLDistanceMode: Distance mode for the REAL Stop Loss. Choose between placing the stop at the SL_ZONA_NEUTRA (classic Fimathe), SL_UM_CANAL (1 channel away), SL_DOIS_CANAIS (2 channels away), or SL_PERSONALIZADO (Custom).

  • SLCustomPoints: A fixed amount of points for the Stop Loss if SLDistanceMode is configured as custom.

  • LoteMinOverride / LoteMaxOverride: Allows forcing custom minimum and maximum limits on the dynamically calculated lot size, overriding or restricting the broker's default server limits.

3. Visual Configuration

  • InpResistenciaCor / InpSuporteCor: Colors of the interactive horizontal resistance and support lines that define the Reference Channel on the chart.

  • InpBotaoCor: The default color applied to the structural buttons of the user interface.

  • InpLinhaLargura: Width (in pixels) of all channel lines and projections plotted on the screen.

  • InpDeslocamentoPips: Initial distance in points to plot the support and resistance lines when first loading the EA.

  • InpLabelCor / InpLabelFontSize: Color and font size for texts and information labels identifying each Take and Channel level.

  • InpLinhaVerticalCor / InpTimeShift: Style and time shift configurations (in bars) for vertical lines marking trading events.

  • InpNumTakes: Total number of Take Profit projection levels displayed on the chart (supports up to 10 simultaneous takes).

  • InpZonaNeutraCor: Fill or line color marking the current Neutral Zone on the chart.

  • InpTake1Cor to InpTake10Cor: Individual color configurations for each of the 10 Take Profit projection lines, mapping out clear financial targets.

  • InpPossivelZonaNeutraCor: Color used to indicate transition areas and simulated neutral channels before a breakout is confirmed.

  • InpFatiamentoCor: Color of the secondary subdivision lines generated when channel slicing is active.

4. Trend Configuration

(This block manages the Squeeze filter composed of Bollinger Bands and Keltner Channels, alongside the technical oscillator trigger)

  • BB_Period / BB_Deviation: Averaging period and standard deviation for the Bollinger Bands indicator.

  • KeltnerPeriod / KeltnerFactor: Calculation period and distance multiplier for the Keltner Channels indicator.

  • TriggerType: Selects the oscillator indicator that acts as the technical direction filter and momentum trigger. Options include: Stochastic, CCI, RSI, MACD, Momentum, Williams (%R), ADX, or DeMarker .

  • StochasticPeriod, CCIPeriod, RSIPeriod, etc.: Specific period parameters for the indicator selected in TriggerType (the EA exposes all of them so you can fine-tune MACD averages, RSI periods, etc.).

  • TriggerCandle: Defines whether the robot reads indicator data from the currently forming bar ( Current ) or waits for the complete close of the previous bar ( Previous ) to validate the trigger, avoiding false signals.

5. Trading Hours

  • EnableTradingHours: Activates ( true ) or deactivates ( false ) the EA's operational time restriction filter.

  • InpTradingSessionMode: Defines the active trading window: SESSION_1 (trades only the first session), SESSION_2 (trades only the second session), or SESSION_BOTH (utilizes both time windows simultaneously).

  • StartHour_1 / StartMinute_1 to EndHour_1 / EndMinute_1: Exact start and end times for Session 1.

  • StartHour_2 / StartMinute_2 to EndHour_2 / EndMinute_2: Exact start and end times for Session 2.

  • DrawTimeLines: Draws automatic vertical lines on the chart, visually mapping out the start and end of each authorized trading session.

  • CloseOneMinBefore: A security feature that forcefully closes all open positions exactly 1 minute before the specified session trading hours end.

6. Additional Configurations

  • SL_Buffer_Points / TP_Buffer_Points: Extra padding/buffer distance (in points) added to orders to prevent early stop outs or to guarantee precise execution at the Take Profit target.

  • DailyProfitTargetUSD / DailyLossTargetUSD: Daily target goals for Daily Profit Cap (Take Profit) and Loss Limit (Stop Loss) calculated in the account currency. If reached, the robot stops trading for the day.

  • HiLoMode: Changes the calculation base for highs and lows in channel geometry: based on candle wicks/shadows ( HILO_WICK ) or based on the open/close of the candle bodies ( HILO_BODY ).

  • OperarComVolatilidade: When enabled, requires the market to present a calculated minimum volatility threshold before releasing automated trades.

  • FatiarCanais: Allows the EA to subdivide massive channels into smaller fractions to keep the mathematical strategy viable.

  • FatiarAPartirDe: Defines the range threshold in points (e.g., 7000 points). If the measured distance of the automatic channel is greater than this parameter, the robot executes the slicing routine immediately.

FIMATHE PCM BOT ROBOT

レビュー 2
Marcio Goncalves Martins
144
Marcio Goncalves Martins 2026.02.12 19:08 
 

Ola Thiago, coloquei tudo certinho, mas nao fez nada. Vc tem Telegram, tambem podemos conversar por la

おすすめのプロダクト
The Accumulation / Distribution is an indicator which was essentially designed to measure underlying supply and demand. It accomplishes this by trying to determine whether traders are actually accumulating (buying) or distributing (selling). This indicator should be more accurate than other default MT5 AD indicator for measuring buy/sell pressure by volume, identifying trend change through divergence and calculating Accumulation/Distribution (A/D) level. Application: - Buy/sell pressure: above
Introduction One of the patterns in "RTM" is the "QM" pattern, also known as "Quasimodo". Its name is derived from the appearance of "Hunchback of Notre-Dame" from Victor Hugo's novel. It is a type of "Head and Shoulders" pattern.   Formation Method   Upward Trend In an upward trend, the left shoulder is formed, and the price creates a new peak higher than the left shoulder peak . After a decline, it manages to break the previous low and move upward again. We expect the price to
Weis Wave Scouterは、MetaTrader 5向けに開発された革新的なインジケーターであり、WyckoffメソッドとVSA(Volume Spread Analysis)の確立された原則を組み合わせています。精度と深みを求めるトレーダー向けに設計され、累積ボリューム波の分析を通じて市場を戦略的に読み取り、トレンドの反転ポイントや継続ポイントを特定する支援を行います。 Weis Wave Scouterは、クラシック、ナイトビジョン、オーシャンブリーズといったカスタマイズ可能なカラーテーマで、上昇波と下降波を色分けしたヒストグラムで明瞭に表示します。主な機能には、ボリュームピークの検出、低アクティビティゾーン(DeadZone)の識別、およびボリュームベースの波の反転に関するカスタマイズ可能なアラートが含まれます。また、エフォート対リザルト分析、因果関係、需給バランスといったWyckoffおよびVSA理論の基本概念をサポートしています。Brick Size、Volume Scale Factor、Pivot Lookbackといったパラメータで柔軟に調整でき、あらゆるスタ
Master Editionは、ボリュームとマネーフローの視点を通じて市場構造を可視化するために設計されたプロフェッショナルグレードの分析ツールです。標準のボリュームインジケーターとは異なり、このツールはチャート上に日足ボリュームプロファイルを直接表示し、価格発見がどこで行われたか、そして「スマートマネー」がどこに位置しているかを正確に確認できます。 このMaster Editionは、明確さとスピードを考慮して設計されており、ロード時にチャートレイアウトを即座に美化するユニークな自動テーマ同期システムを備えています。 主な機能: 真のマネーフロー計算: 標準のティックボリュームを超えます。「Use Money Flow」を有効にすると、ボリュームは価格によって重み付けされ、特定の価格レベルでの実際の資本コミットメントが明らかになります。 バリューエリア (VA) の可視化: バリューエリア(デフォルトではボリュームの70%)を自動的に計算します。 VA Fill: コントロールゾーンを即座に識別するために、バリューエリアの背景をシェーディングします。 主要レベル: コントロールポイン
Elliott Wave Oscillator Pro for MetaTrader 5 Elliott Wave Oscillator Pro is a precision momentum analysis tool designed to help traders visualize wave structure, trend strength, and market rhythm in real time. By calculating the difference between fast and slow moving averages, the oscillator reveals the internal energy of price movement, allowing traders to better anticipate shifts in momentum and potential wave transitions. This indicator transforms complex Elliott-based momentum behavior into
Wapv Price and volume
Eduardo Da Costa Custodio Santos
MT5のWAPV価格と出来高インジケーターは、(Wyckoff Academy Wave Market)および(Wyckoff Academy Price and Volume)ツールセットの一部です。 MT5のWAPV価格および出来高インジケーターは、チャート上の出来高の動きを直感的な方法で簡単に視覚化できるように作成されました。 それを使用すると、ピークボリュームの瞬間と市場が専門家の関心を持たない瞬間を観察することができます 「スマートマネー」の動きではなく、慣性によって市場が動いている瞬間を特定します。 ユーザーが変更できる4色で構成されています。 赤=オファーの増加 緑=需要の増加 灰色のキャンドル=需要と供給の減少 青=スマートマネー演技 上方向への動きは強さを示します。 下向きの動き弱さを示します。 価格の方向に関係なく、最強のボリュームが上がる必要があります。 R.Wyckoffの理論に基づいて作成されたインジケーター
Volume Candle Indicator
Pablo Filipe Soares De Almeida
MetaTrader 5 用ボリュームカラーヒストグラムインジケーター このインジケーターは、取引量を別ウィンドウにヒストグラムとして表示します。ローソク足の方向に基づき、バーの色が自動的に変化します。終値が始値より高い場合は緑(上昇トレンド)で表示され、終値が始値より低い場合は赤(下降トレンド)で表示されます。これにより、トレーダーは価格変動とボリュームの関係を視覚的に把握できます。 主な機能 ボリュームソース:ティックボリュームまたはリアルボリュームを選択可能。 ボリュームヒストグラムの上に移動平均線を追加でき、平滑化されたボリュームトレンドを確認可能。 対応平均タイプ:SMA、EMA、SMMA、LWMA。 平均期間を自由に設定可能。 すべての銘柄と時間足で動作し、MetaTrader 5 に完全対応。 視覚的にわかりやすい配色設計により、価格変化の強弱を一目で判断でき、トレードタイミングを最適化するのに役立ちます。
「調整可能なフラクタル」はフラクタル インジケーターの高度なバージョンで、非常に便利なトレーディング ツールです。 - ご存知のとおり、標準フラクタル MT5  インジケーターには設定がまったくありません。これはトレーダーにとって非常に不便です。 - 調整可能なフラクタルは、この問題を解決しました。必要な設定がすべて揃っています。 - インジケーターの調整可能な期間 (推奨値 - 7 以上)。 - 価格の高値/安値からの距離を調整可能。 - フラクタル矢印のデザインを調整可能。 - インジケーターにはモバイルおよび PC アラートが組み込まれています。 高品質のトレーディングロボットとインジケーターをご覧になるにはここをクリックしてください! これは、この MQL5 Web サイトでのみ提供されるオリジナル製品です。
Daily Volume Profile (Multi-Day) for MT5 This indicator provides a clean, fast and highly optimized Daily Volume Profile for the last N days , updated automatically every minute without flickering or chart lag. It draws full market structure: POC, VAH, VAL, Value Area, Day High/Low, Volume Distribution Buckets , and adapts dynamically to any timeframe using built-in shifting logic. Key Features: Volume Profile for the last N days (configurable) True daily POC, VAH, VAL with automatic labels
True Weis Wave
Atila Goncalves Firmino
A version based on David Waves' description in his book 'Trade About to Happen' of his adaptation of the Wyckoff wave chart. The indicator directionally accumulates volume, adding to each brick or candle close, with color indication for up and down. it can be used it with tick or real volume, it also changes color when the accumulated value of the previous wave is exceeded, being the trade signal. Yellow color is used for doji candlestick, it will continue with accumulation without zero the sum
Heiken Ashi Signalは、MT5取引端末用に設計されたインジケーターです。 Mt5ターミナルに標準搭載されているHeiken Ashiインジケータがベースになっています。 このインジケータは、マニュアルとして使用できるほか、著者のExpert Advisorによる自動取引でも使用できます。 EAでHeiken Ashiシグナルを使用するには、マーケットエントリーと売買ポジションを開くためのシグナルバッファがあります。 詳しくは下記をご覧ください。 Heiken Ashi Signalインジケーターの特長と特徴。 このインジケータは、どのようなチャート期間でも機能します。 あらゆる資産(通貨ペア、金属、株式、指数、暗号通貨)に適用することができます。 シグナルをもとに、Expert Advisorで独自の戦略に応用し、マーケットに参入することができます。 トレンドの始まりにある価格の反転にタイミングよく反応し、タイムラグなくシグナルを出す。 シグナルが出現した場合は、すでに確定しており、チャートから消えることはありません。 このインジケータは、隣接するバーでシグナルを再
Footprint は、オーダーフロー(Order Flow)と出来高分析のためのインジケーターです。 クラスターレベルでの市場構造の特定、アクティビティの高い主要ゾーンの発見、そして設定ウィンドウを毎回開くことなくチャート上で直接フィルター操作を行うのに役立ちます。 Footprintインジケーターの機能 Bid x Ask、Deltaのクラスターチャート; チャート上のコントロールパネル; フィルター調整用のスライダー; Absorption; Initiative; Stacked Imbalances; Big Trades; dPOC / Dynamic Point of Control; Delta; サイドマーケットプロファイル; 累積デルタ(Cumulative Delta)。 主な利点 高密度のティックフローに対する高速な計算とデータ表示; チャート内管理 — 設定を開くことなく、主要モードとフィルターを直接切り替え可能; 重要な価格レベルとクラスターを強調するためのフィルタリング; シグナルの視覚的ハイライト:吸収、主導権、インバランス、大口取引; 日、週、または現
Renko Plus
Eadvisors Software Inc.
With Renko Plus you can use the features in the Indicator functionality, just add it to the Metatrader5 chart.             The Renko chart is a type of chart, developed by the Japanese, that is constructed using price movement rather than standardized prices and time intervals like most charts. It is believed to be named after the Japanese word for bricks, "renga", as the graphic looks like a series of bricks.             A new brick is created when the price moves a specified pri
Candlestick Pattern Scanner Pro — Indicator Description A comprehensive, customizable candlestick pattern recognition tool for MetaTrader 5, featuring ATR-based signal positioning, dynamic TP/SL levels, and multi-timeframe alert capabilities. Key Features ATR-Based Signal Management ATR Period & Multiplier : Dynamically calculates arrow signal distance based on market volatility. Dynamic TP/SL Levels : Set Take-Profit (TP1/TP2) and Stop-Loss levels using customizable ATR multipliers for
+++++++++++++++++++++++++++++++++++++++++++++++++++++++++++++++++++++++++++++++++++++++++++++++++++++++ +++ Link to EURUSD Only Free Version -->  https://www.mql5.com/en/market/product/156904 +++ Full License -->  https://www.mql5.com/en/market/product/156842 +++++++++++++++++++++++++++++++++++++++++++++++++++++++++++++++++++++++++++++++++++++++++++++++++++++++ +++ XMAS SALE +++ Get this indicator for free when renting the Forecast System Full License  (one license for one account)   +++ Please
The Fractals indicator displays on the chart only fractals with the specified parameters in the indicator settings. This allows you to more accurately record a trend reversal, excluding false reversals. According to the classical definition of a fractal, it is a candlestick - an extremum on the chart, which was not crossed by the price of 2 candles before and 2 candles after the appearance of a fractal candle. This indicator provides the ability to adjust the number of candles before and after t
WaveTrend Oscillator MT5は、モメンタムの変化や潜在的なトレンドの反転を特定することで、市場分析を強化するために設計された強力なトレーディングインジケーターです。すべてのレベルのトレーダーに最適で、このツールはforex、暗号通貨、商品など、さまざまな市場における買われすぎや売られすぎの状況に関する貴重な洞察を提供します。 正確な売買シグナルを生成する能力を持つWaveTrend Oscillator MT5は、トレーダーが情報に基づいた意思決定を行うことを可能にし、短期および長期のトレーディング戦略の成功の可能性を効果的に高めます。 MQL製品のインストールガイド | MT4/MT5で購入したMQL製品の更新 | 一般的なトラブルシューティングガイド | インジケーター設定 / ガイド 主な機能 バッファ統合: インジケーターの値をアクセス可能なバッファとして公開し、Expert Advisorがシグナルベースのトレーディング戦略を利用できるようにします。 迅速かつバックテスト可能: MetaTraderのネイティブOnCalculate()エンジンに基づいて構
WAPV Weis Wave Chart MT5
Eduardo Da Costa Custodio Santos
The Weis Wave Chart for MT5 is a Price and Volume indicator. The Price and Volume reading was widely disseminated through Richard Demille Wyckoff based on the three laws created by him: Supply and Demand, Cause and Effect and Effort vs. Result. In 1900 R.Wyckoff already used the wave chart in his analyses. Many years later, around 1990, David Weis Automated R. Wyckoff's wave chart and today we bring you the evolution of David Weis' wave chart. It shows the amount of Volume and the amount of pips
WAPV Weis Wave Chart Forex
Eduardo Da Costa Custodio Santos
The Weis Wave Chart Forex for MT5 is a Price and Volume indicator. The Price and Volume reading was widely disseminated through Richard Demille Wyckoff based on the three laws created by him: Supply and Demand, Cause and Effect and Effort vs. Result. In 1900 R.Wyckoff already used the wave chart in his analyses. Many years later, around 1990, David Weis Automated R. Wyckoff's wave chart and today we bring you the evolution of David Weis' wave chart. It shows the amount of Volume and the amount o
WBS SMC Without Repaint – Ultimate XAUUSD Scalping Engine (M5 Timeframe) Take your Gold trading to the institutional level with "WBS SMC Without Repaint", a highly advanced premium indicator engineered specifically for XAUUSD (Gold) on the M5 (5-Minute) timeframe.  Built upon the core pillars of Smart Money Concepts (SMC) combined with precise algorithmic candle pattern recognition, this tool identifies high-probability institutional footprints in real-time. Best of all: 100% ABSOLUTELY
UT Bot Simple
Bartlomiej Tadeusz Tomaja
**Features:** 1. **Innovative Trend Tracking:** The UT BOT Simple Indicator leverages the power of the Average True Range (ATR), a renowned volatility measure, to calculate precise trailing stop values, providing unparalleled insights into market trends. 2. **Customizable Settings:** Flexibility is paramount in any trading strategy. With this in mind, our indicator allows you to adjust the ATR periods and other key parameters to tailor the tool to your trading style and strategy. 3. **Real-t
XCycle - MT5用サイクルベーストレーディングインジケーター 概要 XCycleは、市場サイクル理論に基づいたプロフェッショナルなテクニカル分析インジケーターです。このインジケーターはマイナー(短期)およびメジャー(長期)の市場サイクルを検出し、現在のトレンドと市場のボラティリティを考慮して買いシグナルと売りシグナルを生成します。 適用分野 対象市場: - 外国為替(FX) - すべての主要、クロス、エキゾチック通貨ペア - 暗号資産(仮想通貨) - ビットコイン、イーサリアム、アルトコイン(BTC/USD、ETH/USDなど) - 株価指数 - S&P 500、DAX、NASDAQなど - 商品(コモディティ) - 金(XAU/USD)、銀、原油(WTI、ブレント) - 株式 - 流動性の高いブルーチップ株 時間足: - スキャルピング:M1、M5、M15 - デイトレード:M30、H1、H4 - スイングトレード:D1、W1 - ポジショントレード:MN 推奨銘柄: - 高流動性:EUR/USD、GBP/USD、USD/JPY、BTC/USD - 中程度のボラテ
AROON PRO MARKET SCANNER v6.4 プロトレーダー向け高度なマーケットスキャナー Aroon PRO Market Scanner は、市場で最も強力なトレンド分析アルゴリズムの一つである Aroon インジケーターをベースに構築された、高性能かつ機関レベルのスキャニングツールです。 このツールは数十の銘柄を同時に分析し、最も強力な売買機会を数秒で検出します。 なぜ Aroon PRO なのか? マルチシンボルスキャン リアルタイムシグナル生成 高度なフィルタリングシステム 超高速・最適化された構造 MQL5 Market 完全対応(100%) スマートシグナルシステム Aroon PRO は単にシグナルを出すだけではなく、品質に基づいて分析します: トレンド強度の計算 RSI 確認フィルター EMA トレンド確認 シグナル品質スコア(0–100) 優先順位システム フェイクシグナルを最小化 高度なフィルタリング 様々なトレードスタイルに対応: 全てのシグナル 強いシグナルの
LongShort Cointegration
Paulo Henrique Faquineli Garcia
Long & Short Based on Cointegration Statistical and Quantitative Long-Short (Pair Trading) approach for long and short positions. Your CPU will always be safe and stable when using Multiple Linear Regression if you have a reliable indicator. Based on the results of this indicator, you can execute a long and short or a long and long/short and short trade between two separate assets. It can show you a Highly informative dashboard based on Cointegration Search you determine, with all statistical d
Monster Harmonics Indicator is a harmonic pattern indicator. It recognizes Gartley, Bat, Crab, Butterfly, Cypher, White Swan, Black Swan, Shark and AB=CD patterns. Projected patterns that are not yet completed are recognized, too. Monster even shows the PRZ (Potential Reversal Zone). Users can add their own user defined patterns to Monster. Besides the current pattern, Monster also shows all patterns in the symbols history. Monster will provide alerts for developing patterns. Introduced by H.M.
Indicador Padroes de Reversao para Candles
SMART2TRADER SOLUCOES DE SOFTWARES INTELIGENTES LTDA
Developed by Smart Trader - Smart Reversion Pattern is an indicator capable of identifying reversal patterns , both bullish reversals and bearish reversals. It is designed to provide fast, real-time awareness of patterns. We also thought about the interface part, creating a clean and pleasant look to identify formation patterns on the chart. Note: If any pattern you need is not listed, just contact us and request inclusion - we usually respond within a few hours. Bearish Reversal Patterns
Wolfe Wavesは、すべての金融市場に存在する自然に発生する取引パターンであり、均衡価格への戦いを表しています。これらのパターンは、短期および長期の時間枠で発生する可能性があり、現在の最も信頼性の高い予測反転パターンの1つであり、通常は強い長期の価格変動に先行します。 [ インストールガイド | 更新ガイド | トラブルシューティング | よくある質問 | すべての製品 ] クリアな取引シグナル 驚くほど簡単に取引できます カスタマイズ可能な色とサイズ パフォーマンス統計を実装します 適切なストップロスおよび利益レベルを表示します 電子メール/音声/視覚アラートを実装します インジケーターはパターンとブレイクアウト矢印を同時に描画し、インジケーターが展開するときにパターンが再描画されないようにします。ただし、エントリのブレイクアウトが何度も発生し、インジケータが再描画される場合、あまり頻繁にではなく控えめに再描画される可能性があります。インジケータは非バックペインティングです。 オオカミの定義 ウルフ波には、次の特性が必要です。 ( 例を見るにはここをクリック ) ウェーブ
Here   our more valuable tools SMC Trend Trading   ,  Easy SMC Trading  ,  Institutional SMC Architect Volume Analysis Tools  ,  Volume flow Profile  ,  Market volume profile  , FVG with Volume  , Liquidity Heatmap Profile  ,  Volume Spread Analysis The Fractals_Price indicator is a technical analysis tool that identifies fractal patterns on price charts. Fractals are recurring patterns that signal potential trend reversals or continuation points. This indicator marks both upward and downward
CRT Candle Range Theory HTF MT5.   Ultimate CRT Indicator: Advanced ICT Concepts and Malaysian SnR Trading System Master the Market Maker's Footprints with the Most Advanced Candle Range Theory Indicator Unlock the true power of  Smart Money Concepts (SMC)  and trade precisely like the institutions with the  Ultimate CRT Indicator . Built exclusively for serious traders, this indicator automates the highly effective  Candle Range Theory (CRT) , a core pillar of  ICT Concepts (Inner Circle Trader
The Metatrader 5 has a hidden jewel called Chart Object, mostly unknown to the common users and hidden in a sub-menu within the platform. Called Mini Chart, this object is a miniature instance of a big/normal chart that could be added/attached to any normal chart, this way the Mini Chart will be bound to the main Chart in a very minimalist way saving a precious amount of real state on your screen. If you don't know the Mini Chart, give it a try - see the video and screenshots below. This is a gr
このプロダクトを購入した人は以下も購入しています
Trade Assistant MT5
Evgeniy Kravchenko
4.41 (215)
取引 ごとのリスクの 計算、新規注文 の 簡単 な 設置、部分的 な 決済機能 を 持 つ 注文管理、 7 種類 のトレーリングストップなど 、便利 な 機能 を 備 えています 。 追加の資料と説明書 インストール手順   -   アプリケーションの手順   -   デモアカウント用アプリケーションの試用版 ライン機能 チャート上にオープニングライン、ストップロス、テイクプロフィットを表示します。この機能により、新規注文を簡単に設定することができ、注文を出す前にその特徴を確認することができます。   リスク計算 リスク計算機能は、設定されたリスクとストップロス注文のサイズを考慮して、新規注文のボリュームを計算します。ストップロスの大きさを自由に設定できると同時に、設定したリスクを守ることができます。 Lot calc ボタン - リスク 計算 を 有効 / 無効 にします 。 Risk フィールドでは 、必要 なリスクの 値 を 0 から 100 までのパーセンテージまたは 預金通貨 で 設定 します 。 設定」 タブで 、 リスク 計算 の 種類 を 選択 します :「 $ 通
Trade Manager EAへようこそ。これは、取引をより直感的、正確、そして効率的にするために設計された究極の リスク管理ツール です。これは単なるオーダー実行ツールではなく、包括的な取引計画、ポジション管理、リスク管理のためのソリューションです。初心者から上級者、迅速な実行を必要とするスキャルパーまで、Trade Manager EAはあらゆるニーズに対応し、為替、指数、商品、暗号通貨などさまざまな市場で柔軟に対応します。 Trade Manager EAを使用すると、複雑な計算が過去のものになります。市場を分析し、エントリーポイント、ストップロス、テイクプロフィットのレベルをチャート上のラインでマークし、リスクを設定するだけで、Trade Managerが最適なポジションサイズを即座に計算し、SLとTPをピップ、ポイント、口座通貨でリアルタイムに表示します。すべての取引が簡単かつ効果的に管理されます。 主な機能: ポジションサイズ計算機 :定義されたリスクに基づいて取引サイズを瞬時に決定します。 簡単な取引計画 :エントリー、ストップロス、テイクプロフィットを設定するためのド
Local Trade Copier EA MT5
Juvenille Emperor Limited
4.97 (146)
Local Trade Copier EA MT5 による、驚くほど高速な取引コピーを体験してください。1分で簡単にセットアップできるこの取引コピー機は、同じWindowsコンピュータまたはWindows VPS上の複数のMetaTrader端末間で取引をコピーすることができ、0.5秒未満の高速コピースピードを実現します。 初心者であろうとプロのトレーダーであろうと、 Local Trade Copier EA MT5 には、あなたの特定のニーズに合わせてカスタマイズするための幅広いオプションが用意されています。これは、利益の可能性を高めたい人にとって究極のソリューションです。 今すぐ試してみて、これが市場で最も速くて簡単なトレードコピー機である理由を理解してください。 ヒント: デモアカウントで Local Trade Copier EA MT5 デモバージョンをダウンロードして試すことができます: ここ ダウンロードした無料のデモ ファイルを MT5 >> ファイル >> データ フォルダを開く >> MQL5 >> Experts フォルダに貼り付けて、ターミナルを再起動しま
TradePanel MT5
Alfiya Fazylova
4.88 (166)
Trade Panelは多機能なトレーディングアシスタントです。アプリには手動取引用の50以上のトレーディング機能が搭載されており、ほとんどの取引作業を自動化することができます。 購入前に、デモアカウントでアプリのデモ版をテストすることができます。デモアカウント用のアプリの試用版をダウンロードするには、次のリンクをご利用ください: https://www.mql5.com/en/blogs/post/750865 。 完全な手順 こちら 。 取引。 ワンクリックで取引操作を行うことができます: リスクを自動計算して指値注文やポジションを開く。 複数の注文やポジションをワンクリックで開く。 注文のグリッドを開く。 保留中の注文やポジションをグループごとに閉じる。 ポジションの方向を反転(Buyを閉じてSellを開く、またはSellを閉じてBuyを開く)。 ポジションをブロックする(不足している量のポジションを開くことでBuyとSellのポジション量を等しくする)。 すべてのポジションを部分的にワンクリックで閉じる。 すべてのポジションの利食い(Take Profit)および損切り(Sto
================================================================================ POC BREAKOUT - V20.72. Full Professional Grade Toolkit ================================================================================ POC Breakout is a full MetaTrader 5 trading dashboard for discretionary traders who want breakout signals, Point of Control (POC) context, volume profiles, order flow, market structure, news, alerts, and advanced trade planning in one professional workspace. Attached directly to you
ベータリリース Telegram to MT5 Signal Trader はまもなく正式なアルファ版をリリースします。いくつかの機能はまだ開発中で、小さな不具合に遭遇する可能性があります。問題が発生した場合はぜひご報告ください。皆さまのフィードバックがソフトウェア改善に役立ちます。 Telegram to MT5 Signal Trader は、 Telegram のチャンネルやグループからの取引シグナルを自動的に MetaTrader 5 にコピーする強力なツールです。 パブリックおよびプライベートの両方のチャネルに対応し、複数のシグナル提供元を複数のMT5口座に接続可能です。ソフトウェアは高速で安定し、すべての取引を細かく制御できます。 インターフェースは直感的で、ダッシュボードとチャートは見やすく設計されており、リアルタイムで動作状況をモニターできます。 必要環境 MQL の制限により、EA は Telegram と通信するためのデスクトップアプリが必要です。 インストーラーは公式の インストールガイド にあります。 主な機能 マルチプロバイダー: 複数の Telegram
AstroTrade Trading Assistant AstroTrade is a comprehensive multi-functional trading utility developed for the MetaTrader 5 platform. It integrates essential tools for trade execution, risk management, and technical monitoring into a single unified interface. The application is designed to assist traders in managing their daily operations through a visual and structured environment. Visual Trade Execution and Risk Management The application includes a specialized trading panel that assists in c
Farmed Hedge Yield Farming | All Markets (Manual - Hybrid - Semi/Automated EA) MULTI-ASSET SUPPORT Trade any asset available on your broker - Forex: Major, Minor, Exotic pairs - Crypto: BTC, ETH, XRP, SOL, BNB - Stocks: Apple, Tesla, Amazon, Google, etc. - Commodities: Gold, Silver, Oil, Gas - Indices: US30, NAS100, SPX500, DAX40 - Any CFD your broker offers VERIFIED TRADING RESULTS - Farmed Hedge Yield Axi Copy:  https://www.mql5.com/en/signals/2356376 - Farmed Hedge Yield Exn Copy:   https:/
Exp COPYLOT CLIENT for MT5
Vladislav Andruschenko
3.97 (35)
MetaTrader 5 用のプロフェッショナル取引コピー機 MetaTrader 向けの高速・高性能・信頼性の高い 取引コピー機 です。 COPYLOT は、MT4 と MT5 のターミナル間で Forex 取引をコピーでき、 Hedge 口座と Netting 口座の両方に対応しています。 COPYLOT MT5 版の対応構成: - MT5 Hedge → MT5 Hedge - MT5 Hedge → MT5 Netting - MT5 Netting → MT5 Hedge - MT5 Netting → MT5 Netting - MT4 → MT5 Hedge - MT4 → MT5 Netting MT4 版 完全な説明 + DEMO + PDF 購入方法 インストール方法 ログファイルの取得方法 テストと最適化の方法 Expforex のすべての製品 MT4 ターミナルへのコピーも可能です(MT4 → MT4、MT5 → MT4): COPYLOT CLIENT for MT4 COPYLOT は、2台、3台、さらには10台のターミナル間で同時に動作できる、プロフェッ
Power Candles Strategy Scanner - 自動最適化型マルチシンボル設定ファインダー パワーキャンドル・ストラテジー・スキャナーは 、パワーキャンドル・インジケーターを駆動するのと全く同じ自己最適化エンジンを、マーケットウォッチに登録されているすべての銘柄に対して並行して実行します。1つのパネルで、現在統計的に取引可能な銘柄、各銘柄で勝率の高い戦略、最適なストップロス/テイクプロフィットの組み合わせが表示され、新たなシグナルが発生した瞬間に通知が届きます。 このツールは、Stein Investmentsのエコシステムの一部です。  18種類以上のツールをすべて閲覧し、AIを活用したセットアップの推奨を受け取り、  https://stein.investments でコミュニティに参加しましょう 市場動向を網羅。銘柄ごとに3,000件以上の自動最適化。2種類のアラート。ワンクリックでチャートを切り替えて即座にアクション。 なぜこれが必要なのか 多くのマルチ銘柄スキャナーは、 価格の動き (ボラティリティ、変動率、銘柄ごとのRSI)を表示するだけです。それ
Telegram to MT5 Multi-Channel Copier は、Telegram チャンネルのトレードシグナルを MetaTrader 5 に自動的に直接コピーします。ボットも、ブラウザ拡張機能も、手動コピーも不要。Telegram でシグナルを受信すると、EA が数秒でターミナル上でトレードをオープンします。 本製品は 2 つのコンポーネントで構成されています:Telegram チャンネルを監視する Windows アプリケーションと、MT5 ターミナルでシグナルを実行するこの Expert Advisor です。MT4 版も利用可能です。 セットアップガイドとアプリケーションのダウンロード: https://www.mql5.com/en/blogs/post/768988 動作原理 Windows アプリケーションは、ボットではなくあなた自身の API 認証情報を使用して Telegram に接続します。つまり、プライベートおよび VIP チャンネルを含む、購読しているあらゆるチャンネル、グループ、トピックを読み取ることができます。シグナルを検出すると、それを解析し
Premium Trade Manager - コーチ内蔵型トレードパネル Premium Trade Manager は、AIトレーディングコーチをあなたのチャートの中に置き、その下に完全な執行エンジンを備えたツールです。いつも通りにトレードをセットアップし、あなた専任のAIトレーディングコーチ Max にそのセットアップをそのまま読み取らせて、発注前に率直な見解を伝えてもらいましょう。ストップの幅が規律あるアプローチに合っているか、リスクサイズは適切か、高影響のニュースイベントが数分後に迫っていないか、プロップファームの制限に近づいていないか。その下には、クリックの後をすべて処理するエンジンが備わっています。ワンクリックのリスクサイズ計算による発注、チャート上でドラッグして組み立て、発注後も動かせるプラン、最大4段階の分割利確、7種類のトレール方式、リアルタイムのプロップファームコンプライアンス、ニュースガード、そしてコストを自ら採点するスプレッド機能。判断はあなたが下す。Max がもう一度確認する。後のことはすべてパネルが担う。 購入前に実際に触れて試せます。 ブラウザ上でライブ
Telegram To MT5 — シグナルコピア Telegram チャンネルのトレードコールを、実際の MT5 注文に変換します — 自動で、好きなだけの口座に対応し、リスクとルールは完全にあなたの管理下に置けます。 Telegram To MT5 は、あなたが Telegram で既にフォローしている VIP / シグナルチャンネルを MetaTrader 5 端末に接続します。無料の付属デスクトップアプリがメッセージを読み取り(ボットを禁止しているチャンネルでも可能)、この EA があなたの口座でそれらを執行します — あなた自身のリスク設定、シンボルマッピング、テイクプロフィット処理、セッションおよびニュースフィルターを適用します。 これはシグナルコピアであり、ブラックボックス戦略ではありません。どのチャンネルを信頼するか、各トレードのロットと管理方法をあなたが決めます。 ステップバイステップの設定と付属アプリのインストールガイド 仕組み [あなたの Telegram チャンネル] -> [付属デスクトップアプリ] -> [MT5 + この EA] -> 注文 付属デスクトッ
Trade copier MT5
Alfiya Fazylova
4.57 (51)
Trade Copierは、取引口座間の取引をコピーして同期するように設計された専門的なユーティリティです。 コピーは、同じコンピューターまたはvps にインストールされている、サプライヤーのアカウント/端末から受信者のアカウント/端末に行われます。 キャンペーン - すでに「Trade copier MT5」をご購入の方は、「Trade copier MT4」を無料で入手できます(MT4 → MT5 および MT4 ← MT5 のコピー用)。詳細な条件については、どうぞ個別メッセージでお問い合わせください。 購入する前に、デモ アカウントでデモ バージョンをテストできます。 デモ版 こちら 。 詳細な説明は こちら 。 主な機能と利点: MT5ネッティングアカウントを含む、MT5> MT5、MT4> MT5、MT5> MT4のコピーをサポートします。 高いコピー速度(0.5秒未満)。 ベンダーモードと受信者モードは同じ製品内に実装されています。 チャートから直接リアルタイムでコピーを制御できる、簡単で直感的なインターフェイス。 接続が切断されたり、端末が再起動されたりしても、設定と位
VirtualTradePad PRO SE MT5 — MetaTrader 5向けプロフェッショナル取引コントロールセンター VirtualTradePad PRO SE は、 MetaTrader 5 向けのプレミアムなチャートベースの取引パネルであり、トレード管理ワークスペースです。より速い執行、明確なポジション管理、構造化されたトレード管理、視覚的なレベル計画、そしてチャート上で完結するプロフェッショナルなワークフローを求めるトレーダー向けに設計されています。 これは単なる BUY / SELL パネルではありません。PRO SE は、手動取引、予約注文、ポジション管理、部分決済、バスケット損益管理、平均化レベル、ATMルール、シグナル監視、リアルタイム市場情報、ストラテジーテスター (Strategy Tester) ワークフロー、VPS向け運用を、1つの連携されたインターフェースに統合します。 MT4版 | 完全な説明とスクリーンショット | 購入方法 | インストール方法 | ログファイルの取得方法 | テストと最適化の方法 | Expforex のすべての製品 PRO
Footprint Chart Pro — Professional OrderFlow EA for MetaTrader 5 Version 6.34 | Professional tool for real traders | Institutional-Grade Visualization DEMO USERS - PLEASE SELECT EVERY TICK / REAL TICK WHEN TESTING AND YOU HAVE DOWNLOADED HISTORICAL DATA. IF YOU SEE A WAITING SCREEN AND IT IS NOT DOWNLOADING, IT MEANS YOU HAVE LOW HISTORICAL DATA. TRY 1 MIN AND 5 MIN FIRST ON 1 DAY DATA. ONE DAY DATA SHOULD BE THE NEWEST AND MOST CURRENT DATE. PLEASE WAIT UNTIL THE MARKET HAS ROLLED OVER PERIOD.
Anchor: The EA Manager Your EAs manage their own trades. Anchor manages the account around them. Anchor gives you one place to control your EAs, manage risk and decide when trading is allowed. Any EA, any vendor, any broker or symbol. No source-code changes required. The Problem Most EAs only know what they are doing. They cannot see when another EA is already trading, when several EAs open and are stacking risk or when the account has reached your loss limit. Even using just one EA, it may not
Timeless Charts
Samuel Manoel De Souza
5 (7)
Timeless Charts is an all-in-one trading utility for professional traders. It combines custom chart types such as Seconds Charts and Renko with advanced order flow analysis using Footprints , Clusters , Volume Profiles , VWAP studies, and anchored analysis tools for deeper market insight. Trading and position management are handled directly from the chart through an integrated trade management panel , while Market Replay and Virtual Accounts provide environments for practicing trading skills and
Trade Manager は、リスクを自動的に計算しながら、取引を迅速に開始および終了するのに役立ちます。 過剰取引、復讐取引、感情的な取引を防止する機能が含まれています。 取引は自動的に管理され、アカウントのパフォーマンス指標はグラフで視覚化できます。 これらの機能により、このパネルはすべてのマニュアル トレーダーにとって理想的なものとなり、MetaTrader 5 プラットフォームの強化に役立ちます。多言語サポート。 MT4バージョン  |  ユーザーガイド + デモ Trade Manager はストラテジー テスターでは機能しません。 デモについてはユーザーガイドをご覧ください。 危機管理 % または $ に基づくリスクの自動調整 固定ロットサイズを使用するか、ボリュームとピップに基づいた自動ロットサイズ計算を使用するオプション RR、Pips、または価格を使用した損益分岐点ストップロス設定トレーリングストップロス設定 目標に達したときにすべての取引を自動的に終了するための 1 日あたりの最大損失 (%)。 過度のドローダウンからアカウントを保護し、オーバートレードを防ぎます
Custom Alerts AIO:マルチマーケット監視を一括で実現 — 設定不要ですぐに使えるインテリジェントツール 概要 Custom Alerts AIO は、追加のインジケーター設定が不要で、インストール後すぐに利用できる高機能マーケットスキャナーです。FX Power、FX Volume、FX Dynamic、FX Levels、IX Power を内部にすべて統合し、主要なすべての資産クラス(為替、金属、指数、暗号資産)を一括監視できます。MetaTrader の仕様により、株式は個別のシンボルとして追加可能ですが、一般的には利用頻度は低めです。 1. なぜ Custom Alerts AIO を選ぶべきか 追加ライセンス不要 • 必要なすべての Stein Investments インジケーターが内蔵されており、すぐに使用可能です。 • チャートに表示されるグラフィックは省略されており、アラート生成に特化した構成です。 市場を広範囲にカバー • 為替、金属、暗号資産、株価指数に対応(株式は手動追加可能)。 • シンボル名を入力する必要はなく、プロパティで資産クラス
Trade Dashboard simplifies how you open, manage, and control your trades, with built-in lot size calculation. It allows you to execute trades, manage risk, and control positions directly on the chart, with tools such as partial close, breakeven, and trailing stop. Designed to reduce manual work and help you stay focused on your trading decisions. A demo version is available for testing. Detailed explanations of features are provided within the MQL5 platform. Installation instructions are include
Seconds Chart - MetaTrader 5で秒足チャートを作成するユニークなツールです。 Seconds Chart を使用すると、秒単位のタイムフレームでチャートを構築でき、標準的な分足や時間足チャートでは得られない柔軟性と分析精度を実現します。例えば、 S15 は15秒足を表します。カスタムシンボルをサポートしているインジケーターやEAをすべて使用できます。標準的なチャートと同様に便利に操作できます。 標準的なツールとは異なり、 Seconds Chart は超短期のタイムフレームでも高い精度と遅延なく作業できるように設計されています。 Free Demo: Seconds Chart v2.29 Demo.ex5 無料デモをダウンロードしてご自身でお確かめください: 完全機能版 - すべての機能が利用可能 24時間テスト - 精度と利便性を評価するのに十分な時間 デモ口座のみ - ほとんどのブローカーで簡単に開設可能 GBPCADチャートのみ - ほとんどの端末で利用可能 これらの制限はデモ版のみに適用されます。製品版は、あらゆる口座タイプ(リアル、デモ、コンテス
EA Auditor
Stephen J Martret
5 (4)
EA Auditor is an independent analysis tool for traders evaluating Expert Advisors and trading signals on MetaTrader 5. It audits backtest reports, reviews posted developer signals, and cross-verifies the two against each other to help traders assess strategies before committing capital. The MQL5 market offers a wide range of Expert Advisors from many developers, with varying approaches, quality, and transparency. EA Auditor provides a consistent, data-driven framework for reviewing them, answer
追加のリソースと説明書 インストール手順 - デモアカウント用試用版ダウンロード ; 公式情報 公式チャンネル 開発者プロフィール Trade Command Center — プロフェッショナル発注管理&リアルタイム・リスクガードパネル Trade Command Center は、MetaTrader 5向けに設計された高性能なビジュアル発注・ロット計算・リスク管理アシスタントツールです。厳格な资金保護ルール、リアルタイムのドローダウン制限、精緻な手動取引管理を必要とするトレーダーのために構築されています。 チャート上の単一パネルに統合された5つの機能タブを通じて、外部DLLやネットワーク接続を一切使用することなく、プロレベルのリスク制限機能、自動ポジション管理、正確な発注プラン作成を提供します。 インターフェースとモジュール構成 各コントロールパネルは、操作性を向上させ、チャート画面を有効活用するために5つの専用タブに分かれています: タブ / モジュール 主な機能 画面操作・インジケーター TRADE ビジュアル発注計画、リスクベースのロット自動計算、UTC時間指
YuClusters
Yury Kulikov
4.93 (43)
Attention: You can view the program operation in the free version  YuClusters DEMO .  YuClusters is a professional market analysis system. The trader has unique opportunities to analyze the flow of orders, trade volumes, price movements using various charts, profiles, indicators, and graphical objects. YuClusters operates on data based on Time&Sales or ticks information, depending on what is available in the quotes of a financial instrument. YuClusters allows you to build graphs by combining da
Quant AI Agents are independent trading Expert Advisors. Instead of trading using a fixed strategy like other conventional EAs, Quant AI Agents   is a   multi-agent AI trading framework   that turns natural-language strategy prompts into live.  WANT THE SAME RESULTS AS MY LIVE SIGNAL?   Use the exact same brokers I do:   IC MARKETS , IC TRADING   .  Unlike the centralized stock market, Forex has no single, unified price feed.  Every broker sources liquidity from different providers, creating un
The product will copy all telegram signal to MT5 ( which you are member) , also it can work as remote copier.  Easy to set up, copy order instant, can work with almost signal formats, image signal,  s upport to translate other language to English Work with all type of channel or group, even channel have "Restrict Saving Content", work with  multi channel, multi MT5 Work as remote copier: with signal have ticket number, it will copy exactly via ticket number. Support to backtest signal. How to s
Trade Panel PRO MT5 Trade Panel PRO MT5 は MetaTrader 5 用の手動トレーディングパネルで、各ステップで視覚的にリスクをコントロールしながら、チャートから直接ポジションを準備、執行、管理するために設計されています。 このツールは、注文の準備、リスクに基づくポジションサイズの自動計算、インタラクティブな Entry、Stop Loss、Take Profit ゾーン、執行後の複数のトレード管理機能を単一のインターフェースに統合します。 バージョン 2.0 の新機能 バージョン 2.0 では、執行ワークフローを円滑にするためのいくつかの改善が導入されています: 自動方向反転: Take Profit または Stop Loss をエントリー価格を越えてドラッグすると、セットアップが反対方向に切り替わり、もう一方のレベルが自動的に再計算されます SL および TP レベルを履歴方向に延長する軽い点線で、過去の高値および安値に対するキャリブレーションを容易にします 方向に応じて色付けされた執行セル、計算されたロットが中央に表示されます トレーリ
Features   With MT5 to Interactive Brokers(IB) Trader, you can: 1. Load chart data from IB to MT5, and Analyze with all standard or customer Indicators. 2. Place Orders to IB Account Directly in MT5. 3. Make your Own EAs upon IB Securities by only making minus changes of the trading function. Usage 1) Installation Copy the "Mt5ToIBTraderEn.ex4" and sample files to [MT5 Data Folder]->MQL5->Experts.  2)  MT5 Settings Add the IP Address to the MT5 Allowed URLs in 'Tools->Options->Expert Adviso
作者のその他のプロダクト
Indicador Fimathe
Thiago Pereira Pinho
5 (5)
Fimathe Indicator The   Fimathe Indicator   is a tool for MetaTrader 5 designed to help traders identify support, resistance, neutral zones, and price channels. It features an interactive interface for drawing and managing support and resistance levels, generating take-profit channels and neutral zones, and providing visual and sound alerts for breakouts. Key Features Support and Resistance Lines: Dynamic and draggable lines to identify key levels. Reference Channel: Creates a channel between su
FREE
Kairi Ritsu KRI MT5
Thiago Pereira Pinho
5 (1)
The Kairi Ritsu (KRI) is a technical momentum oscillator primarily used to identify overextended market conditions. It measures the percentage deviation of the current price from its Moving Average. Here is a guide on how to interpret and trade using this indicator: 1. Core Logic: Mean Reversion The fundamental principle of the KRI is that prices eventually return to their average. When the KRI is at a high positive value , the price is "stretched" too far above the average (Overbought). When th
FREE
The MarketProfileTPO indicator for MetaTrader 5 is a powerful tool designed to bring the Market Profile concept, based on Time Price Opportunity (TPO) analysis , directly onto your main chart window. This indicator calculates and displays the price distribution over a specified period, highlighting key areas of market activity and concentration. It is particularly optimized for high-volatility instruments like NAS100, US30, and XAUUSD when used on the M1 (1-minute) timeframe, offering a detailed
FREE
プライス・コンパス は、金融市場における トレンドナビゲーションシステム として機能するように設計された、強力なテクニカル分析ツールです。 本インジケーターは、市場の 平均的な方向性圧力 を評価し、短期的なノイズを効果的にフィルタリングして、支配的な動きを明確に識別します。現在の価格がその「中央平均」からどれだけ乖離しているかを定量化し、市場の 方向性 (強気、弱気、または中立)の正確なシグナルを提供します。 解釈 (コンパスの三つの状態) (Interpretação - Os Três Estados do Compass) このインジケーターは、 ゼロライン を中心に据えた別のサブウィンドウに描画され、現在の市場状態を示すために3つの異なる色を使用します: コンパスの状態 (Estado do Compass) 位置 (Localização) シグナル (Sinalização) 解釈 (Interpretação) 北 (強気) ゼロラインの上 ポジティブ (Positive) 市場が 強い買い圧力 下にあることを示します。 上昇トレンド の開始または継続を示唆します。 南
FREE
Follow Line
Thiago Pereira Pinho
4 (1)
The Follow Line Indicator is an essential technical analysis tool that provides a clear, immediate visualization of the trend while detecting high-probability reversals in real-time. By combining adaptive price tracking with clear visual alerts, it transforms complex data into actionable trading signals. Key Features Dynamic Trend Line: Tracks the market's prevailing direction, automatically adjusting to each new price extreme. Clear Colors: The line turns Blue during uptrends and Red during dow
FREE
MQL5に投稿する用の、短く実用的な日本語版の説明です: Dynamic Market Profile (DMP) — カスタム・ボリュームプロファイル Dynamic Market Profile は、チャート上の任意の場所の出来高(ボリューム)を、手動かつ瞬時に分析できるインジケーターです。日足や週足といった固定のプロファイルに縛られる必要はありません。分析したい特定の値動き、レンジ(保ち合い)、トレンドの波をピンポイントで自由に選択できます。 インタラクティブな長方形(レクタングル)を使って、最大 5つの独立したエリアを同時に チャート上に描画できます。 普段のトレードでの使い方 エリアを作成: キーボードの 「1、2、3、4、5」 のいずれかを押すか(または画面上のボタンをクリック)、長方形をチャートに表示させます。 チャート上で調整: 長方形の端をドラッグして、分析したい正確な「期間」と「価格帯」を囲みます。 瞬時に分析: インジケーターがそのエリアのボリュームプロファイルを生配信のようにリアルタイムで計算・描画します。 特定のプロファイルを消したい場合は、その長方形を削
FREE
ダイナミックな CMF 計算: チャイキン・マネー・フロー (Chaikin Money Flow, CMF) の期間をカスタマイズすることで、分析を微調整し、シグナルの精度を最大限に高めます。  直感的な色分けアラート: 明確な視覚的合図により、市場の状況を即座に解釈できます。  緑色アラート: 買われすぎ ゾーンを示し、潜在的な売り機会を示唆します。  赤色アラート: 売られすぎ ゾーンを示し、潜在的な買い機会を示唆します。  灰色アラート: 中立 ゾーンを表し、確認されたトレンドまたは反転を待つべきシグナルです。  自動ダイバージェンス検出: 市場の隠れた転換点を容易に発見します。当社のシステムは、価格とモメンタム間の ダイバージェンスを自動的に検出 し、重要な反転を予測するのに役立ちます。  リアルボリューム統合: リアルボリュームオプション に切り替えることでシグナルの精度を高め、最も信頼性の高い市場データに基づいて取引を決定できるようにします。
FREE
ダイナミックな CMF 計算: チャイキン・マネー・フロー (Chaikin Money Flow, CMF) の期間をカスタマイズすることで、分析を微調整し、シグナルの精度を最大限に高めます。  直感的な色分けアラート: 明確な視覚的合図により、市場の状況を即座に解釈できます。  緑色アラート: 買われすぎ ゾーンを示し、潜在的な売り機会を示唆します。  赤色アラート: 売られすぎ ゾーンを示し、潜在的な買い機会を示唆します。  灰色アラート: 中立 ゾーンを表し、確認されたトレンドまたは反転を待つべきシグナルです。  自動ダイバージェンス検出: 市場の隠れた転換点を容易に発見します。当社のシステムは、価格とモメンタム間の ダイバージェンスを自動的に検出 し、重要な反転を予測するのに役立ちます。  リアルボリューム統合: リアルボリュームオプション に切り替えることでシグナルの精度を高め、最も信頼性の高い市場データに基づいて取引を決定できるようにします。
FREE
The   ADX  Histogram   is a modern and visual upgrade of the classic   Average Directional Index (ADX) . It transforms the standard ADX and DI+ / DI– values into a   color-coded histogram , making trend analysis much clearer and faster.  Key Features: Histogram with four states :  Blue = Normal Buy Trend Green = Strong Buy Trend  Orange = Normal Sell Trend  Red = Strong Sell Trend Automatic strength detection : uses the ADX line to separate “normal” vs. “strong” signals.  Fully customizable: ADX
FREE
Anchored VWAP + 3 SD Bands. This tool combines the market's most respected volume indicator (VWAP) with statistical volatility (Standard Deviation), creating a complete map of price action. Unlike simple moving averages, VWAP weights the price based on actual traded volume, offering much more reliable support and resistance levels. With the three standard deviation bands included, you can easily visualize statistically proven overbought and oversold zones. Key Features: Daily VWAP (Auto-Reset
FREE
The Keltner Channel Pro is a modern and enhanced version of the classic Keltner Channel , designed for traders who want to identify trends, reversals, and overbought/oversold zones with greater accuracy.  Built with EMA (Exponential Moving Average) and ATR (Average True Range) , this indicator automatically adapts to market volatility, providing dynamic channels that help filter noise and improve trade timing.  Key Features: Main channel (upper, middle, and lower) based on EMA + ATR. Optional ad
FREE
The   MarketProfileTPO   indicator for MetaTrader 5 is a powerful tool designed to bring the   Market Profile concept, based on Time Price Opportunity (TPO) analysis , directly onto your main chart window. This indicator calculates and displays the price distribution over a specified period, highlighting key areas of market activity and concentration. It is particularly optimized for   high-volatility instruments   like   NAS100, US30, and XAUUSD   when used on the M1 (1-minute) timeframe, offer
FREE
The Kairi Ritsu (KRI) is a technical momentum oscillator primarily used to identify overextended market conditions. It measures the percentage deviation of the current price from its Moving Average. Here is a guide on how to interpret and trade using this indicator: 1. Core Logic: Mean Reversion The fundamental principle of the KRI is that prices eventually return to their average. When the KRI is at a high positive value , the price is "stretched" too far above the average (Overbought). When th
FREE
Stop chasing the market. The Follow Line Indicator provides clear, high-probability signals right on your chart. This advanced tool features a Dynamic Trend Line that instantly adapts to market structure. It’s your immediate visual reference: Blue means you're in an uptrend, and Red signals a downtrend. The core function tracks price extremes and volatility to define the true trend strength. The best part is the automatic signal generation: Buy Arrow: Appears when the trend line flips from Red t
FREE
The   Real Flow Defense Levels   indicator is a proprietary tool designed to identify and plot   significant, high-conviction price zones   directly onto your main trading chart. It uses a dynamic, volume-based analysis to determine where the market has previously demonstrated the   strongest defense or concentration of activity . These plotted lines serve as   dynamic support and resistance levels , highlighting the prices where major participants are most likely to enter or defend their positi
FREE
A powerful and intuitive trade management tool designed for scalpers and intraday traders. Created to complement the Nampim Samba Scalper strategy , it allows traders to open, manage, and close positions quickly without leaving the chart.  Key Features: Customizable trading panel – choose position (left, right, center, top, bottom). One-click trading buttons – instantly open Buy/Sell trades with pre-set lot sizes. Close management – close last 1/2/3 trades or all Buy/Sell positions with one clic
FREE
The   Real Flow Defense Levels   indicator is a proprietary tool designed to identify and plot   significant, high-conviction price zones   directly onto your main trading chart. It uses a dynamic, volume-based analysis to determine where the market has previously demonstrated the   strongest defense or concentration of activity . These plotted lines serve as   dynamic support and resistance levels , highlighting the prices where major participants are most likely to enter or defend their positi
FREE
Volume Force MT4
Thiago Pereira Pinho
5 (1)
V-FORCE PRO - MetaTrader 5 用 高度な出来高インジケーター V-Force Proで実勢出来高の力を発見せよ - 市場分析の革命! 暗闇での取引はもうやめよう!大口投資家の力をリアルタイムで可視化 全てのトレーダーが直面する問題: 全てのテクニカル指標が同じ方向を示しているのに、なぜ市場の動きが失敗することがあるのか疑問に思ったことはありませんか?その答えは   実勢出来高   にあります - 大多数のトレーダーが見落としているパズルの最も重要なピースです! V-Force Pro 5.3 - Speed Edition のご紹介 単純なヒストグラムを超え、各値動きの背後にある   真の強度   を明らかにする、唯一無二の出来高インジケーター! 独占的特長: 1. マルチレベル支配力分析 強気・強勢(濃い青):   強い確信をもった買い勢力の支配的な出来高 強気・弱勢(薄い青):   買い圧力はあるが、躊躇いが見られる 弱気・強勢(濃い赤):   攻撃的な売り勢力の出来高 弱気・弱勢(薄い赤):   弱い売り圧力 吸収/中立(灰色):   強気派と弱気派
Volume Compair
Thiago Pereira Pinho
5 (1)
プロフェッショナルな累積デルタ&ボリューム中央値インジケーター この強力なボリューム分析ツールを使用して、 実際の売買圧力 を追跡します。 ボリューム比較インジケーター (Volume Compare Indicator) は、 累積デルタ (Cumulative Delta) と ボリューム中央値 (Volume Medians) を組み合わせて、 機関投資家の活動、 不均衡、 および潜在的な反転を特定するのに役立ちます。  主な特徴:  累積デルタヒストグラム – リアルタイムで純粋な買いボリュームと売りボリュームを視覚化します。  売買ボリューム中央値 – 平均的な買いボリュームと売りボリュームのレベルを示す水平線。  スマートなボリューム分類 – 以下を区別します: 強い買い(緑) – 強気(ブル)の圧力。 強い売り(赤) – 弱気(ベア)の圧力。 買いボリューム中央値(青線) – 標準的な買いボリュームの基準。 売りボリューム中央値(オレンジ線) – 標準的な売りボリュームの基準。  カスタマイズ可能なパラメーター – 感度に合わせて CDIPeriod と CDIRang
プロフェッショナルな累積デルタ&ボリューム中央値インジケータ この強力なボリューム分析ツールを使用して、 実際の売買圧力 を追跡します。 ボリューム比較インジケーター (Volume Compare Indicator) は、 累積デルタ (Cumulative Delta) と ボリューム中央値 (Volume Medians) を組み合わせて、 機関投資家の活動、 不均衡、 および潜在的な反転を特定するのに役立ちます。  主な特徴: 累積デルタヒストグラム – リアルタイムで純粋な買いボリュームと売りボリュームを視覚化します。  売買ボリューム中央値 – 平均的な買いボリュームと売りボリュームのレベルを示す水平線。  スマートなボリューム分類 – 以下を区別します: 強い買い(緑) – 強気(ブル)の圧力。 強い売り(赤) – 弱気(ベア)の圧力。 買いボリューム中央値(青線) – 標準的な買いボリュームの基準。 売りボリューム中央値(オレンジ線) – 標準的な売りボリュームの基準。  カスタマイズ可能なパラメーター – 感度に合わせて CDIPeriod と CDIRang
V-FORCE PRO - MetaTrader 5 用 高度な出来高インジケーター V-Force Proで実勢出来高の力を発見せよ - 市場分析の革命! 暗闇での取引はもうやめよう!大口投資家の力をリアルタイムで可視化 全てのトレーダーが直面する問題: 全てのテクニカル指標が同じ方向を示しているのに、なぜ市場の動きが失敗することがあるのか疑問に思ったことはありませんか?その答えは   実勢出来高   にあります - 大多数のトレーダーが見落としているパズルの最も重要なピースです! V-Force Pro 5.3 - Speed Edition のご紹介 単純なヒストグラムを超え、各値動きの背後にある   真の強度   を明らかにする、唯一無二の出来高インジケーター! 独占的特長: 1. マルチレベル支配力分析 強気・強勢(濃い青):   強い確信をもった買い勢力の支配的な出来高 強気・弱勢(薄い青):   買い圧力はあるが、躊躇いが見られる 弱気・強勢(濃い赤):   攻撃的な売り勢力の出来高 弱気・弱勢(薄い赤):   弱い売り圧力 吸収/中立(灰色):   強気派と弱気派
Sync
Thiago Pereira Pinho
5 (1)
**Sync MT5 – リアルタイムマルチチャート分析マネージャー** MT5プラットフォームをプロフェッショナルな分析ステーションに変革します。Syncは、複数のウィンドウ間でチャート、オブジェクト、クロスヘアを同期する包括的なツールであり、これまでにない精度と効率で取引できるようになります。 **主な機能** 1. **スマートチャート同期**    - 複数のチャート間でシンボルと時間枠をワンクリックで同期。    - グループシステム – 戦略や資産ごとにチャートを整理。    - 不必要な更新を防ぐ調整可能な感度。 2. **高度なクロスヘア(デュアル軸)**    - グループ内のすべてのチャートで同期されたクロスヘア。    - ローカル時間またはサーバー時間での表示。    - 各チャートでクロスヘアポイントへの自動ナビゲーション。    - ESCキーによる迅速な有効化/無効化。 3. **完全なオブジェクト管理**    - チャート間でのライン、四角形、テキスト、矢印の自動同期。    - スクロールと検索機能付き管理パネル。    - 作成された最
フィルタ:
Marcio Goncalves Martins
144
Marcio Goncalves Martins 2026.02.12 19:08 
 

Ola Thiago, coloquei tudo certinho, mas nao fez nada. Vc tem Telegram, tambem podemos conversar por la

Thiago Pereira Pinho
4673
開発者からの返信 Thiago Pereira Pinho 2026.02.13 14:31
mandei meu numero na DM
CristianoMuglio
14
CristianoMuglio 2025.10.19 17:01 
 

ユーザーは評価に対して何もコメントを残しませんでした

Thiago Pereira Pinho
4673
開発者からの返信 Thiago Pereira Pinho 2026.02.02 00:08
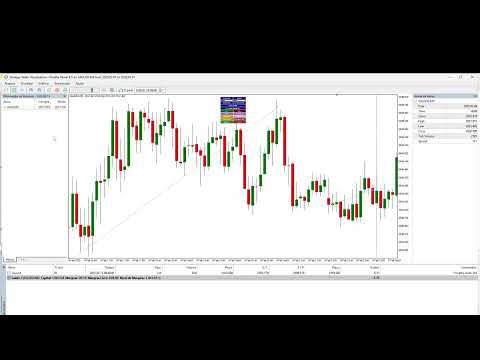
Opa, tudo bem Cristiano? Segue link do video explicando https://www.youtube.com/watch?v=tdBNqsC9bDM
レビューに返信