Volume Force MT5
- インディケータ
- バージョン: 6.44
- アップデート済み: 1 4月 2026
- アクティベーション: 20
V-FORCE PRO - MetaTrader 5 用 高度な出来高インジケーター
V-Force Proで実勢出来高の力を発見せよ - 市場分析の革命!
暗闇での取引はもうやめよう!大口投資家の力をリアルタイムで可視化
全てのトレーダーが直面する問題:
全てのテクニカル指標が同じ方向を示しているのに、なぜ市場の動きが失敗することがあるのか疑問に思ったことはありませんか?その答えは 実勢出来高 にあります - 大多数のトレーダーが見落としているパズルの最も重要なピースです!
V-Force Pro 5.3 - Speed Edition のご紹介
単純なヒストグラムを超え、各値動きの背後にある 真の強度 を明らかにする、唯一無二の出来高インジケーター!
独占的特長:
1. マルチレベル支配力分析
-
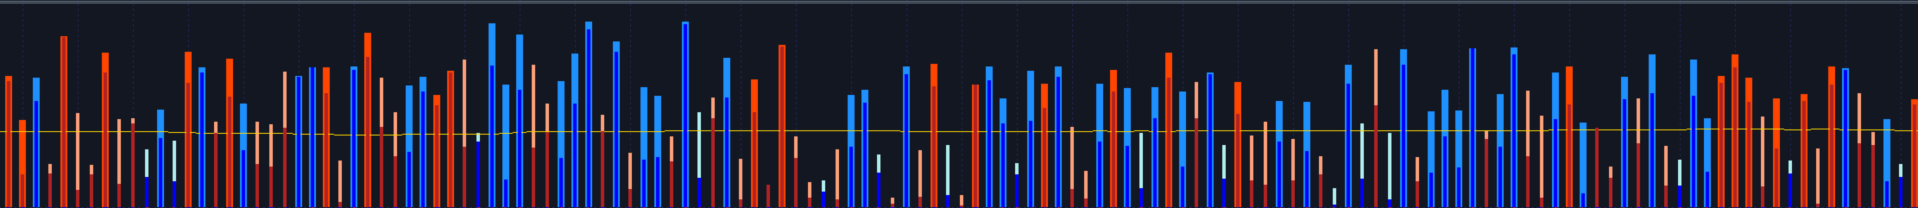
強気・強勢(濃い青): 強い確信をもった買い勢力の支配的な出来高
-
強気・弱勢(薄い青): 買い圧力はあるが、躊躇いが見られる
-
弱気・強勢(濃い赤): 攻撃的な売り勢力の出来高
-
弱気・弱勢(薄い赤): 弱い売り圧力
-
吸収/中立(灰色): 強気派と弱気派の対立 - 反転警戒アラート!
2. スピード検出システム(Speed Edition)
-
リアルタイムでの 出来高加速 の検出
-
大口投資家の 積極的なエントリー 瞬間の識別
-
実勢出来高のない「空っぽの」値動きをフィルタリング
3. カスタマイズ可能なインテリジェントアラート
-
ご希望の通知方法をお選びください:
-
音声+ポップアップ: あらゆる機会を逃さない
-
音声のみ: 複数チャートを扱うトレーダー向け
-
ポップアップのみ: 静かな環境向け
-
無効: 純粋な視覚分析用
-
4. ダイナミック出来高中央値
-
過去X期間の平均出来高を示すライン
-
出来高が中央値を200%上回ると自動アラート(調整可能)
-
ノイズを除去し、重要な動きを強調
5. プロフェッショナルフェードアウトシステム
-
強い値動きの後も出来高強度の「記憶」を保持
-
保ち合い(レンジ)中の誤ったシグナルを回避
-
買い圧力/売り圧力の持続性を明らかにする
V-FORCE PROがあなたのトレードを変える方法:
デイトレーダーの方へ:
-
出来高で 確認された ブレイクアウトへの精密なエントリー
-
「偽のブレイクアウト」を回避 - 出来高は嘘をつかない!
-
出来高プロファイルの変化による値動きの枯渇の識別
スウィングトレーダーの方へ:
-
出来高の段階的な増加によるトレンドの確認
-
トレンド強度変化の早期検出
-
大規模な仕掛け(ディストリビューション)/仕込み(アキュムレーション)の識別
スキャルパーの方へ:
-
最適化された執行速度
-
急激な値動きに対する音声アラート
-
低い時間軸でも明確な視覚化
完全なカスタマイズ:
色、太さ、アラートレベル、感度など、すべてをあなたのスタイルに合わせて調整可能。
従来型インジケーターとの比較:
| 特徴 | 通常の出来高 | VWAP | V-Force Pro |
|---|---|---|---|
| 相対的強度 | 無 | 部分的 | 有 |
| カスタマイズ可能なアラート | 無 | 無 | 有 |
| スピード検出 | 無 | 無 | 有 |
| フェードアウトシステム | 無 | 無 | 有 |
| マルチレベル分析 | 無 | 無 | 有 |
実践的使用例:
シナリオ1: 抵抗線のブレイク
-
通常の出来高: 増加は示すが、強度 は示さない
-
V-Force Pro: 「強気・強勢」(有効なブレイク)か「強気・弱勢」(失敗の可能性)かを明らかにする
シナリオ2: 支持線のテスト
-
通常の出来高: テスト時は出来高が高い
-
V-Force Pro: 「弱気・強勢」(ブレイクの可能性大)か「吸収」(差し迫った反転)かを示す
シナリオ3: トレンドの加速
-
通常の出来高: 出来高が増加
-
V-Force Pro: 「強気/弱気 スピード」を活性化 - 大口投資家のエントリーが確認された!
プロのアドバイス:
V-Force Proを以下のものと組み合わせて使用:
-
支持線/抵抗線: これらのレベルでの強い出来高 = 高い確率
-
移動平均線: クロスを確認する出来高 = より信頼性の高いセットアップ
-
ローソク足パターン: パターンを検証する出来高 = 質の高いエントリー