Volume Compair Indicator
- インディケータ
- バージョン: 1.2
- アクティベーション: 20
プロフェッショナルな累積デルタ&ボリューム中央値インジケータ
この強力なボリューム分析ツールを使用して、実際の売買圧力を追跡します。ボリューム比較インジケーター (Volume Compare Indicator) は、累積デルタ (Cumulative Delta) とボリューム中央値 (Volume Medians) を組み合わせて、機関投資家の活動、不均衡、および潜在的な反転を特定するのに役立ちます。
主な特徴:
-
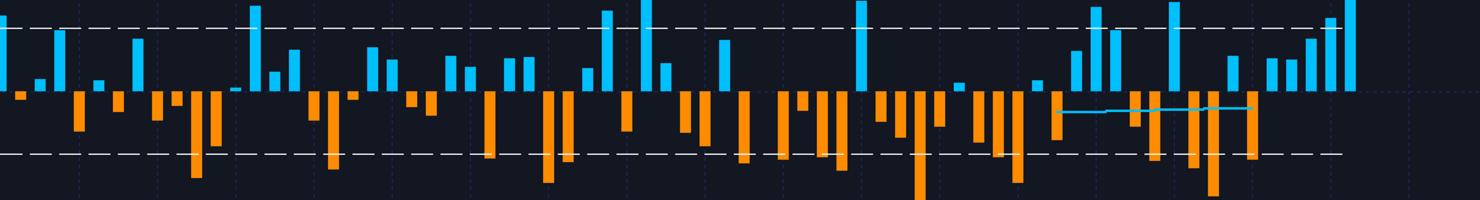
累積デルタヒストグラム – リアルタイムで純粋な買いボリュームと売りボリュームを視覚化します。
-
売買ボリューム中央値 – 平均的な買いボリュームと売りボリュームのレベルを示す水平線。
-
スマートなボリューム分類 – 以下を区別します:
-
強い買い(緑) – 強気(ブル)の圧力。
-
強い売り(赤) – 弱気(ベア)の圧力。
-
買いボリューム中央値(青線) – 標準的な買いボリュームの基準。
-
売りボリューム中央値(オレンジ線) – 標準的な売りボリュームの基準。
-
-
カスタマイズ可能なパラメーター – 感度に合わせて CDIPeriod と CDIRange を調整します。
-
EMA平滑化ボリューム – ノイズを減らし、よりクリーンなシグナルを提供します。
トレーダーへの貢献:
-
機関投資家の活動を把握 – 異常なボリュームの急増は、大口プレーヤーの参入を示します。
-
ブレイクアウト/反転の確認 – 強いデルタのダイバージェンスは、偽の動きを警告します。
-
ボリュームベースのサポート/レジスタンス – 中央線は動的な参照レベルとして機能します。
-
デイトレードとスキャルピング – 日中のモメンタムの変化を測定します。
インジケーターのロジック:
-
緑色のバー = 純粋な買いボリューム(強気圧力)。
-
赤色のバー = 純粋な売りボリューム(弱気圧力)。
-
青線 = 買いボリューム中央値(典型的な買いの強さ)。
-
オレンジ線 = 売りボリューム中央値(典型的な売りの強さ)。