CMF Scalping
- インディケータ
- バージョン: 1.0
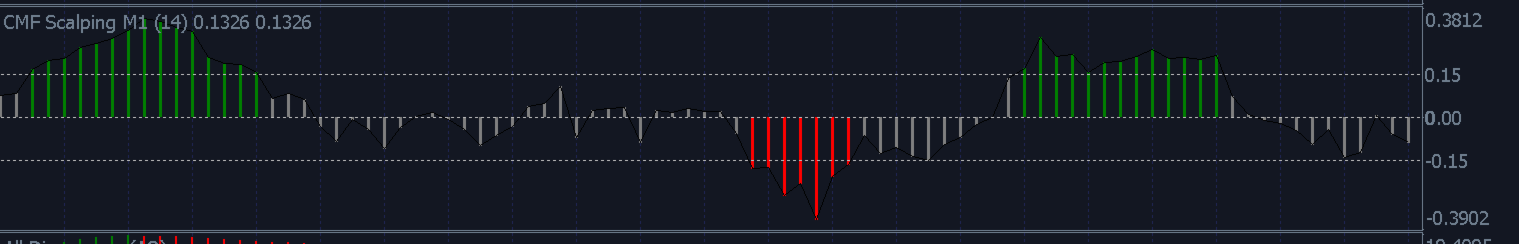
ダイナミックな CMF 計算: チャイキン・マネー・フロー (Chaikin Money Flow, CMF) の期間をカスタマイズすることで、分析を微調整し、シグナルの精度を最大限に高めます。
直感的な色分けアラート: 明確な視覚的合図により、市場の状況を即座に解釈できます。
-
緑色アラート: 買われすぎゾーンを示し、潜在的な売り機会を示唆します。
-
赤色アラート: 売られすぎゾーンを示し、潜在的な買い機会を示唆します。
-
灰色アラート: 中立ゾーンを表し、確認されたトレンドまたは反転を待つべきシグナルです。
自動ダイバージェンス検出: 市場の隠れた転換点を容易に発見します。当社のシステムは、価格とモメンタム間のダイバージェンスを自動的に検出し、重要な反転を予測するのに役立ちます。
リアルボリューム統合: リアルボリュームオプションに切り替えることでシグナルの精度を高め、最も信頼性の高い市場データに基づいて取引を決定できるようにします。