Projected Moving Average MT5
- インディケータ
- バージョン: 1.0
- アクティベーション: 5

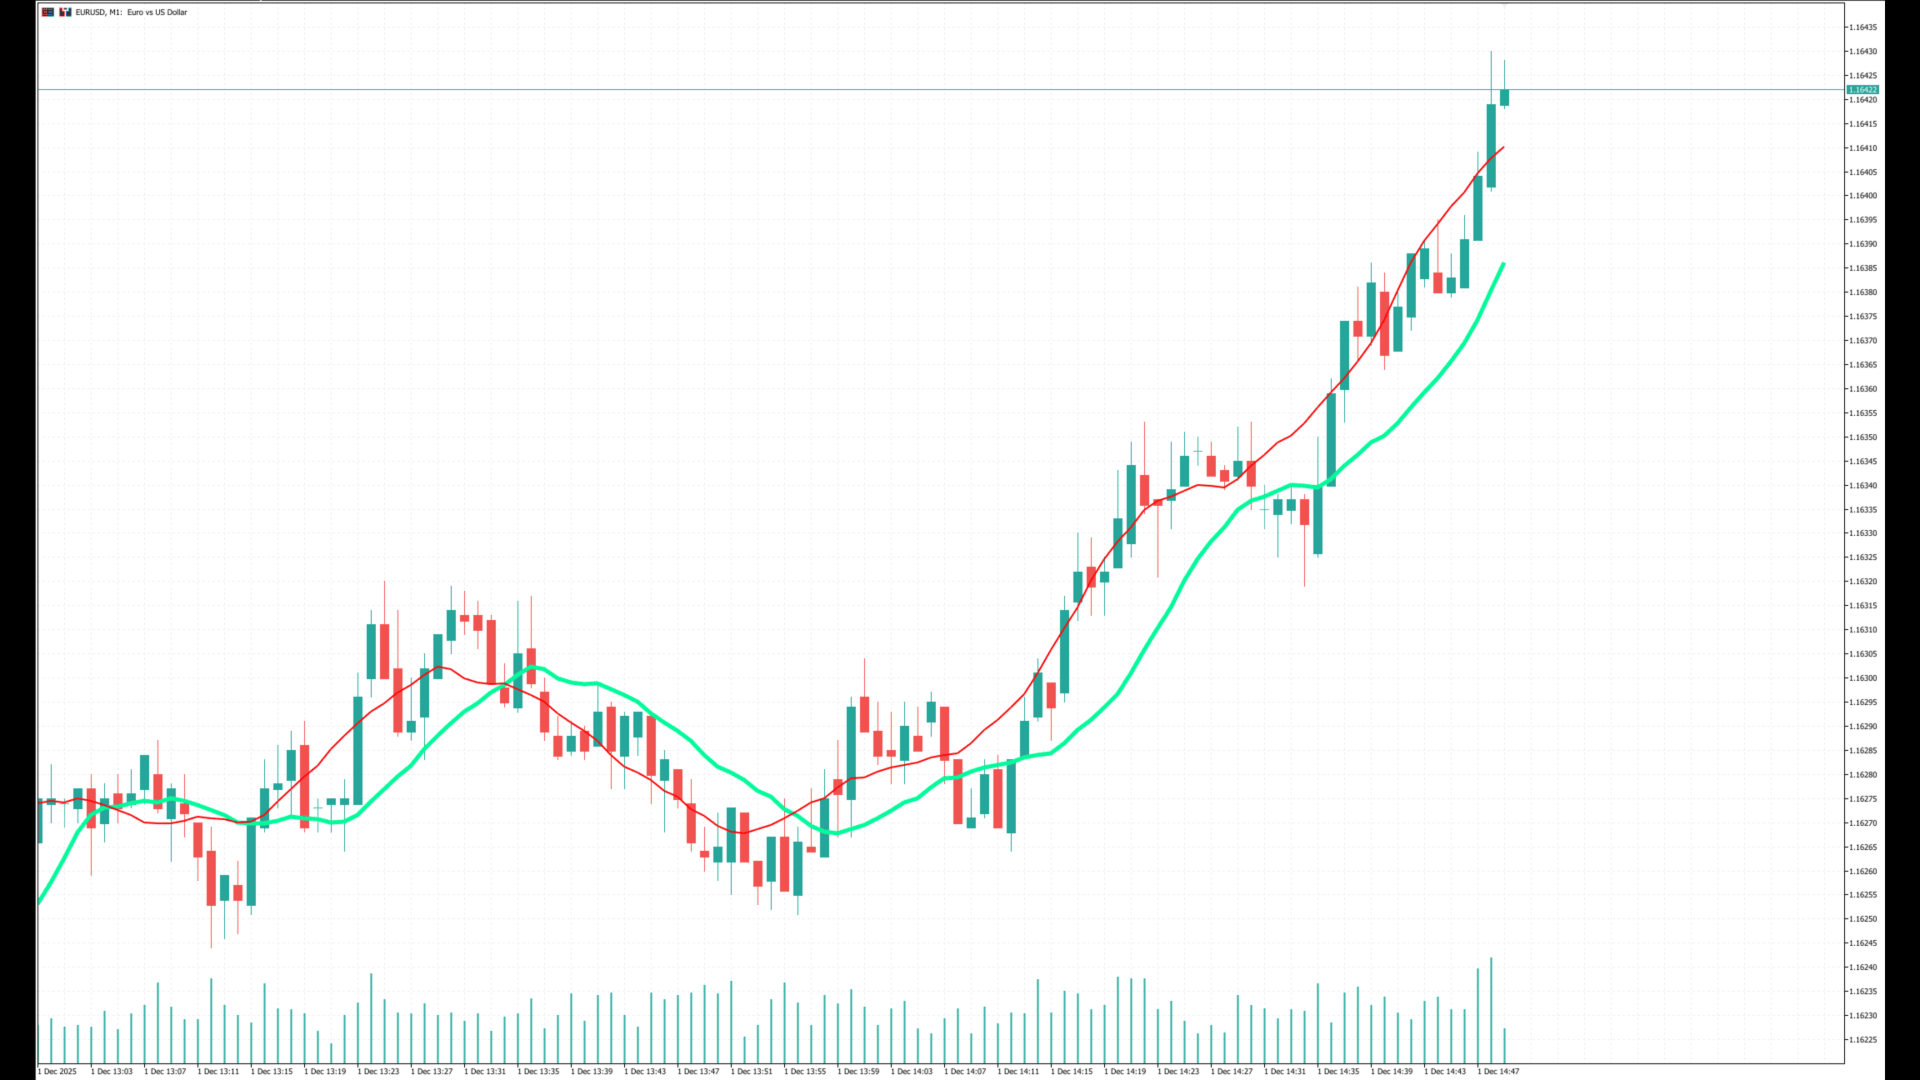
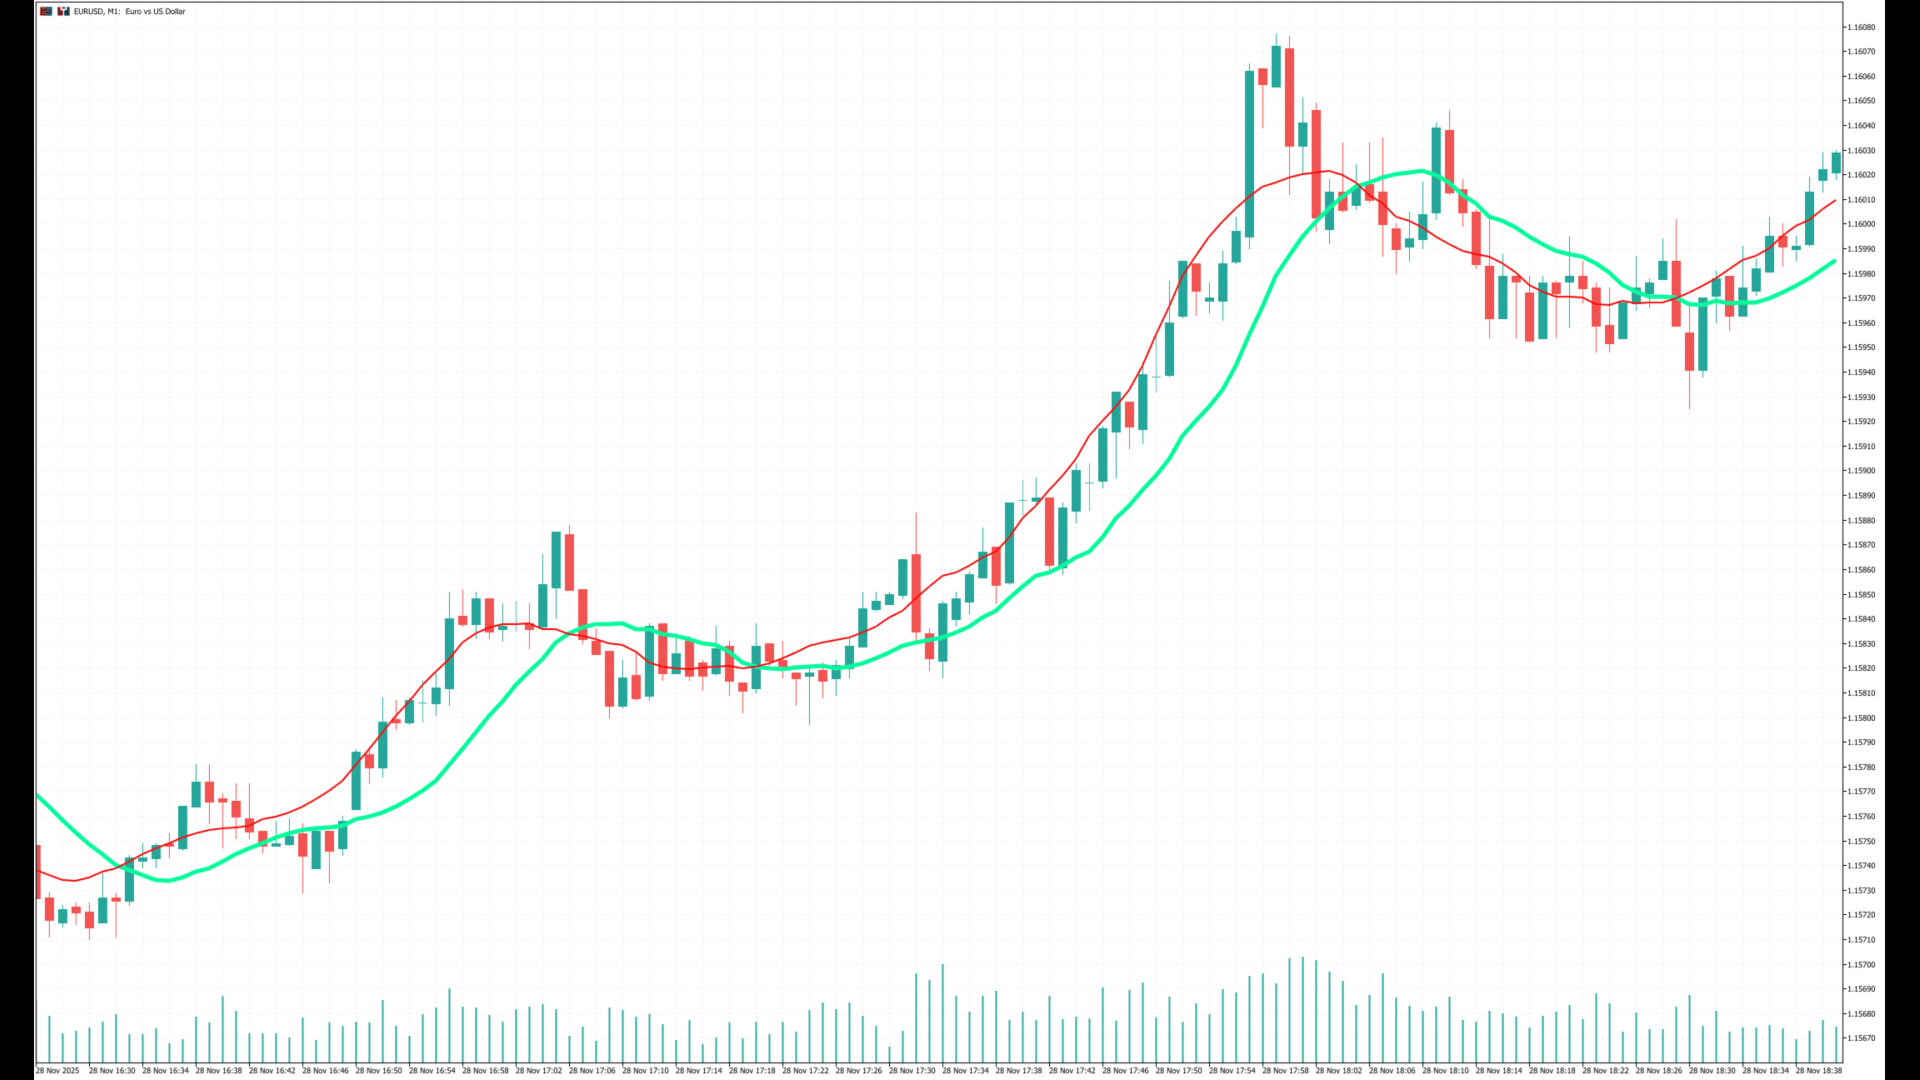
A clean and practical moving-average tool designed for traders who want a clearer view of short-term and medium-term trend direction.
The Projected Moving Average shifts a standard SMA forward by half of its period, creating a smooth projection zone that updates dynamically with each new candle.
This makes it easier to visually anticipate where the moving average is heading without repainting past values.
Key Features
-
Forward-shifted SMA (Length/2) for clearer trend projection
-
Real-time updating forecast area
-
Minimal lag compared to classic SMA
-
Simple, clean, and easy to interpret
-
Works on all symbols and timeframes
-
Lightweight, optimized, and fast
How It Works
The indicator calculates a standard Simple Moving Average but displays it ahead of price, creating a “future” segment equal to half the input period.
This projected part updates every candle and helps traders visually estimate upcoming trend direction, slope, and potential turning points.
Use Cases
-
Trend confirmation
-
Visual projection of moving-average direction
-
Identifying early trend slowdowns
-
Enhancing discretionary trading systems
No signals. No arrows. No trading rules.
Just a clean, forward-shifted SMA for traders who prefer clarity over complexity.