YouTubeにあるマーケットチュートリアルビデオをご覧ください
ロボットや指標を購入する
仮想ホスティングで
EAを実行
EAを実行
ロボットや指標を購入前にテストする
マーケットで収入を得る
販売のためにプロダクトをプレゼンテーションする方法
MetaTrader 5のためのエキスパートアドバイザーとインディケータ - 158
バンクス・セッションライン・インジケーター バンクス・セッションラインは、価格変動の時間帯を自動的にハイライト表示します。 スマートマネートレーダーは、アジア、ロンドン、ニューヨークなど、銀行が取引する主要な機関投資家向け取引セッションを明確にマークし、追跡することができます。チャートに表示できるセッションラインは完全にカスタマイズ可能です。
ボラティリティサイクルの追跡において明確さと正確性を求めるトレーダーのために設計されています。
バンクス・セッションラインのメリット
すべての主要な値動きは、機関投資家向け銀行の取引セッション時間内に始まり、終わります。 このツールは、銀行が取引する取引セッションを視覚的に明確に表示するため、市場が変動する可能性が高い時間帯にのみ取引を行い、市場が変動しない可能性が高い時間帯には取引を避けることができます。 トレーダーは、銀行が価格を構築、捕捉、そして解放する時間帯に流動性が変動した場合にのみ、銀行と取引を行うことができます。 セッションベースのフェイクアウト、流動性スイープ、そして機関投資家の足跡を特定するのに最適です。
機能
チャ

Forex Falcon: Innovative Multi-Currency Forex Trading Bot Introduction In today’s fast-paced trading environment, your results depend on the quality of the tools you use. Forex Falcon is not just a trading bot—it’s a high-tech solution designed to enhance your efficiency in the Forex market. This multi-currency bot combines a wide range of features, enabling traders of all levels to navigate complex market conditions with confidence. Why Choose Forex Falcon Selecting the right trading bot requir
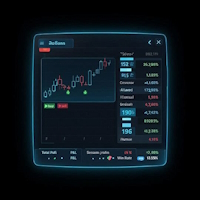
Currency Curator: A Modern Multi-Currency Forex Trading Bot Introduction Currency Curator is an innovative multi-currency trading bot specifically designed to automate and enhance your Forex trading experience. By leveraging cutting-edge algorithms, this expert advisor performs in-depth analysis of market conditions and executes trades with high efficiency. Its primary goal is to equip users with reliable tools for successful trading while minimizing risks and optimizing time management. Flexi

Intelligent Session Trading System A professional algorithmic trading solution designed for the London session opening, combining classical breakout methodology with modern adaptive risk management. What It Does: Identifies and executes high-probability directional moves during the London market open using multi-timeframe confirmation and volatility-based positioning. Smart Exit Management: Unlike traditional fixed take-profit systems, this EA employs dynamic trailing stops that adapt to market
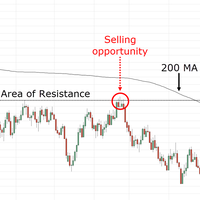
Gold MA200 Optimized Strategy is a fully automated Expert Advisor (EA) specifically designed for trading the XAUUSD pair on the 15-minute timeframe (M15) . The strategy utilizes the 200-period Moving Average (MA200) as the primary trend filter, enhanced by the combination of William %R , Bullish Power , and Bearish Power indicators for precise trade entry execution.
Parameters & Backtest Performance: Instrument: XAUUSD Timeframe: M15 Lot & Balance: 0.01 lot for 1000 US

Insight Investor: Advanced Multi-Currency Forex Trading Bot Introduction In the fast-paced world of Forex trading, having the right tools can significantly enhance your trading experience. Insight Investor is an advanced multi-currency trading bot designed to automate and optimize your trading operations. This expert advisor employs modern algorithms to analyze market conditions and execute trades, aiming to deliver consistent results while maintaining controlled risk levels. Key Features of Ins

SafeSeries Manager is a professional multi-currency trading robot for MetaTrader 5, designed for adaptive trading in volatile market conditions. Its core strengths are intelligent order series management, advanced risk control tools, and a flexible entry signal system. SafeSeries Manager aims for consistent profits while minimizing drawdowns and maintaining control over trading activity. Recommended minimum deposit: 10,000 units of the base currency. Key Features Intelligent Series Management —

Alpha Trades — Adaptive Professional Trading System
Author: Andrii Sydoruk
Version: 1.0
Release Date: 31.10.2025
Support: andriisydoruk@gmail.com Description
Alpha Trades is a next-generation universal trading expert, designed for stable and controlled operation under any market conditions.
The system uses an adaptive analytical approach that automatically adjusts to the current market structure while maintaining a high level of accuracy and safety. The algorithm is built as a multi-layer

Hidden Trend Channel Project 17 Tool
SPECIAL NOVEMBER SALE is now finished. Price goes back to normal.
This is an Automated Tool for Multi Timeframe Trend Channel Analysis Visualization with Intelligent Range Market, Trending Market, Reversal, Breakout Detection. It draws multiple Trend Channels with multiple sub-trendlines levels inside the channel for perfectly give you the trader, the crystal clear Trend channels where price trend direction is moving.
This tool is accurately useful for T

FJUNIVERSE | MT5 ボラティリティ&最小ロットスナップショットツール ワンクリックで強力なスキャナーが、マーケットウォッチ内の全銘柄の実リスクとボラティリティを即座に明らかにします — 現在のチャート時間枠を使用。 このスクリプトは、ブローカー定義の最小ロットでのUSDリスク額を正確に計算し、読み込まれた全ローソク足に基づく完全なボラティリティプロファイルを生成します。結果はクリーンなCSVファイルに保存され、MetaTraderジャーナルにバー数付きで出力されます。 主な機能: MINPRICEを計算:価格が0まで下落した場合のリスク( 最小ロット × Ask × 契約サイズ ) SNAPを表示:現在のAsk価格(完全な桁数) MINLOTを表示:ブローカーが許可する最小取引ロット すべての利用可能なバーでボラティリティを%で計算(常に正の値): AVGD 平均日次レンジ % ( |H-L|/O ) AVGL 平均上昇幅 % ( |H-O|/O ) AVGS 平均下落幅 % ( |L-O|/O ) MINL 最小非ゼロ上昇幅 %(フラットキャンドル除外) MINS 最小

Gold Smart Trend EA PRO 概要 Gold Smart Trend EA PRO は、通貨ペア XAUUSD(ゴールド) に特化して設計された自動売買システム(Expert Advisor)です。
本EAは、 SMA200 に基づくトレンドロジック、 RSIフィルター 、および ATRによるボラティリティ制御 を組み合わせ、主要なトレンド方向のモメンタムブレイクを検出し、動的なリスク管理を実現します。
最適化は不要で、チャートに適用するだけで動作します。 主な特徴 XAUUSD(ゴールド)専用設計 SMA200 、ローソク足構造、 RSI 、およびボラティリティ検証を組み合わせた多重フィルターエンジン ATRベースのストップロス と動的なリスク/リワード比の管理 自動 部分決済 および ブレークイーブン(損益分岐点調整) 機能 セッションフィルター :ロンドンおよびニューヨーク時間のみ、または全時間帯での取引が可能 トレードモード :買いのみ・売りのみ・両方向のいずれかを選択可能 戦略ロジック 本EAは SMA200 の上下方向に対するモメンタムブレイクを検出します

Gold Predict AI – Advanced Predictive Trading for XAUUSD (M15)
Gold Predict AI is a next‑generation Expert Advisor created specifically for trading Gold vs. US Dollar (XAUUSD) on the 15‑minute timeframe. Built with precision and designed for professional traders, this system leverages predictive modeling to anticipate market movements and capture opportunities with remarkable consistency. Unlike conventional robots that simply react to price action, Gold Predict AI is engineered to forecast di

Gold Ultimate Pro — Momentum EA for Gold (XAUUSD) Gold Ultimate Pro is an indicator‑based, momentum strategy built specifically for XAUUSD. Gold tends to trend impulsively; this EA aims to capture those momentum moves within a defined trading session with very low average holding time which can help avoid swap fees while keeping the setup simple and professional. Key features Momentum trading on Gold using internal indicators Clean, compact on‑chart dashboard No martingale, no grid, no averaging
RSIMFI100 Strain EA — Multi-Timeframe Momentum Logic for Precision Entries The RSIMFI100 Strain Expert Advisor is a high-discipline, momentum-driven trading system designed for MetaTrader 5. It combines the Relative Strength Index (RSI) and Money Flow Index (MFI) across three timeframes—H4, D1, and MN1—to identify high-probability reversal zones and execute trades with calculated risk. Core Strategy RSIMFI100 Strain uses a unique multi-timeframe confirmation logic: Buy Setup : Triggered w

CVD (Cumulative Volume Delta) for MT5 CVD (Cumulative Volume Delta) for MT5 Simple, fast CVD for volume and order flow trading. It tracks net buying vs selling pressure and plots CVD as candles. The Data Window also shows tick count per candle. What it does Accumulates volume delta from ticks or a chosen timeframe Optional reset: No Reset, Current Chart Period, or a specific timeframe Works on any symbol and timeframe How it’s calculated Tick-based: each incoming tick is labeled as buyer- or sel

Margin Level Monitor EA Stay ahead of margin calls with real-time alerts and visual feedback. This Expert Advisor is designed for traders who prioritize risk management. It continuously monitors your account’s margin level and triggers alerts when it drops below a customizable threshold (default: 200%). Whether you're trading manually or using other EAs, this tool keeps you informed and protected. Key Features: • Continuous Monitoring: Checks your margin level every few seconds. • Mult

Dynamic Pips: An Innovative Multi-Currency Bot for Automated Forex Trading Dynamic Pips is a high-tech tool for automated trading in the Forex market, designed for traders of all levels. This multi-currency robot, based on advanced algorithms for analyzing temporal information flows, offers unique opportunities to profit from currency fluctuations. Operating across any timeframe and with a variety of currency pairs, it becomes a reliable assistant in the trading world. Key Features and Advantage

Ksm: Smart Solution for Automated Forex Trading Ksm is a tool designed for automating Forex trading, using modern methods of time-series data analysis to work with multiple currency pairs across different timeframes. Key Features and Benefits Multi-currency support : Ksm enables trading across multiple currency pairs, helping traders adapt their strategies to various market conditions. New currency pairs can be easily added. Time-series data analysis : Utilizing advanced algorithms, Ksm analyzes
TuMz TrendSignal – Your Reliable Trading Compass in Volatile Markets Tired of noisy indicators that give false signals? Meet TuMz TrendSignal — a clean, non-repainting, ATR-based trend indicator built for serious MT5 traders. Using a smart combination of mid-price (HL/2) and adaptive ATR bands , TuMz TrendSignal dynamically draws: Green trend line during uptrends Red trend line during downtrends Dotted support/resistance zones that adjust to market volatility Clear buy/sell arrows at tr
Reach the apex of precision trading with ApexFusion Pro — a next-generation indicator that fuses RSI divergence , diagonal support & resistance trendlines , Order Blocks , and Fair Value Gaps (FVG) into one visual system. Built for professional traders, it reveals the hidden balance between momentum and liquidity , showing where institutions accumulate, where reversals form, and where the true market flow begins. Key Features: Detects RSI divergences (bullish & bearish) with visual signals Dr

RX Trend Follower — BTCUSD Trend-Following Expert Advisor
Check the comments section after purchase
RX Trend Follower is a professional Expert Advisor focused on BTCUSD . It follows market trends using multi-layer confirmations and executes trades only when momentum, volatility and filters align. No martingale, no grid, and every position is protected by Stop Loss and Take Profit from entry.
Core Concept The EA identifies directional bias, filters ranging phases, and times entries on breakou

Launch Offer: TrendMind is 199$ until November 15th.
After that, the full license will be $499 USD.
Get it now while it’s open — next week it becomes premium. Presets and Instruction TrendMind — The Gold Trader That Thinks Gold doesn’t follow rules. It breathes, it fakes, it explodes — and TrendMind AI was built to understand that. This is not a grid. This is not a martingale. This is not an over-optimized "perfect backtest curve". It’s an adaptive, semi-HFT decision engine that reads volatilit

Parameter Description MagicNumber Unique identifier for this Expert Advisor’s trades. GridSpacingPips Distance between each grid level in pips. LotMode Lot calculation method (Fixed size or based on account equity). FixedLotSize Lot size to use when LotMode = Fixed . EquityPerLot Equity required to open 0.01 lot when LotMode = Equity-based . MaxGridLevels Maximum number of grid levels above and below the initial price. MaxLossGridLevels Maximum number of losing grid levels before closing all po

Liberatus Machina EA — The Balance-Leverage Engine Turn Leverage into Balance — Convert Volatility into Controlled Accumulation. Concept Liberatus Machina EA is built on a groundbreaking concept — Balance-Adjusted Leverage .
Instead of chasing price direction, this system converts exposure into equilibrium.
By maintaining perfect buy/sell symmetry and closing only profitable legs, the EA creates realized balance growth while keeping equity completely flat . This transforms leverage into

Auto SL/TP Manager (自動SL/TPマネージャー) 手動トレードを二度と無防備な状態にしないでください! 急いでポジションを建てて、ストップロス (SL) やテイクプロフィット (TP) の設定を忘れたことはありませんか?「Auto SL/TP Manager」は、あなたにとって不可欠なセーフティネットです。 このエキスパートアドバイザー (EA) は、あなたのアカウントを24時間365日監視し、SL/TPが設定されていないオープンポジションに対して、あらかじめ定義されたリスク (SL) と利益 (TP) のレベルを自動的に適用します。 これは、 手動トレーダー 、 スキャルパー 、またはモバイルデバイスから開いたトレードであっても、 すべて のトレードが自分の戦略に従って確実に保護されるようにしたいすべての人にとって完璧なツールです。 主な特徴 完全自動化 : 未設定のオープンポジションを常時スキャンし、SL/TPを適用します。 高度な設定が可能 : ストップロスとテイクプロフィットをPips単位で簡単に定義できます (例: 5.0 = 50ポイント)。 強力なフィ

Murray Grid EA: Advanced Trading with Murray Math and Grid Strategy Murray Grid EA is a professional trading robot that combines the precision of Murray Math Levels with the power of a grid trading strategy. It is designed to identify key support and resistance levels and execute trades with high accuracy, while a built-in grid system helps to average positions and maximize profit potential during trending markets. Key Features: Murray Math Levels: Automatically calculates and draws all 13 cr

General Overview This Expert Advisor (EA) is a semi-automatic trading assistant for MetaTrader 5 that provides a graphical user interface (GUI) panel directly on the chart.
It allows traders to quickly place pending orders (Buy Limit, Sell Limit, Buy Stop, Sell Stop), set Stop Loss (SL) and Take Profit (TP) levels for all positions, close all open trades, and delete pending orders. Key Features Interactive Control Panel:
Displays input boxes, buttons, and labels on the chart.
You can manu

Stop guessing . Trade gold with a rules ‑based engine that adap ts to volatility , filters the trend , and locks profits automatically. Designed for X AUUSD (gold ). Built to be adaptive, disciplined , and practical . ATR ‑based risk (not fixed pips ) + partial take ‑profits and optional ATR trailing . Higher ‑time frame EMA filter keeps entries aligned with the dominant trend . New ‑bar confirmations to reduce noise ; spread , sess

Try it. Trust it. Test it. Then own it. ====BOLLINGER BANDS====== BB TIMEFRAME - 1 HOUR ===STANDARD TRADING=== ORDER TIME FRAME - 15 MINUTE === MINIMUM DEPOSIT === 200 $ === LEVERAGE === 1:500 === PAIR === EUR/USD GBP/USD USD/JPY Start with the Demo — Experience the Results First-Hand
First, run the demo and see the live performance yourself. If you notice consistent profits and strong results, then move forward with confidence and make your purchase.
Minimum starting capital: $200

FIRST, THIS EA IS A MULTIMARKET SCANNER AND ITS PERFORMANCE CAN ONLY EXAMINED USING VISUAL MODE (SET OPTIMIZATION TO DISABLED AND CHECK VISUAL MODE). THE EA LEVERAGE TAKE PROFITS FROM FLOATING POSITIONS IN DIFFERENT MARKETS, THIS ABILITY MAKES IT STANDOUT THIS EA IS FOR INDIVIDUALS HAVING ATLEAST $10000 IN THEIR ACCOUNT (EXPECT A DRAWDOWN OF ABOUT 10% IN WORST CASE SCENARIOS) THE EA IS GOOD FOR PROP FIRMS IF YOUR ACCOUNT IS ABOUT 1K, use this EA instead https://www.mql5.com/en/market/product/14
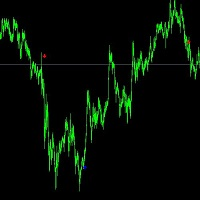
The 5-minute trend buying point reference for gold has an accuracy rate of 90%. All signals are not redrawn, Parameters need to be adjusted for different varieties and periods. The default value for gold trading is the 5-minute period. You can carefully study what direction guidance is suitable for you. We hope you can make money and it is worth referring to for professionals and novice traders. Stop loss is at the end of the line, real-time signal. Welcome to use it. If you have any question

Hello, traders! I am the Spread Convergence Expert, one of the standout members of the Convergence Family. What is my specialty? Crude oil. That's right—I trade the XBRUSD and XTIUSD commodity pairs with precision and confidence, reliably capturing arbitrage opportunities for you in the highly volatile crude oil market. The Convergence Expert has gradually proven to be a safe and stable intelligent trading system. ——————————————————————————————————————————————————————————————————————————————————

Questo Expert Advisor (EA) è stato progettato per offrire un'esperienza di trading automatizzata di alto livello, adatta sia ai trader principianti che a quelli esperti. Utilizzando algoritmi avanzati e tecniche di analisi del mercato, l'EA è in grado di identificare opportunità di trading redditizie con precisione e velocità. L'EA è configurabile per operare su vari strumenti finanziari, tra cui forex, indici e materie prime, garantendo una flessibilità senza pari.
Le caratteristiche princip

RC Trade Helperは、マニュアルトレーダー向けに設計された包括的なトレーディングアシスタントです。このアプリケーションは、チャート上で直接、迅速な注文実行、高度なリスク管理、効率的なトレード管理を行うための一連の視覚的ツールを提供します。 注意:購入前に、デモ口座でアプリケーションをテストできます。この商品はストラテジーテスターでは動作しません。 トレード操作 ワンクリックでトレードの実行と管理が可能: チャート上で視覚的なレベル確認により、成行注文と待機注文(ストップ、リミット)を発注。 すべてのポジションを決済、またはすべての待機注文を削除。 買いポジション、売りポジション、買い待機注文、売り待機注文の選択的な決済。 すべてのトレードライン(エントリー、ストップロス、テイクプロフィット)をチャート上のデフォルト位置にリセット。 チャートワークスペースを整理するため、すべてのトレードラインを非表示または表示。 トレードラインをロックして誤った移動を防止、またはトレード設定を反転。 ポジションサイジングとリスク管理 複数のトレードボリューム計算方法を提供: 固定ロットサイズ

Bollinger Keltner Advisor is an Expert Advisor that trades in the direction of the trend, using a template that compares price values, Bollinger Bands, and Keltner Channel lines. It confirms the absence of divergences for entry points with the MACD indicator and ensures the timing of volatility by comparing it to a specified point value for the distance between the upper and lower Bollinger Bands in the configuration. The advisor features a stop-loss mechanism based on the percentage change in p

Ratio X Stochastic Scalper — Advanced Stochastic Reversion EA for MT5 What it is Ratio X Stochastic Scalper is a disciplined scalping Expert Advisor for MetaTrader 5 which enters on Stochastic overbought/oversold reversals, optionally filtered by trend and volatility. It includes robust risk controls (fixed SL/TP, risk-based position sizing, trailing stop, break-even, daily loss and drawdown limits) and clean, MQL5-native notifications. Who it is for Traders who want a rule-based scalper with tr

İşte Japonca çevirisi: Early Reversal Detector - 反転が起こる前に捉える このインジケーターが行わないこと これは売買シグナルジェネレーターではありません。取引にいつ入るか、いつ出るかを自動的に教えてくれるものではありません。 このインジケーターが行うこと Early Reversal Detectorは価格動向の変化を識別し、最適なエントリーポイントを正確に特定します。 仕組み このインジケーターは、メインチャートの価格ローソク足に似たローソク足を別のパネルに作成しますが、重要な違いがあります: 通常のチャートローソク足 は、すべてのティックの動きで形成されます。 Early Reversal Detectorのローソク足 は、価格が指定した閾値の量だけジャンプした場合にのみ形成されます。 例えば: EURUSDで閾値を「5」に設定した場合、インジケーターは価格がティック間で0.00005以上動いた場合にのみティックを記録します。それより小さい動きは完全にフィルタリングされます。 なぜこれが重要なのか? ノイズをフィルタリングし、重要な

Intrade Sentinel BOS Assistant – スマート市場構造エンジン 精密な構造認識。自動化されたBOSロジック。 Intrade Sentinel BOS Assistant は MetaTrader 5 向けの強力なEAです。 S&P 500(US500 / SPX500) に特化して設計され、スマートマネーのロジックと統制されたリスク管理、そしてチャートパネルによる完全な手動制御を両立します。 全自動 および 半自動 の両方で運用可能。 構造ブレイク(BOS)を自動検出し、確認済みのインパルスにのみ反応します。マーチンゲールや危険なナンピンは一切使用しません。 主な機能 BOS(構造ブレイク)のリアルタイム検出 統合パネルによる全自動/半自動トレード 全ブローカー対応プロファイル(AUTO / SET_01 / SET_0.01 / DIRECT) S&P 500に最適化。制限なく DIRECT で全銘柄に最適化可能 エクイティ段階ベースのロット管理 多段階ダイナミック・トレーリングストップ 口座全体を保護するエクイティSL/TP インタラクティブ・パネル(

Hi Traders,
On purchase this tool we will give lifetime free updates for this tool
you can contact me how to use this tool better or your suggestion for improvement
This tool will work on any accounts
Where When Enter Exit – Trade Plotter helps traders easily see, track, and review their sell trades directly on the chart.
It clearly shows where you entered, when you exited, and why , so you can quickly learn from every trade. Key Features Auto Plot Entries & Exits –
Enhance your trading strategy with this indicator from tr1cky.com This indicates buying and selling strength. Look for correlation on multiple timeframes for best indication and confidence in your trade. This indicator is simply RSI-MFI for buying and MFI-RSI for selling and is used in the successful expert advisors by tr1cky,com that just use this indicator for execution.

Apeiron Edge Alerts - Advanced Price Level Alert System Overview Apeiron Edge Alerts is a powerful and intuitive alert management tool designed for active traders who need reliable notifications when price reaches critical levels. Track unlimited price levels across multiple timeframes with customizable alert settings, visual feedback, and persistent session management. Key Features Flexible Alert Creation Draw Mode : Click anywhere on the chart to create instant horizontal line alerts Make M
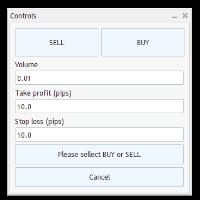
Trade Panel – Smart Order Execution Tool for MetaTrader 5 Trade Panel is a lightweight and intuitive trading assistant designed to simplify manual order execution in MetaTrader 5. It allows traders to quickly place BUY or SELL orders with custom lot size, stop loss, and take profit values — all managed through a clean, responsive interface. Key Features: Fast order placement with one-click confirmation Real-time visualization of Stop Loss and Take Profit lines Editable fields for lot size and pi
Signal Histogram — これはMetaTrader 5プラットフォーム向けの信頼できるテクニカル指標で、終値と移動平均の比較に基づいて現在のトレンドを視覚的に決定することを目的としています。指標は別のウィンドウにヒストグラムを表示します:緑のバー(柱)は価格が平均以上であることを示し、赤のバー(柱)は価格が平均以下または平均であることを示します。このアプローチにより、トレンドの方向を迅速に評価し、潜在的な反転ポイントを特定できます。指標は価格と移動平均のクロス時に取引シグナルを提供し、これは特にスキャルピングとデイトレーディングで役立ちます。すべてのシグナルはリペイントなしで、バー閉鎖後にのみ形成されるため、安定性と履歴での効果の客観的な評価が可能になります。正確性を高めるため、Signal Histogramは時間フィルターを使用します:取引セッションの作業ウィンドウを設定して、ノイズの多い期間を除外し、最もアクティブな市場セクションに集中できます。これにより、特定の時間帯での取引を好むトレーダーにとって特に適しています。指標はプッシュ通知とアラートをサポートし、モニ

### 究極のキャンドル指向グリッド・マーチンゲールロボットで爆発的な利益を解き放て!
市場のボラティリティがアカウントを枯渇させるのにうんざりですか?変動を利益に変えるスマートな戦略をお探しですか?**先進トレンド組み合わせ付きキャンドル指向グリッド・マーチンゲールロボット**をご紹介します – MetaTrader 5専用に設計されたこのEAは、ボラティリティを活用して一貫した利益を提供します!経験豊富な開発者によってトレーダーのために作られたこのロボットは、グリッド取引、マーチンゲール手法、そして革新的なトレンド分析を融合させ、リスクを最小限に抑えながらリターンを最大化します。外汇、株式、先物、スキャルピングに最適 – あなたの取引をトップレベルに引き上げましょう!
#### このロボットを選ぶ理由:インテリジェントで信頼性が高く、高い収益性 このロボットは市場をただ追うだけではなく、予測し支配します。先進の方向検知が取引を本物のモメンタムと同期させます: - **多用途の自動モード**: AutoCandle(キャンドルパターンに基づく)、AutoZigZag、AutoE

ARB は、適応型 ATR チャネルシステムと正確な多要素スコアリングモデル(0〜100)を使用して、高確率のブレイクアウト機会を特定するために設計されたインジケーターです。
ボラティリティ、出来高、モメンタム、そして複数の時間軸のトレンドを組み合わせ、リアルタイムでフィルタリングされた視覚的かつ実用的なシグナルを提供します。 動作原理 このインジケーターは Adaptive Range Breakout(ARB) の概念に基づいており、市場のボラティリティ(ATR)と価格の動的構造に応じて閾値を自動的に調整する、現代的なブレイクアウトトレード手法です。
各シグナルは、確認前にセットアップの品質と信頼性を測定する加重スコアによって評価されます。 スコアリングシステムの構成(0〜100) 各要素は、シグナルの強さを評価するための総合スコアに貢献します。 要素 重み 説明 チャネル内の位置 40% 現在の ATR ゾーン内で価格がどこに位置しているかを測定 ブレイクアウトへの近さ 25% 重要な閾値までの距離を評価 出来高による確認 15% 現在の出来高を移動平均と比較 上位タイムフレーム

Colors schemes powerful MetaTrader 5 script designed for traders who value speed and a personalized trading environment. With a single click, you can instantly transform your chart's appearance using one of several professional, pre-designed color schemes, including popular styles like ICT/SMC. How to Use: In your MetaTrader 5 terminal, open the Navigator window (Ctrl+N). Find the Colors schemes script under the "Scripts" section. Drag and drop the script onto the chart you want to customize. A

This Expert Advisor is built to catch the cleanest M5 momentum moves on XAUUSD using a classic, proven combo: EMA 9/21 trend shift + ADX strength filter . It only fires when price actually has power — no weak crosses, no random entries, no overtrading. How it trades Waits for EMA(9) to cross EMA(21) EMA 9 crosses above EMA 21 → buy setup EMA 9 crosses below EMA 21 → sell setup Checks ADX(14) ≥ your level (default 25)
→ this makes sure the market is really moving , not ranging. If no open trade

Hedge Scalper EA Hedge Scalper EA is an advanced MQL5 Expert Advisor designed for scalping on volatile indices.Built on the foundation of the popular EA Bull Scalper v4, it extends buy-side grid trading with limited hedging capabilities—allowing long positions for bullish momentum capture, while capping shorts for controlled downside protection. Key Features: Dynamic Grid Spacing : Uses AI-driven calculations (based on candle volatility and bearish sentiment) or manual points to maintain a minim

GOLD PRIME EDGE PRO — ゴールド専用・精密モメンタムEA 結果を求めるトレーダーのために設計された“安定と精度の融合” 概要 GOLD PRIME EDGE PROは、 GOLD(XAUUSD)専用 に設計された次世代型EAです。
狙うのは「派手なスキャルピング」ではなく、 一貫した安定利益と再現性のある成長 。
トレンドとモメンタムを融合し、ボラティリティ変化にも柔軟に対応します。 推奨時間足: M5(5分足)
短期~中期のGOLDトレードに最適化されています。 特徴 ・完全自動売買対応(XAUUSD専用最適化済み)
・安定した損益曲線と低ドローダウンを実現
・1通貨ペア1ポジション制御による安全運用
・スマートトレーリングによる柔軟な利確機能
・スプレッド/ロット上限の安全設計
・必要最小限のパラメータで簡単操作 パフォーマンス(バックテスト結果) 安定モード(Safe Mode)
・プロフィットファクター:1.77
・最大ドローダウン:7.25%
・期間:2024年1月~2025年10月
・取引回数:201回 爆益モード(Prime Mode)
・プロフ
Fibo AUTO Pro: Redefining Fibonacci Analysis - Smarter, More Intuitive, More Efficient Product Overview
Fibo AUTO Pro is a professional-level technical analysis indicator designed specifically for modern traders. Based on the classic Fibonacci retracement theory, it has been comprehensively enhanced with intelligence to address the pain points of traditional drawing tools in terms of efficiency, visualization, and accuracy. Fibo AUTO Pro is not merely a line-drawing tool; it is your intellige

Smart ATR Breakout – Fully Automated Trend & Breakout EA Smart ATR Breakout is a fully automated trading system designed for traders who love clean breakout logic combined with smart risk control.
It works perfectly on XAUUSD, GBPUSD, and USDJPY , adapting dynamically to market volatility using the Average True Range (ATR) indicator. This Expert Advisor detects strong market impulses, places pending orders at strategic breakout levels, and manages trades automatically with intelligent money mana

Gold Sheesh — 適応型高精度トレーディングアルゴリズム Gold Sheeshは、早朝セッションのモメンタムとテクニカルパターン認識に基づいて取引を識別し実行するように設計された自動トレーディングシステムです。当初は金(XAU/USD)向けに開発されましたが、ブレイクアウトパターンと市場構造を分析することで、主要通貨ペアやインデックスにその手法を拡張しています。 コア方法論 本システムはオープニングレンジブレイクアウト(ORB)フレームワークで動作し、早朝市場時間の初期取引範囲を特定し、確立された境界を超える方向性のある価格変動を監視します。アルゴリズムは、エントリーシグナルをフィルタリングし、モメンタムを検証するために、複数のテクニカル指標を組み合わせて処理します。 テクニカル分析コンポーネント マネーフローインデックス(MFI) : 価格とボリュームデータの両方を組み込むことで買いと売りの圧力を測定し、0から100の範囲の値で買われ過ぎまたは売られ過ぎの状態を識別するのに役立ちます。 ストキャスティックモメンタムインデックス(SMI) : 現在の終値を最近の高値・安値範

Skyline Scalper MT5 - The Ultimate Automated Trading Solution Conquer the market like a professional trader! Are you tired of the stress of manual trading and watching the market for hours? Introducing Skyline Scalper MT5 – a new generation Expert Advisor designed for your MetaTrader 5 terminal. This EA uses advanced algorithms to find precision entry points in the market, giving you new confidence in your trading. Why Choose Skyline Scalper MT5? Engineered for Freedom: Reclaim your time. Skylin

AMSV Zones - Adaptive Market Structure + Volatility Zones
Stop trading blind support/resistance levels. Start trading zones that adapt to real market conditions.
AMSV Zones combines multi-timeframe market structure analysis with volatility-adaptive zones to identify high-probability trading opportunities. Unlike traditional indicators using fixed levels, AMSV automatically adjusts zone widths based on current ATR, ensuring relevance during both calm and volatile periods.
KEY FEATURES
1. Mu

Aurifer Precision 100 – Expert Advisor for MT5 Unlock the power of gold trading with a finely-tuned algorithm built for consistency, not just spikes. Aurifer Precision 100 is crafted exclusively for the XAUUSD (Gold) market on the MetaTrader 5 platform, engineered to aim for up to 100% annual return while keeping maximum drawdown around 10% . Key Features: Dedicated to gold: trading XAUUSD M15 only, benefiting from gold’s unique volatility and trend characteristics. Dynamic risk management: adap
Martingale EMA 20 is a professional Expert Advisor designed to deliver consistent performance and stable growth across the most traded currency pairs and gold.
This EA is optimized for the 15-minute (M15) time frame and performs exceptionally well on USDJPY, EURUSD, and XAUUSD .
Built with precision, it combines a smart money management system, adaptive trade scaling, and powerful entry filters to make trading decisions that balance safety and profitability. The algorithm was crafted to adapt

!!! DON'T MISS OUT !!!
MSB Pro Dynamic Gold EA: High Stability, Proven Profit "MSB Pro Dynamic Gold EA" is the flagship product offered by the MSB Pro brand, designed to provide high and stable profit on the Gold (XAUUSD) market using powerful risk management and proven profitability protocols. This Expert Advisor utilizes a trend following and breakout strategy built on dynamic Stop Loss and equity protection.
️ Important Note (Read Before Using) This basic strategy does not guarantee pr

# ラリードロップ&ベースキャンドル - プロフェッショナルなパターン認識
## 概要
ラリードロップ&ベースキャンドルは、トレーダーが高確率の需給ゾーンを特定できるように設計された、プロフェッショナルなローソク足パターン識別システムです。このインジケーターは、機関投資家の取引戦略の基礎となる3つの重要なローソク足タイプ、すなわちラリーキャンドル(強い買い圧力)、ドロップキャンドル(強い売り圧力)、そしてベースキャンドル(保ち合いゾーン)を自動的に識別し、強調表示します。
## 主な機能
**自動パターン認識** - 強い強気の勢いを示すラリーキャンドルを識別 - 強い弱気の圧力を示すドロップキャンドルを検出 - 保ち合いと潜在的な反転ゾーンを示すベースキャンドルを強調表示 - RBD、DBR、RBRパターンに対応したリアルタイムラベリングシステム
**完全にカスタマイズ可能な設定** - 各キャンドルタイプのパーセンテージしきい値を調整可能 - 視覚的に分かりやすいカスタムカラースキーム - 設定可能なラベル表示オプション - 取引スタイルに合わせてパラメータを微調整可能

機関投資家向け流動性圧縮インジケーター このインジケーターは、ボリンジャーバンドの幅、出来高、平均スプレッドを正規化してリアルタイムで流動性の引き締まりを測定し、価格ブレイクアウト前の圧縮フェーズを検出します。 表示:
プロフェッショナル仕様の独立ウィンドウに「Compression Score」ヒストグラムと「Threshold」基準線を表示。 主な特徴 早期検出: 価格の急変前に圧縮ゾーンを特定。 多要素分析: 正規化されたボリンジャーバンド幅、出来高、平均スプレッドを組み合わせ。 リアルタイム更新: 現在のバーでティックごとに更新。 明確な可視化: 「Compression」ヒストグラムと点線の「Threshold」ライン。 互換性: MT4 および MT5 に対応。 使用方法 対象銘柄のチャートにインジケーターを追加します。 ボラティリティやセッションに合わせて閾値と重みを調整します。 解釈: スコアが高い場合は流動性圧縮フェーズを示します。価格のブレイクアウトを注視してください。 パラメーター BB_Period / BB_Dev: ボリンジャーバンド幅の計算。 Norm_

Timeframe Zoom, The Third Screen, is an Expert Advisor that operates using Heiken Ashi candlesticks on daily, hourly, and fifteen-minute timeframes, with the fifteen-minute timeframe triggering trades.
It buys on days with blue candlesticks and sells on days with red candlesticks. It ensures that the potential trade is above or below a moving average on the hourly timeframe and uses the MACD and CCI indicators on the fifteen-minute timeframe to confirm the entry.
It exits trades when the Heike
roduct Overview Smart Grid Hedging EA is an advanced algorithmic trading system that combines trend filtering , grid trading , and hedging strategies to create a robust automated trading solution. This Expert Advisor is designed for forex and commodity markets with special optimization for gold (XAUUSD) trading. Core Features Dual Engine System Engine A : Specialized for buy (long) positions with independent magic number Engine B : Specialized for sell (short) positions with independ

Object Synchronizer: Seamless Chart Object Duplication & Management Tired of drawing the same trendline or Fibonacci retracement on multiple charts for the same symbol? Wish your analysis on one timeframe would instantly appear on another? Introducing Object Synchronizer , the ultimate utility indicator for MQL5 that bridges the gap between your charts. Designed for professional traders and analysts using multiple charts of the same symbol, this powerful tool automatically duplicates and manages

Adaptive AI Trader - Complete User Guide Overview The Adaptive AI Trader is a sophisticated Expert Advisor (EA) for MetaTrader 5 that combines neural network technology with traditional technical analysis to execute automated trades. This EA is designed for both novice and experienced traders who want to leverage AI-powered trading strategies. Key Features AI-Powered Trading Neural Network Prediction : Uses machine learning to predict price movements Adaptive Learning : Continuous
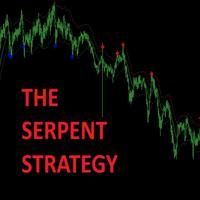
Trade Like a Serpent — Calm, Precise, Lethal. The Serpent Strategy equips you with a visual edge — clarity in confusion, precision in volatility, and confidence in timing.
Let your trades strike like a serpent — swift, silent, and accurate. Overview The Serpent Strategy is a powerful custom-built MetaTrader 5 indicator designed to identify high-probability trade zones using a unique combination of market volatility, trend direction, and momentum confirmation.
It visualizes price action in th

Expert Advisor that monitors the price movement of a symbol using a strategy that checks for price changes at predefined points after the price has crossed the fast moving average (which is trending upwards above the slow moving average). It then triggers a buy order when the price crosses the fast moving average again, acting on the rebound. It features a stop-loss mechanism based on the percentage of price change. Once a certain loss threshold is reached, the 'no-op' signal is activated, preve

Compounding Grid EA: Smart Trend-Following Automation
**Overview** Compounding Grid EA is a powerful, automated trading robot designed for MetaTrader 5. It combines trend detection with a flexible grid strategy to capture profits while managing risks. By following market trends on higher timeframes and entering trades on lower ones, it aims to grow your account steadily through compounding—closing all trades when equity hits a growth target. Perfect for forex pairs like EURUSD or XAUUSD, it

AI Capital Guardian HotSwitch Pro (Gold Edition)
Intelligent and adaptive trading system for Gold (XAUUSD)
Concept
The Capital Guardian HotSwitch Pro is a fully automated MT5 Expert Advisor that dynamically adapts to market conditions – from ranging to trending phases.
It automatically detects shifts in volatility and switches between two core trading modes for optimal balance between precision and stability.
️ Strategy Modes
Smart Scalping Mode (Trend)
→ executes short micro-trades (3–7

The Trend Wave indicator for MetaTrader 5 ( MT5 ) is a reliable tool designed to help traders effectively identify market trends and potential reversals . By utilizing oscillating wave patterns, this indicator provides clear visual signals, enabling traders to capitalize on price movements . Whether you are a day trader or a swing trader , this indicator is a versatile addition to your trading toolkit, simplifying complex market analysis.

Overview – The Key to Long-Term Trading Success TutuTrader is a professional trend-following signal system designed for traders who value precision, discipline, and long-term consistency .
It automatically identifies high-probability entry zones based on trend direction, price action, and volatility , helping you focus on execution, not emotion . This EA is not about overtrading — it’s about catching the right trend, managing risk, and letting profits grow . ️ Note: This Ex
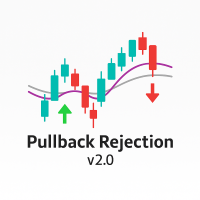
Overview Pullback Rejection v2.0 is a professional-grade visual indicator that spots continuation setups after pullbacks using Heiken Ashi logic and multi-EMA trend bias.
It is designed for scalpers and intraday traders who want clean, rule-based BUY and SELL signals aligned with trend direction only — no repainting, no noise, no counter-trend traps. Trading Concept The indicator combines EMA 7, EMA 50, and EMA 200 to define directional bias: Bias Condition Trades Allowed Bullish EMA7 > EMA200
MetaTraderマーケットは、開発者がトレーディングアプリを販売するシンプルで便利なサイトです。
プロダクトを投稿するのをお手伝いし、マーケットのためにプロダクト記載を準備する方法を説明します。マーケットのすべてのアプリは暗号化によって守られ、購入者のコンピュータでしか動作しません。違法なコピーは不可能です。
取引の機会を逃しています。
- 無料取引アプリ
- 8千を超えるシグナルをコピー
- 金融ニュースで金融マーケットを探索
新規登録
ログイン