YouTubeにあるマーケットチュートリアルビデオをご覧ください
ロボットや指標を購入する
仮想ホスティングで
EAを実行
EAを実行
ロボットや指標を購入前にテストする
マーケットで収入を得る
販売のためにプロダクトをプレゼンテーションする方法
MetaTrader 5のためのエキスパートアドバイザーとインディケータ - 153

Trade our product really works best in best we are not 100% confirm but yes really in long term definitely it gives you profit . so you can take it as a demo and now free of cost . it will also increase so take this opportunity as soon as possible so you can trade it AND MAKE profit dont waste your time and take this opportunity and make your dream success. and this is for limited period of time so dont waste time and gain this .

UV Samurai UV Samurai is a specially designed Expert Advisor (EA) that automatically opens trading orders at predefined price intervals ( Distance ) to take advantage of market movements in a controlled manner. The EA operates based on a multiplier distance mechanism for each subsequent trade, combined with the DDR (Dynamic Drawdown Reduction) risk management system to minimize potential losses and maintain account safety during high-volatility market conditions. The Recommended
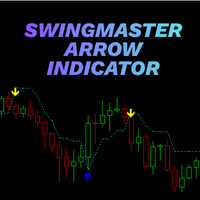
SwingMaster Arrow Indicator – Catch the Move Before It Runs Without You Tired of watching perfect moves start… right after you exit the chart?
SwingMaster Arrow Indicator is designed exactly for that pain – to spot clean swing entries and exits so you don’t miss the real move, and don’t get stuck in useless noise. This isn’t just another random arrow painter.
SwingMaster works like a smart “SuperTrend-style” engine that tracks market swings and highlights high-probability turn points with clear

MultiChartSync5 - Multi-Chart Auto-Sync Tool User Guide Program Overview MultiChartSync5 is a professional MetaTrader 5 multi-chart synchronization tool that enables automatic timeline alignment and synchronized navigation across multiple chart windows, significantly improving efficiency for multi-instrument and multi-timeframe analysis. Core Features 1. Intelligent Chart Synchronization Automatic Chart Alignment : All secondary charts automatically align with the master chart's candlestick t

Tentu. Berikut ialah draf penerangan penuh yang menggabungkan semua maklumat yang telah kita bincangkan, sedia untuk anda salin dan tampal ke halaman MQL5 Market anda. Title: TripleBull VS TripleBear Short Description TripleBull VS TripleBear is a sophisticated, fully automated Expert Advisor (EA) designed to identify and trade on powerful three-bar momentum patterns. Its core strategy is based on a "versus" logic: it will open a BUY trade after a "Triple Bull" pattern is detected, and will the

=================================================== THE FUN & FRIENDLY GUIDE TO THIS PRO SCALPING TOOL V2 ===================================================
Welcome, fellow alchemist of the financial markets! If you're reading this, you’ve unlocked one of the most interesting, dramatic, occasionally chaotic, but ultimately POWERFUL tools in the XAUUSD universe: **Your Trailing_SLTP**.
Grab a cup of coffee (or something stronger), and let’s begin your journey.
----------------------------

What it does: Scans a fixed list of assets (24-hour US stock pairs from the Pepperstone brokerage) on the chosen timeframe. For each pair and for various periods (Period1…Period100 ABOVE) it: Calculates a regression model between the two assets (and, if desired, using the US500 index as a normalizer). Generates the residual (spread) of this relationship, its mean, standard deviation, correlation, and betas (B1 and B2). Applies an ADF test to the residual (cointegration/stationarity). Calculates

Gold Price Action Hunter — Precision Gold (XAUUSD) Trading
The Gold (XAUUSD) market is famous for its strong trends and sharp, unpredictable volatility. Many traders are drawn to its potential but struggle with its complexity. Gold Price Action Hunter is a state-of-the-art Expert Advisor designed to trade Gold with precision using price action, wick rejection, and momentum patterns . This EA doesn’t rely on a single indicator or static strategy. Instead, it performs real-time analysis of candle

Predator 8 AI AI Predicts Next 8 Candles Trend Continuation Probability _______________________________________________________________________________________ Core Features Real-time output of next 8 candles up/down/sideways probability per bar Built-in Lasso+Attention deep learning model (fully embedded, no internet, no coding required) Zero repaint – historical signals never flicker Supports all markets: Forex, Gold, Crypto, Indices Model Training Trained on over 12 million real tick data (20

Intrade Gold Scalp Hedge Panel は、手動でエントリーした XAUUSD トレードのためのプロフェッショナルなポジション管理ツールであり、非常に高速かつボラティリティの高いゴールド市場において、手作業では間に合わないことが多い管理を効率的に行うために設計されています。 すべてのエントリーはトレーダー自身が手動で行います。本パネルは独自にシグナルを生成したり、自動売買戦略を実行したりすることはありません。その代わりに、ゴールド市場でリアルタイムに手動管理するのが難しい部分に特化しています。 相場があなたの方向へ素直に動いている間、勝ちポジションを自動で追加してポジションを拡大 相場が逆行した際に、積み上げた利益を自動的に保護 ターミナル内を探し回ることなく、ワンクリックでヘッジ・ブレークイーブン決済・全決済を実行 特に XAUUSD では、数秒で大きく動くことがあり、手動でタイミングよく反応するのは非常に難しくなります。パネルはここで真価を発揮します。オープン中のポジションをティックごとに監視し、あらかじめ設定したルールを一貫して適用することで、手動クリックよ

キャンドル分析コナン
Candle Analysis Conan PRO は、
ダイナミックなフラクタルロジックとアダプティブスイング検証エンジンによって構築された、
高精度のトレンド検出と市場構造可視化システムです。 本システムは、HH(高値更新)、LL(安値更新)、および主要な構造変化をシームレスに判別し、
機関投資家レベルの明確さで市場の「本質的なリズム」を読み解くことを可能にします。 ZigZag 精度、フラクタル検証、そしてボリューム認識ロジックを統合し、
SMC(Smart Money Concept)、マーケットストラクチャー分析、
高精度のスイング分析に最適化された設計となっています。 コアエンジンモジュール(Core Engine Modules) 1. ZigZag フラクタル検出 カスタマイズ可能な Fractal_Period による高度なフラクタル認識 ノイズを抑え、構造的な転換点を確実に捉えるアダプティブ ZigZag Min_Deviation による最小変動幅の精密管理 2. トレンド確認フィルター(Trend Confirmation Filter)

you tired of exporting your trading history to Excel just to figure out your stats? Do you struggle to know if your EA is actually profitable, or if your manual trades are hurting your performance? Stop guessing and start analyzing. The Trade Performance Dashboard is a powerful, all-in-one utility that replaces guesswork with facts. It loads directly onto your chart and instantly analyzes your entire trading history, presenting all vital statistics in one clean, professional panel.
Finally, Kn

N/B: All our product purchase comes with our free ‘’DAILY SCALPER EA’’ - bit.ly/4qlFLNh Whatsapp Developer for yours after successful purchase
DAY TRADER PLUS: The Institutional Order Flow System
Finally See Where Banks Place Their Orders - And Profit With Them
ARE YOU SICK OF THIS?
"I entered the trade at what seemed like the perfect time... only to watch price reverse immediately and hit my stop loss."
"I took profits too early, then watched the market run another 100 pips w

How the Chart Cleaner Script Works
The Chart Cleaner is a one-click tool designed to instantly wipe your chart clean.
When you drag and drop the script onto a chart, it scans for and removes all visual objects—including trend lines, horizontal lines, text labels, shapes, and any other drawings you have placed.
The result is a completely clean, uncluttered chart, giving you a fresh workspace for your analysis. It's the fastest way to reset your chart to its default state.

ThunderSentinel is a simple yet powerful tool that helps you manage open positions automatically by closing them as soon as they reach your desired profit. It is designed for traders who want to automate the closure of trades without manually setting Take Profit levels. Main Features Automatic position closure:
You can choose whether to close trades based on a profit in euros or on a percentage gain. Continuous monitoring:
ThunderSentinel checks all open positions every X seconds (configurable

You Give an Instruction: When you run the script, a window pops up with a dropdown menu. You choose exactly what you want it to do from the list (e.g., "Close Profit Only" or "Delete Pending Orders"). It Scans Your Positions: The script then reads your instruction and systematically goes through your open trades and/or pending orders on the current chart. It Applies Your Rule: For each trade it finds, it checks if it matches the rule you selected. If you chose "Close Buy Only," it will only clo

QUANTUMGRID FX - Advanced Forex Grid System PROFESSIONAL GRID TRADING FOR MAJOR FOREX PAIRS SEND ME A DM AFTER PURCHASING FOR PERSONALIZED SETTINGS: Custom optimization for GBPUSD & EURUSD Settings tailored to your account size Broker-specific recommendations 24/7 premium support access INTELLIGENT FOREX GRID TRADING TECHNOLOGY Traditional Grid EAs Use Outdated Technology:
Fixed grids that don't adapt to market conditions
No session awareness for forex markets
Basic risk ma

Elliott Wave Drawing Tool for MT5 – The Ultimate Professional Wave Mapping System Take your market analysis to the next level with the Elliott Wave Drawing Tool for MT5 , an advanced charting solution designed for traders who demand precision, speed, and complete control in wave labeling. Engineered for both beginners and expert Elliotticians, this tool transforms manual wave marking into a smooth, intuitive, and highly accurate experience. Built with a smart drawing engine , this indicator lets

WHAT IS HTF CANDLES PRO? HTF Candles Pro is an advanced Multi-Timeframe indicator that constructs custom higher-timeframe candles directly from H1 bars, combining this visualization with a complete system of internal Fibonacci levels and projections. Unlike other HTF indicators that only display standard MetaTrader timeframes, this indicator allows you to create completely customized timeframes (24H, 48H, 72H, 96H, etc.) by aggregating 1-hour bars. KEY FEATURES 1. CUSTOM CANDLE CONSTRUCTION Cust

Acceleration Bias — Price Acceleration Impulse Indicator Acceleration Bias is a modern analytical tool designed to measure changes in price acceleration and visualize impulse asymmetry using a robust mathematical model.
This indicator is intended for traders working with market volatility, impulse phases, and price-movement structure, as well as those who need algorithmic, rule-based analytical support. Purpose and Core Concept Unlike traditional oscillators that analyze only velocity changes (f

This Expert Advisor (EA) for MetaTrader 5 (MT5) has been designed to automatically manage Stop Loss (SL) and Take Profit (TP).
Main Features
Automatic Detection of Manual Positions : Monitors new manual positions without SL/TP and applies the configured rules Multiple Orders : Opening of multiple orders under the same conditions as the original position Hidden SL/TP : The hidden mode allows creating SL/TP invisible to your broker Equity Protection": Allows defining a threshold for the accou

Range Expansion Master EA If you’re serious about consistency and prefer a calm, low-stress approach to trading, this EA fits you well. It rewards patience, discipline, and anyone looking to build steady passive income over time.
Discover the Power of Precision Trading The Range Expansion Master EA is a next-generation automated trading system built for MetaTrader .
It identifies price ranges, waits for powerful breakouts, and executes trades with speed and accuracy — all without you lift
Risk Manager is an MT5 Expert Advisor that opens a market order with a precisely sized lot at the cursor’s vertical level as Stop-Loss, using a single hotkey. Side is detected automatically: SL below price → BUY, SL above price → SELL. Risk is computed in account currency via OrderCalcProfit, so it works correctly on FX, metals, indices, and crypto.
Why traders use it Eliminates mental math and lot calculators. Turns any discretionary setup into a consistent, risk-fixed execution in one keystr

EAの主な特徴 スマートな注文管理:注文の全体スイッチ、動的な最大ポジション計算、時間間隔制御などに対応。 柔軟な利食い・損切り:動的ストップロス、含み損保護利食い、トレーリングストップなど多様な利益保護機能。 SARシグナルフィルタリング:パラボリックSARのトレンドシグナルに基づき、より正確なエントリーポイントを提供。 高度なリスク管理:口座残高、証拠金比率などのリスク管理機能を内蔵し、安全な取引を実現。 多様な取引シナリオ対応:複数通貨ペア、異なる口座タイプ、各種戦略ニーズに対応。 新機能 動的ストップロス(Dynamic SL):価格変動に応じて自動的にストップロスを調整し、リスクを低減。 高度なリスク管理:動的最大ポジション計算を有効化し、証拠金比率に基づきリスクを管理。 含み損保護利食い:含み損発生時に保護的な利食いを設定し、損失を軽減。 精密な損切り管理:各注文ごとに個別の損切り金額とスリッページ設定が可能。 EAパラメータ概要 主な設定項目: 注文パラメータ:注文全体スイッチ、最小間隔、スリッページ制御など。 SARパラメータ:加速因子、初期値、最大値の柔軟な設定、シ

Velora - The Intelligent Grid EA with Dynamic Risk Logic Following the 5-star success of its MT4 predecessor, Velora has now been completely rebuilt and enhanced for the MT5 platform. Velora is not just another grid expert advisor. It is a sophisticated, multi-pillar trading system designed from the ground up for adaptability and risk-awareness. It intelligently combines a dynamic breakout signal with a self-aware grid and a fully autonomous "Smart Trailing" stop loss. At its core, Velora operat
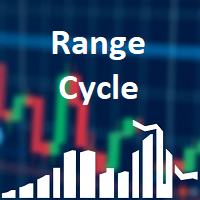
Range Cycle Indicator. Gives signal on price range cycling smoothed by moving average. It is better to use it on H1+ timeframes and avoid side markets. Because if market is flat this indicator will give too many zero profit or even losing signals. Parameters: PopUpAlert - to allow it to alert when trend changes; EMailAlert - for email alerts; period - this is a smoothing criteria, use higher values on lower timeframes; TimeFrame(new) - higher timeframe (or the same) to use for calculation, defa

MFCS(マルチファクター・チャネル・スコア) は、市場のダイナミクスを明確に読み取るために設計された高度なインジケーターであり、加重スコアリングシステムとボラティリティに基づく適応型チャネルを使用します。 主な特徴: リアルタイムのボラティリティに応じて調整される適応型ATRチャネル マルチファクター・スコアリング(ポジション、出来高、モメンタム、上位時間足トレンド、ボラティリティ) スコア強度(0〜100)に基づくシグナル分類 スコア、トレンド、および主要指標を表示する完全なダッシュボード 市場方向を整合させるマルチタイムフレーム・フィルタリング 信頼性を高めるためのオプションの出来高検証 主要パラメータ: 調整可能なATR期間、乗数、およびウィンドウ カスタマイズ可能なスコアウェイト 移動平均による出来高フィルタ 統合アラート付きカスタマイズ可能なダッシュボード 使用方法:
市場構造の定量的評価を求めるトレーダーやテクニカルアナリスト向けに設計されています。
高いポテンシャルゾーンの特定、動きの強さの測定、エントリータイミングの精緻化に役立ちます。

De Magic Gold is designed to execute trades using a proven algorithm that has been developed and refined through years of dedicated research.
De Magic Gold uses predefined stop loss and take profit levels. Only one or two open positions are allowed at a time, ensuring disciplined risk management. Every trade placement is calculated; there is always risk in everything, but with data, statistics, and multi-year development, we also gain the statistical strength needed to face and overcome those

AureX Indicator AureX Indicator is a technical analysis tool for MetaTrader 5.
It is based on a momentum‑style oscillator that measures price accelerates and decelerates. The indicator is designed to: calculate a smoothed internal momentum curve from price data highlight regular, hidden and exaggerated divergence between price and the oscillator mark areas where price movement and internal momentum are not aligned AureX is intended to support your own market analysis and trading plan. It does no

AIFXEdge Crossover Pro - Professional Triple EMA Trading System Brief Introduction AI-powered Triple EMA crossover strategy with DUAL-MODE operation (Automatic + Manual), professional dashboard, Telegram alerts, and advanced trade management. NEW in Version 2.5: Full automatic trading capability with intelligent risk management - perfect for both hands-off automated trading and active manual control! YouTube Link: YouTube: https://www.youtube.com/watch?v=Wtg7Jyf6S5s Join our Tel

RSI Weighted Scaler Pro 2.8 is a controlled multi-entry trading system designed to exploit RSI-based reversal and exhaustion points with stable, fixed-lot scaling. The EA adds positions only when market conditions remain favorable, without increasing lot sizes or applying aggressive risk models. The strategy uses RSI overbought and oversold levels to generate high-probability entry zones. Traders can enable new-bar confirmation to reduce noise and limit entries using a configurable maximum numbe

Reversing MACD — Indicator Overview Reversing MACD is a forward-looking analytical tool that calculates the exact price the next bar would need to reach for the MACD line and the signal line to cross on the upcoming candle .
Instead of waiting for a crossover to occur after the fact, the indicator answers a more powerful question: “At what price will the MACD cross on the very next bar ?” Core Idea Behind the Indicator Traditional MACD reacts to price changes after they occur .
A trader only see
Range Breakout Beast MT5 ― 明確な価格ゾーンからの精密ブレイクアウト Range Breakout Beast MT5 は、 レンジ(もみ合い)からのブレイクアウト に特化した全自動エキスパートアドバイザ(EA)です。任意に設定できる取引ウィンドウ(例:アジア時間)内でタイトな価格レンジを検出し、充実した リスク管理と口座保護 のもとでスマートにブレイクアウトを執行します。
マーチンゲールもグリッドも不使用 ――ルールベースの明確なエントリー&イグジットのみを行います。 なぜ Range Breakout Beast なのか 明快で検証しやすい優位性: タイトレンジのブレイクに、ボラティリティ/スプレッド/品質フィルターを組み合わせ。 一貫したリスク重視: 固定または割合/レンジベースのSL/TP、ブレークイーブン、トレーリング、分割利確など。 幅広い市場に対応: FX・株価指数・ゴールド――レンジ幅と各種フィルターで柔軟に調整可能。 ブローカー&プロップにフレンドリー: ECN対応、マーケットオーダー、ニュース休止、プロップチャレンジを支援するルール群。 ク

Introducing Megalodon EA – A New Era of Smart Automated Trading Megalodon EA is not just another Expert Advisor — it’s a revolutionary trading concept designed for the new generation of Forex traders who want precision, speed, control, and consistent performance . Built for MetaTrader 5, Megalodon EA combines:
High-accuracy scalping logic
Independent Buy/Sell systems
Dynamic risk management and auto lot sizing
Intelligent filters by session, weekday, and market conditions
Optio

The SMA20 Gold Precision EA is an advanced automated trading system designed specifically for XAUUSD (Gold) on the H1 timeframe . It’s built for traders who value consistency, precision, and risk control over random speculation. This Expert Advisor has been carefully developed, tested, and optimized to work in dynamic market conditions while maintaining a disciplined and systematic trading approach. Whether you are an experienced trader looking for stability or a beginner wanting automation with

InsideEA - Professional Narrow Range Breakout Trading System InsideEA is an automated trading system based on the proven Narrow Range breakout strategy. The EA identifies consolidation periods where price movement contracts significantly, then executes trades when price breaks out of these tight ranges with momentum. Core Strategy The EA monitors price action to detect Narrow Range patterns (NR3, NR4, NR5, NR7) where the current bar's range is the smallest among recent periods. These consolidati

CrossRoad Scalper — How It Works CrossRoad Scalper is a free, open-source Expert Advisor for MetaTrader 5, designed to demonstrate how you can automate multi-asset trading using a combination of progressive grid logic, indicator filters and robust risk management. The aim is not to promise profits, but to provide a working, tested codebase for learning, experiments or even real use—your choice! General Logic & Workflow Multi-Asset: One EA can monitor and trade multiple instruments—forex p
Cycle Signals Indicator. Gives signal on price range cycling and smoothed with algorithm. There are very small parameters: allow alerts (Pop Up or Email), colors for chart arrows, timeframe to use for calculation (but better to use current timeframe). And most important parameter is "period". For low timeframes high values are recommended. Current period is good for M5. Decrease it for higher timeframes. Close trade arrows will come soon. Any suggestions please comment.
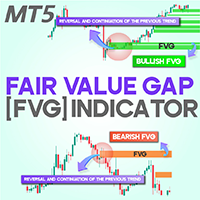
Fair Value Gap (FVG) Indicator for MetaTrader 5 The Fair Value Gap (FVG) Indicator for MetaTrader 5 is a highly practical tool that helps traders identify trading opportunities by pinpointing supply and demand imbalances in the market. These imbalances, known as Fair Value Gaps (FVGs) , occur when price moves sharply, leaving a gap between buying and selling pressure. To put it simply, when three consecutive candlesticks form, the space between the first and third candlestick—where price did not
N/B: All our product purchase comes with our free ‘’DAILY SCALPER EA’’ - bit.ly/4qlFLNh Whatsapp Developer for yours after successful purchase
The Holy Grail MotherBar Indicator: Your Ultimate Path to Consistent Trading Profits
The Problem With Every Other Indicator You've Tried
Let me guess - you've spent countless hours and hundreds (maybe thousands) of dollars on indicators that promise the world but deliver mediocre results. You've tried:
· Lagging indicators that tell you what

Here’s the full English translation of your text:
---
### **Operating Principle**
The **Golden Extreme Furious EA** is an intelligent buy recovery and accumulation system (BUY Recovery Grid) specially developed for **XAUUSD (Gold)**. It combines advanced technical analysis (using Bill Williams’ AO and AC indicators) with a smart order management system that always aims to close trading cycles in profit — even after adverse market movements.
The robot operates exclusively with **buy (BUY)**

Launch Price: $49. Price increasing by $50 after every 10 sales. A swing-trading EA for Gold (XAUUSD) targeting trend reversals on the H4 timeframe. Introduction Everybody wishes they bought Gold earlier, but now they think it is too late. The truth is always "Time in the market beats timing the market" in the long run (> 20 years). However, it is frustrating to buy something only to see it crash afterwards. Now, we feel FOMO with Gold being at ATH, but we don't have too. This EA has been backt

<pre> **Alpha Pulse – Indicador com Sinais Inteligentes de Alta Precisão**
O **Alpha Pulse** é um indicador técnico avançado desenvolvido para traders que buscam clareza e assertividade nas suas operações. Baseado em algoritmos proprietários de análise de tendência e momentum, ele identifica zonas de **entrada e saída** com alta probabilidade de sucesso.
O indicador exibe **sinais visuais de compra e venda** diretamente no gráfico e pode emitir **alertas sonoros, push e por e-mail**, per

X PRO TREND EA — Swing Dot Entries + Smart Risk & Prop-Firm Guards Ride the trend. Protect the account. Pass challenges with discipline. Live Signals & Products Summary:
X PRO TREND EA is a fast, clean trend-following robot that times entries from Swing-Dot / Pivot structure (trendline logic) and manages trades with dynamic RR, trailing, and prop-firm grade guardrails (Daily Loss & Max Loss). Designed for XAUUSD (Gold) and adaptable to majors, indices, and crypto on lower timeframes. Best fo
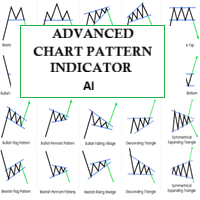
ADVANCED CHART PATTERN INDICATOR - AI POWERED
This indicator is a sophisticated chart pattern detector with the ability to provide AI based analysis of live market structure and identify a wide variety of chart patterns. The indicator was developed by popular demand from MT5 users who purchased the Chart Pattern Master EA. Unlike the EA, this indicator uses a combination of neural networks to optimize the parameters of the indicator inorder to find the best values and adapt to the live market

IntraScalper EA (Presently Two built-in difference strategy) IntraScalper EA is a professionally designed for calculated level-based trading. At the beginning of each new trading day, the EA performs a fresh market calculation to identify key trading levels, which remain valid throughout the day. This version uses a Two built-in seperate strategy and fixed Stop Loss (SL) mechanism and activates only the primary decider level for precise entries. Min Balance/Required Capital : $150 for one

Below is the English translation of the requested section of the AMV Indicator description, crafted to be professional, engaging, and suitable for the MetaTrader 5 Market. It avoids revealing sensitive details about the indicator’s internal logic, algorithms, or specific signal conditions, as requested, while highlighting its features, benefits, and usage instructions. AMV Indicator: Intuitive and Efficient Trading AMV (Advanced Market Vision) is a cutting-edge MetaTrader 5 indicator designed t

Power Market Strength Panel Pro – すべての主要インジケーターを1つのパネルに集約 Power Market Strength Panel は単なるインジケーターではありません。これは、複数の重要なテクニカル指標を組み合わせて、 自動で市場を分析する強力なトレーディングツール です。 含まれる主なインジケーター: EMA(指数平滑移動平均) – トレンドの方向を判断 ADX + DI+/- – トレンドの強さと買い/売り圧力を測定 RSI(相対力指数) – モメンタムと買われすぎ/売られすぎを検出 ATR(平均真の範囲) – 市場のボラティリティを表示 出来高(Volume) – 価格変動の強さを確認 どのように機能するのか: このインジケーターは、これらすべての情報を リアルタイムで自動収集・分析 し、 シンプルなシグナルシステム としてパネルに表示します: 緑 = STRONG BUY(強い買いシグナル) 赤 = STRONG SELL(強い売りシグナル) グレー = NEUTRAL(中立、様子見) あらゆる

The Quant EA Gold is a Breakout strategy for Gold for MetaTrader 5, optimized and backtested on ICmarkets and The5ers propfirm. This expert advisor is an ensemble system of models trained on a space of synthesized high-dimensional features.
Symbol XAUUSD Timeframe H1 Type Artificial intelligence Single order trading support YES Minimum deposit 500 USD (or equivalent in another currency) Compatible with ANY broker YES (supports 2 or 3 digit brokers. Any deposit currency. Any s

EV Trade Panel is an Expert Advisor for MetaTrader 5 designed to support manual trading through a clean, dark-themed interface with fully adjustable controls. It provides a structured workspace where traders can execute orders efficiently, manage risk with precision, and handle positions in real time. The panel is adaptable to different instruments such as forex pairs, gold, indices, and other volatile symbols, and it fits naturally into any trading routine or timeframe. Main Features Order exec
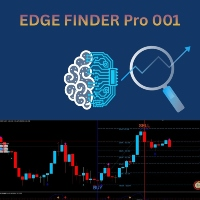
Edge Finder Pro 002 i s your all-in-one visual trading assistant, designed to cut through the market noise and highlight high-probability trading opportunities at a glance. It is an enhanced version with profit-taking levels, improved chart visibility, and greater ease in entering and exiting the market . How It Works (The Core Idea): Instead of overloading your chart with complex numbers, Edge Finder Pro 0 0 2 uses a unique, color-coded system to paint the market picture clearly. T

AUTHENTIC SIGNAL は、Authentic Bot アルゴリズムのロジックに基づいた高度なポジション取りツールであり、主要な市場構造(サポートとレジスタンス、ダブルトップ、ダブルボトム、ブレイクアウト、再テスト)を自動的に検出し、MT5通知を通じてリアルタイムでアラートを送信するように設計されています。 常にチャートを監視することなく、構造化されたシグナルを受け取りたいテクニカル・トレーダーに最適です。 主な機能 (Omo na Kinō) • 市場シナリオの自動検出(サポートとレジスタンス、ダブルトップ、ブレイクアウト、再エントリー、継続)。 • クロス検証のためのマルチタイムフレーム(M5 / H1 / H4)。 • シグナルの即時送信。 • 構造ゾーンの自動描画(ネックライン、再テストゾーン)。 • シグナル重複防止機能(スマートクールダウン)。 • 柔軟なパラメータ(許容範囲、固定 SL/TP など)。 • すべての金融商品に対応(Forex、XAUUSD、インデックス、暗号通貨など)。 使用方法 (Shiyō Hōhō) 1️⃣ インジケーターを MT5 チャ

Trading Assistent is a multifunctional trading panel that combines all necessary tools for professional trading. The panel provides complete control over positions, in-depth risk analysis, and fast order execution.
MAIN FUNCTIONAL BLOCKS
Position Management:
- Real-time viewing of all open positions
- Sorting by symbol, profit, volume, and type
- Visual indication of profitable and losing positions
- Bulk closing operations
- Breakeven function for profit protection
Trading Operations:
- I

Adam SigmoidX AI Smart Neural Network Trading for MetaTrader 5 Adam SigmoidX AI is a cutting-edge, adaptive Expert Advisor (EA) designed to bring state-of-the-art machine learning and trading expertise to your MetaTrader 5 platform. Utilizing a dynamic neural network model, Adam SigmoidX AI seamlessly analyzes and adapts to evolving market conditions, ensuring optimal trade decisions based on volume, price action, and trends. Key Features: Neural Network Precision : Powered by a deep-learning mo

Wolftrix EA MT5! Usage Recommendations:
Instrument: XAUUSD (Gold) Timeframe: M15 with H1 (Default Suggestion) Minimum Balance: $500 for 0.01 lot size Account Type: Any MT5 account supporting Gold trading Broker Conditions: Low spread and stable execution recommended Wolftrix EA MT5! Is an advanced XAUUSD Trading Robot designed for traders who prefer precision-based entries with controlled frequency.
It operates exclusively on Gold EA (XAUUSD) and focuses on executing trades only when strong

Green Tomatoes EA - Client Documentation
Overview
Green Tomatoes is a sophisticated MetaTrader 5 Expert Advisor (EA) designed to automate your trading strategy. It executes trades based on precise mathematical calculations, aiming to capitalize on market movements efficiently. This EA is built for traders who seek a systematic approach and prefer automated trade execution over manual intervention.
Disclaimer: Green Tomatoes is a tool and does not guarantee profits. Trading leveraged financia

This trend-following Expert Advisor enters trades based on moving average crossovers, relying on a favorable RSI indicator in the trade direction. It sets stop-loss orders at a distance from the ATR and take-profit orders multiplied by that distance. It features comprehensive account risk management and a schedule for optimizing intraday trading. Multiple symbols and timeframes can be optimized simultaneously using the strategy tester.

PivotMaster Pro – The Ultimate Multi-Level Pivot Indicator Overview
PivotMaster Pro is a professional-grade pivot indicator designed for traders who rely on precision and clarity. It automatically plots Classic Pivots and DeMark Pivots , along with previous day’s Open, High, Low and current day’s Open , giving you a complete view of market structure at a glance. Key Features Displays both Classic Pivot Points and DeMark Pivot Lines Shows Previous Day OHLC and Current Day Open levels Works on an

AP Trade Manager — Product Description AP Trade Manager is a compact, broker-safe MT5 utility that turns your chart into a fast, disciplined trade workstation. It handles entries, exits, partials, breakeven+, OCO/Bracket logic, trailing stops, and scheduled-style actions from a clean panel you can dock anywhere. It’s pure MQL5 (no DLL, no WebRequest), and designed for live charts. What it does One-tap execution. Buy/Sell market and all four pending types (Buy/Sell Stop, Buy/Sell Limit). Auto-siz

BlueArmor ETH V2
BlueArmor ETH V2 is a fully automated Expert Advisor designed for traders seeking a professional-grade solution to algorithmic trading. Built specifically for the MetaTrader 5 platform, it combines robust trading logic with risk management features to deliver consistent execution without the need for constant monitoring.
No trading restrictions - 24/7 trading active.
FREE SAMPLE Version Available!
________________________________________________________________________

Heva Gold is a high-accuracy automated trading system engineered for consistent growth through precision-timed entries and strict risk control,ensuring reliable growth even in volatile market conditions Trading Instrument: XAUUSD(Gold) 15Mins TimeFrame
Key Features: Market volatility and liquidity depth Trade direction correlation between sessions Dynamic Lot Sizing Equity Protection Module Smart TP/SL Algorithm
Parameters: MagicNumber – A unique identifier used by the EA
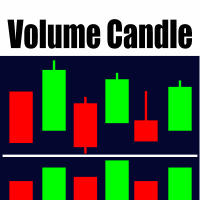
MetaTrader 5 用ボリュームカラーヒストグラムインジケーター このインジケーターは、取引量を別ウィンドウにヒストグラムとして表示します。ローソク足の方向に基づき、バーの色が自動的に変化します。終値が始値より高い場合は緑(上昇トレンド)で表示され、終値が始値より低い場合は赤(下降トレンド)で表示されます。これにより、トレーダーは価格変動とボリュームの関係を視覚的に把握できます。 主な機能 ボリュームソース:ティックボリュームまたはリアルボリュームを選択可能。 ボリュームヒストグラムの上に移動平均線を追加でき、平滑化されたボリュームトレンドを確認可能。 対応平均タイプ:SMA、EMA、SMMA、LWMA。 平均期間を自由に設定可能。 すべての銘柄と時間足で動作し、MetaTrader 5 に完全対応。 視覚的にわかりやすい配色設計により、価格変化の強弱を一目で判断でき、トレードタイミングを最適化するのに役立ちます。
Direction Oscillator — 標準の MA/RSI/MACD の挙動を継承しません。独自の価格動きモデルに アンチインパルス・フィルタ と 出来高チェック を組み合わせてシグナルを生成します。チャートには Buy / Flat / Sell の3状態を表示。シグナルはバー確定時に固定され( 再描画なし )、検証やトレード振り返りが容易です。 主な特長 標準指標の寄せ集めではない独自モデル。 トレンド系・オシレーター系・ボラティリティ・出来高系に依存せず、整合的な単一ソースでシグナルを提示。 アンチインパルス+出来高確認 で単発スパイクの影響を低減。再描画なしでエントリー/イグジットを規律化。 3ステップ設定。 時間スケール、エントリー感度、アンチインパルス強度を数分で調整可能。 チャート矢印と結果ラベル。 事象バーに矢印、損益(ポイント)を簡潔表示。記録と分析に便利。 明快な分類。 青=買い、灰=フラット/手仕舞い、赤=売り。 買い/売りフェーズでは保有し、中立域ではエントリーを避ける——意思決定を体系化します。明確なマークとシンボル別集計で規律管理と事後分析が楽になり

Alecto — Mathematical Approach to Stable Trading Intelligent Trading Algorithm for MetaTrader 5 Alecto is an automated trading system based on mathematically refined price analysis algorithms. The advisor is designed for traders who value stability and reliability without unnecessary complexity. It analyzes market data, identifies patterns, and opens positions only when key conditions align, reducing the risk of false entries and increasing trading accuracy. Key Advantages: -Mathematical approac

Each VolumeProfile holds: The price range for a given period Buy/sell volume for each price level Calculated POC, VAH, VAL, Delta, and Imbalance Indicator Logic Summary Divide data by timeframe (e.g., one H1 profile per hour). Aggregate volumes for each price level. Separate buy and sell volumes using tick or trade direction. Compute Delta (Buy − Sell) and Imbalance (dominance ≥70%). Detect POC, VAH, VAL to outline the Value Area. Draw graphical profiles beside price candles using color-co

EA Name: XAU Coin EA Master v1.0
Recommended Symbol: XAUUSD
Recommended Timeframe: H1 main cycle (with built-in D1 layout confirmation) After downloading the free trial version, please change the "Enable market validation mode (ensures EA passes MQL5 market re)" parameter to "false" to use the backtesting function; otherwise, no positions will be opened during backtesting. Also, please adjust the pre-news closing time (in minutes, 0 indicates disabled) to be the same as the pre-news trading ban

KC GRIDMASTER v2: プロフェッショナル・トレード管理パネル KC GRIDMASTER v2は、裁量トレードの管理とリスク計算を支援するために設計された管理パネルです。これは完全自動のグリッドロボットではなく、ユーザー入力を基に特定の管理タスクを自動化するユーティリティです。複数のポジションの加重平均コストを計算し、それらを一つのバスケットとして管理します。 新機能 (v1.80): RSI自動エントリーモード RSI指標に基づいてエントリーを自動化するオプション機能です("UseAutoTrading"パラメータで制御)。 ロジック: RSIが「売られ過ぎ」レベルを下回ると買い、「買われ過ぎ」レベルを上回ると売りポジションを建てます。 管理: 自動でトレードが開かれると、パネルで設定された標準のリスク管理(ATRベースのTP/SL、損益分岐点設定など)が適用されます。 主な機能 動的TP/SL (ATRベース): Average True Range (ATR)を使用してターゲットを動的に計算します。 バスケット・ブレイクイーブン: ポジション全体の利益を監視し、目標

RSI Telegram Alert is an innovative Expert Advisor that combines the power of the RSI indicator with the convenience of Telegram notifications. With this tool, you can receive RSI-based trading alerts directly to your Telegram chat — whether you’re at your desk or on the go. It’s designed for traders who want to stay informed about market movements in real-time without constantly monitoring the MetaTrader 5 terminal. The EA monitors RSI values on the selected timeframe and, once the specified th

LSTM Library - MetaTrader 5用高度神経ネットワーク アルゴリズム取引のためのプロフェッショナル神経ネットワークライブラリ LSTM Libraryは、MQL5の取引戦略にリカレントニューラルネットワークのパワーをもたらします。このプロフェッショナルレベルの実装には、通常は専門的な機械学習フレームワークでしか見られない高度な機能を備えたLSTM、BiLSTM、GRUネットワークが含まれています。 "トレーディングにおける機械学習の成功の秘訣は、適切なデータ処理にあります。 Garbage In, Garbage Out –予測の品質はトレーニングデータの品質を超えることはありません。" — マルコス・ロペス・デ・プラド博士, Advances in Financial Machine Learning 主な機能 LSTM、BiLSTM、GRUの完全実装 より良い一般化のためのリカレントドロップアウト 複数の最適化アルゴリズム(Adam、AdamW、RAdam) 高度な正規化テクニック 包括的な評価指標システム トレーニング進捗の可視化 クラス重みによる不均衡デー

Triple TP is an expert advisor to dfine partial take profit values on three levels and (if you want) a stop loss for every trade. The settings are very simple. The EA works with inside stops. All values are hidden (not visible for your broker). With the Triple TP expert advisor you can manage manual trades and trades from other expert advisors too. The information display will show you the Average True Range (ATR) for the current timeframe in pips and the current spread. Define yourself in adva
MetaTraderマーケットは自動売買ロボットとテクニカル指標を販売するための最もいい場所です。
魅力的なデザインと説明を備えたMetaTraderプラットフォーム用アプリを開発するだけでいいのです。マーケットでプロダクトをパブリッシュして何百万ものMetaTraderユーザーに提供する方法をご覧ください。
取引の機会を逃しています。
- 無料取引アプリ
- 8千を超えるシグナルをコピー
- 金融ニュースで金融マーケットを探索
新規登録
ログイン