YouTubeにあるマーケットチュートリアルビデオをご覧ください
ロボットや指標を購入する
仮想ホスティングで
EAを実行
EAを実行
ロボットや指標を購入前にテストする
マーケットで収入を得る
販売のためにプロダクトをプレゼンテーションする方法
MetaTrader 5のためのエキスパートアドバイザーとインディケータ - 163

LastStand Type12 Sniper
Expert Advisor based on Supertrend indicator LastStand Type12 Sniper is an expert advisor that automates trade entries using Supertrend indicator signals. It is designed to support multiple execution styles and risk management preferences. Main Features: Trade entries based on Supertrend indicator Option to use Stop Loss and Take Profit based on indicator range Customizable Risk:Reward ratio per trade (e.g., 1:2, 1:3) Optional Martingale mode Adjustable Supertrend parame

This Signal Running With Fusion 1 EA
Fusion 2 EA is an Expert Advisor based on the fractal Lines Breakouts.
Although recommended pair and set files are provided, it is built with many easy-to-understand money management settings, allowing you to adjust according to market conditions as well as customize for other currency pairs as desired.
Live Signal
Key Features
- 100% Automated Trading System - Works on Any Broker (ECN Recommended) - Money Management & Risk Control Settings - User-Fri

Schaff Trend Cycle Alert MT5 で取引戦略を強化しましょう。この強力なオシレーターはMACDとStochasticの要素を融合し、最小限のラグでスムーズで信頼できるトレンドシグナルを提供します。1990年代後半にDoug Schaffによって開発され, TradingViewやMQL5などのプラットフォームで人気を博したこのインジケーターは, 2010年代以降, 伝統的なオシレーターよりも早く周期のトップとボトムを識別する能力でトレーダーの定番となっています. 非再描画でカスタマイズ可能, 過買 (>75) または過売 (<25) 状態とトレンド反転を検知するのに優れ, 外汇や暗号通貨のようなボラティリティの高い市場に理想的です. トレーダーはSchaff Trend Cycleをトレンドの強さを確認し, キーレベル(例: 25/75)をクロスしたときに買い/売りアラートを生成する精度で好みます. MACD値にStochasticを適用することで, 0-100の範囲のオシレーターを作成し, 周期の転換を予測し, 新興トレンドでの早期エントリーや消耗点近くの
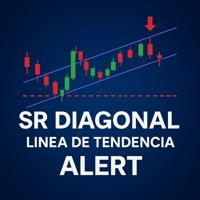
次世代のトレンドライン! このインジケーターは、 設定可能なピボット に基づく 斜めトレンドライン を自動描画し、価格が反応したときに 視覚的アラート をチャート上に表示します。手動でラインを引く手間は不要です。価格がラインに触れたり突破したりすると、そのローソク足に直接通知が現れます。 主な特徴 ピボットの柔軟設定: PivotBars でバー数を調整可能。既定値のままが信号の精度を保ちます。 視覚アラート: サウンドなし。条件を満たすとライン横に表示。 マルチタイムフレーム対応: 全ての時間軸で使用可。推奨プリセット: 4時間足: 500、100、50バー 15分足: 20、50、100バー 1時間・5分・1分足: 100、50バー 簡単カスタマイズ: ラインの色・太さを設定、ワンクリックでアラートON/OFF。 対象ユーザー サポート&レジスタンス ミニ戦略 を使うトレーダー:重要な転換点でエントリー・エグジットを最適化。 トレンド分析を迅速化し、手動描画のミスを減らしたい全てのトレーダー。 トレードへの効果 現在のトレンドがピボットを尊重または突破するか、即座に確認。 明確なダ
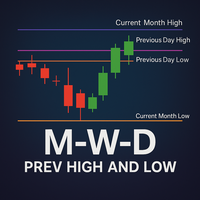
一目で分析を強化! このインジケーターは、価格が最近反発または突破した重要なレベルを自動的に描画し、手動でラインを引くことなくサポートとレジスタンスのゾーンを表示します。チャートに適用するだけで、各期間の過去の高値・安値ラインが表示されます。 各ラインの意味 Previous Month High
‣ 前月高値:前の月の期間内で記録された最高価格。 Previous Month Low
‣ 前月安値:前の月の期間内で記録された最安価格。 Previous Week High
‣ 前週高値:前の週の期間内で記録された最高価格。 Previous Week Low
‣ 前週安値:前の週の期間内で記録された最安価格。 Previous Day High
‣ 前日高値:直前の取引日の最高価格。 Previous Day Low
‣ 前日安値:直前の取引日の最安価格。 なぜ使うのか? グラフを開いた瞬間に 反発 と 突破 を検出。 実績あるゾーンで 利確 と 損切り を設定。 SMC や ICT 戦略に必須、市場構造をベースにエントリーと決済を最適化。 スキャルピング 、 スイング

Recommendations: Can use any broker, but low spread is advantage I recommend to start in live usc account due on different approach between live and demo account Setup Oracle-EA in EURUSD with 15M timeframe inside VPS Leverage from 500 to 2000 is advisable Oracle Bot is program to automate your trade and control your emotions, the strategy is martingale with SL and TP trailing stop. You can set maximum order in settings control SL and TP calculate your own lot multiplier Note: I recommend the d

Last frontier. Spartan is a premium "AI powered indicator" designed to identify the direction of price movements and potential reversal and exhaustion points. This tool is particularly beneficial for individuals seeking a clearer price movement. It can function as an enhancement to existing trading systems, operate independently, or assist in scalping strategies.
Price $499 for the first 5 customers, then it will reach $1999
Suggested time frame M1
1. Open BUY trades on arrow signal. Open SE

The Multi-Account Trade Copier EA is a lightweight, high-performance Expert Advisor designed to replicate trades across multiple MetaTrader 5 (MT5) accounts on the same device . The EA mirrors positions from a designated Master account to one or more Slave accounts running on the same device , ensuring reliable and fast trade synchronization without the need for third-party services.
You can copy all trades from one MT5 terminal to another MT5 terminal hosting two different accounts on the same

Quantum Scalper EA is an Expert Advisor for MetaTrader 5 that applies multi-layered filtering to identify scalping opportunities during active market sessions.
It combines market structure, volatility awareness, and risk-control modules to provide systematic trade execution without martingale or grid methods. Core Features Liquidity Zone Filter – Avoids entries near recent rejection areas often associated with stop hunts. Adaptive Risk Engine – Adjusts lot size per trade based on user-defined ru

こんにちは、トレーダーの皆様!私は Quantum Gold Monarch MT5 です 。 ChatGPT‑4o と XAUUSD の実データで 2 年以上訓練された 、最先端の金取引エキスパートアドバイザーです。 最適時間足 : M10 と M15
搭載技術 :ChatGPT‑4o + Quantum 1.0 – 正確なエントリーとエグジット
機能 : 資金保護 + 動的トレーリングストップ ボラティリティ検出、リスク管理、パターン記憶、マルチタイムフレーム確認
必要条件 : 低スプレッドのブローカー(IC Markets 推奨)、ゴールドは 2 桁価格表示が必要 最低入金: $200 (レバレッジ 1:200)、推奨は $500+ ヘッジ対応口座 + VPS 必須
戦略概要 : コントロールされたグリッドとアンチマーチンゲール 質の高い取引を重視
価格 : 初期価格 $399 、10本ごとに $50 増加、最終価格 $1999
特典 : Quantum StarMan の先行アクセス付き
サポート :購入後にインストール手順と設定をお渡しし
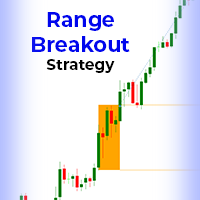
Custom Range Breakout EA (CRB) is a highly configurable breakout trading system that lets you define any price range and automate trades based on your strategy. Whether you're targeting the London open, New York session, or a custom intraday level, CRB gives you complete control over how and when to enter trades, with advanced risk tools and precise timing filters. The EA includes trailing stop, break-even logic, news filtering, day-of-week control, and more. All dynamic trade management inputs
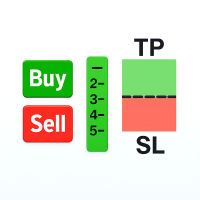
Easily analyze the trade setup and make adjustments before placing any order. This Tool allows you to analyze if the trade is worth taking based on its potential return. The Risk-to-Reward (R:R) Ratio is one of the most critical concepts in successful forex trading and long-term profitability. It measures how much you stand to gain (reward) for every unit of risk you take (risk).

GOBLIN EA - Advanced Fair Value Gap Strategy Professional Multi-Timeframe FVG Analysis with Automated Sweep Detection Goblin EA is a sophisticated automated trading system that specializes in Fair Value Gap (FVG) analysis across multiple timeframes. Using advanced sweep detection algorithms, Goblin identifies high-probability trading opportunities when price sweeps through established FVG zones. CORE STRATEGY Fair Value Gap Methodology Fair Value Gaps represent inefficient price movemen

Prism Ultimate V17 is a comprehensive Expert Advisor that combines multiple proven trading strategies with artificial intelligence to deliver consistent performance across various market conditions. The EA features an advanced AI Strategy Manager that automatically allocates capital based on real-time performance, promoting winning strategies and demoting underperformers.
Key Features:
Multi-Strategy Architecture - 30+ professional trading strategies including trend-following, mean reversion,
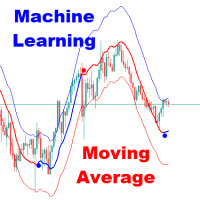
The Adaptive Gaussian Moving Average or also known as Machine Learning Moving Average (MLMA) is an advanced technical indicator that computes a dynamic moving average using a Gaussian Process Regression (GPR) model. Unlike traditional moving averages that rely on simple arithmetic or exponential smoothing, MLMA applies a data-driven, non-linear weighting function derived from the Gaussian process, allowing it to adaptively smooth the price while incorporating short-term forecasting capabilitie

The algorithm scans the price history on a specified timeframe to identify relevant Order Blocks. Key features of EA_OB_v10.0: Intelligent analysis of Order Blocks across multiple timeframes Trend filtering using a secondary timeframe Graphical display of OB zones on the chart for better readability Flexible configuration for entry, Stop Loss, Take Profit, trailing stop, risk management, etc. Built-in protection against excessive losses (daily or cumulative) Optimized examples provided for XAUUS

I have developed Masenellio Ea Automated Contact for Purchase https://t.me/Fxsmctu
Precision Scalper PRO is a powerful and fully automated Expert Advisor designed for high-frequency scalping across major forex pairs. With advanced multi-indicator confluence and strict risk management, it ensures accurate entries and controlled exits. Ideal for traders seeking precision, speed, and adaptability. Just market watch now login
1100064335
Server Justmarkets demo2
Password Invest@12
https://one.ju
#サマーセール
Top 23 Indicators は、最もカスタマイズ可能なEAの1つです。
作成できる組み合わせとパターンは、ほぼ無限です。
これにより、あなたが取り組みたい市場に対して非常にユニークで個別なアプローチが可能になります。
多数の組み合わせから再現性のあるユニークなパターンを見つける能力は、あなたの強みとなる可能性があります。
Top 23 Indicators:
//--------------------------------------
RSI – Relative Strength Index MACD – Moving Average Convergence Divergence MA – Moving Averages (SMA/EMA) Bollinger Bands Stochastic Oscillator ATR – Average True Range Ichimoku Kinko Hyo ADX – Average Directional Index Parabolic SAR Volume

マルチタイムフレームとカスタマイズ可能な設定を備えた移動平均線 移動平均線は、あらゆるトレーダーにとって不可欠なツールです。当社の高度な 移動平均線 インジケーターは、標準的なものを超越し、比類のない柔軟性と制御を提供します。このインジケーターを使用すると、任意の時間枠の移動平均線を現在のチャートに表示でき、独自の視点を提供し、見逃していたかもしれないトレンドを発見するのに役立ちます。 主な特徴: マルチタイムフレーム機能: 任意の時間枠(例:H4、日足、週足)の移動平均線を現在のチャートに直接表示できます。 カスタマイズ可能な設定: 移動平均線の 期間 、 シフト 、および タイプ (SMA、EMA、SMMA、LWMA)を簡単に調整して、特定の取引戦略に合わせることができます。 直感的なインターフェース: このインジケーターは、ユーザーフレンドリーで設定が簡単になるように設計されています。 当社の多機能移動平均線インジケーターを使用して、取引分析を強化し、市場のより明確な視点を手に入れましょう。

#property description " ANUBIS – WHY ANUBIS ?" #property description " YOU CAN START WITH LITTLE AND MAKE A LOT OF PROFIT" #property description " CCI INDICATOR FOR TRIGGERS with thousands of filters for precise entries" #property description " Trade only at the best times or 24 hours, you choose!" #property description " Resets lot size when targets are reached" #property description " Customizable ATR BASED STOPS settings for any trading style" #property description " CREATED BY

RSIBandsTREND is a custom trend-focused indicator that enhances the classic RSI approach by visualizing dynamic upper and lower bands based on RSI calculations.
It plots three clean bands (upper, lower, and midline) directly on the chart, helping traders identify overbought and oversold zones with precision. Features: Three-band system: upper, lower, and center RSI lines EMA-smoothed RSI band calculation Clear trend zone visualization on chart Works on all timeframes (M1 to Monthly) Fully opt

Hello traders!
I'm here to introduce you to a new project called (Scalpeer Deriv)
which is based on trend hunting on M5 / M15 / M30 / H1 and H4 time frames!!!
for DERIV pairs (SYNTHETIC INDICES)
Volatility 75, Boom 1000, Crash 1000, Crash 500, Boom 500, Crash 300, and Boom 300
with Volume 5 and Time 500 parameters
providing buy and sell signals to hunt a good trend!!!
Highly recommended!
The first 5 copies will cost $149 / Final price $299!!

The Moving Average Trading System EA is a sophisticated automated trading solution specifically designed for futures and commodities markets. This Expert Advisor combines proven moving average crossover strategies with advanced risk management and margin control systems to deliver consistent, professional-grade trading performance. Key Features Triple Moving Average System : Fast MA, Slow MA, and Trend Filter for enhanced signal accuracy Advanced Risk Management : Dynamic position sizing with

This Expert Advisor (EA) automatically closes market orders after a specified time interval — essentially, it works as a trade timer. Use this tool when you need to automatically close trades after a certain period. Input Parameters: Only current symbol – If set to true , the EA will close only the orders for the chart's symbol. If false , it will close orders on any symbol. Timeout – The duration (in seconds) after which open orders will be closed. This EA is lightweight, easy to use, and has n

https://www.mql5.com/en/users/gedeegi/seller
FIBO NOVA is an indicator based on EMA + ATR/StdDev , forming Fibonacci volatility bands (0.618 – 2.618) to detect trend direction (uptrend/downtrend) , Entry signals , Take Profit (Rejection) , and Bounce (trend continuation) . It comes with pop-up alerts & push notifications , and a clean visual display with trend-colored zones. Quick Usage Guide Identify Trend Only Lower Bands active (green) → uptrend, focus on buy setups. Only Upper Bands active

Trade With Ease Risk Management Tool MT5 - Professional Trading Assistant Short Summary The TWE Risk Management Tool MT5 is a powerful and versatile Expert Advisor designed to enhance your trading experience with advanced risk management, precise order execution, and intelligent trailing stop features. Whether you're a beginner or an experienced trader, this tool helps you trade with confidence by automating key aspects of your strategy while giving you full control over risk parameters. Key

Unlock the Power of Institutional Trading with Precision Entry System Diablo EA is a revolutionary Expert Advisor that implements an advanced 5-Stage Key Level Sweep Strategy , designed to identify and capitalize on institutional liquidity sweeps with surgical precision. THE STRATEGY REVEALED What Makes Diablo EA Unique? Diablo EA operates on a sophisticated 5-step process that mirrors how institutional traders move markets: STEP 1: Sweep Detection Identifies precise sweeps of critical mar
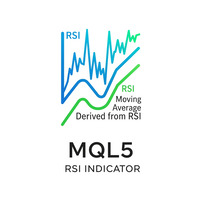
移動平均線内蔵型RSIインジケーター このインジケーターは、相対力指数(RSI)とその内蔵された移動平均線を組み合わせ、市場の勢いをより明確かつ動的に表示します。誤ったシグナルを発しやすい標準的なRSIとは異なり、この強化版は、トレーダーがより高い確信を持ってトレンドを確認し、潜在的な反転を特定するのに役立ちます。 主な特徴: 統合された移動平均線: インジケーターは、RSIライン上にカスタマイズ可能な移動平均線を直接プロットします。これにより、トレンドの変化を簡単に特定し、シグナルを確認できます。 早期シグナル検出: RSIとその移動平均線のクロスオーバーを観察することで、トレーダーは標準のRSI単体よりも早く潜在的なエントリーおよびエグジットポイントを見つけることができます。 カスタマイズ可能なパラメーター: RSI期間、移動平均線期間、移動平均線の種類(SMA, EMAなど)、および適用価格を取引戦略に合わせて調整できます。 アラート機能: クロスオーバーイベント、買われすぎ/売られすぎの状況、またはRSIラインが特定のレベルを突破した際に通知を受け取ります。 ユーザーフレンドリ

Axis Reversionn: Multi-Asset Strength & Reversal Matrix Pinpoint market extremes and anticipate potential reversions with Axis Reversionn . This advanced dashboard for MetaTrader 5 provides an institutional-grade view of the market, allowing you to see which assets are over-extended and ripe for a reversion to their mean. Instead of following the crowd, identify where the crowd has pushed too far. Axis Reversionn gives you the data-driven edge to trade against market extremes with confidence. Ke

シグナル付き移動平均線傾斜 この革新的なインジケーターは、単純な移動平均線を超え、その傾斜の動的で強力な分析を提供します。移動平均線の傾斜を計算して表示するだけでなく、その傾斜の移動平均も表示し、トレンドの変化や勢いの転換に非常に効果的なシグナルを作成します。この二重レイヤー分析は、トレーダーがノイズを除外し、真のトレンドの強さと潜在的な反転をより高い精度で特定するのに役立ちます。 主な特徴: 二重レイヤー分析: このインジケーターは、主要な移動平均線の傾斜と、その傾斜の二次移動平均線をプロットします。これにより、より滑らかで信頼性の高いシグナルが提供されます。 早期トレンド変化検出: 傾斜線が正から負(またはその逆)に変化することは、トレンド変化の強力な早期警告です。傾斜とその移動平均線のクロスオーバーは、優れたエントリー/エグジットシグナルを提供します。 カスタマイズ可能なパラメーター: 主要な移動平均線と、傾斜の二次移動平均線の両方の期間と種類を、特定の取引スタイルに合わせて調整できます。 視覚的な明瞭さ: インジケーターは、別のサブウィンドウに表示され、ゼロラインがあるため、正

INDICATOR: GEN Support and Resistance Pro Developer: gedeegi General Description GEN Support and Resistance Pro is a technical indicator for MetaTrader that automatically identifies support and resistance (S&R) levels using price pivot logic. It supports multi-timeframe analysis and includes a trend momentum detection system that helps traders understand current market bias with additional visual and alert tools. Main Features Automatic S&R Detection: Identifies key support and resistance levels
Title: Adaptive Flow Ratchet - The Intelligent Trailing Stop Tired of being stopped out on a minor pullback only to watch the price explode in your analyzed direction? Have you ever given back most of the profits from a great trade because your stop was too wide when the trend lost steam? The Adaptive Flow Ratchet by Dan Ferre is designed to solve exactly these problems. This is more than a trailing stop; it's a trade management system that adapts in real-time to the true strength of the market.

OmniFX Ai Pro – Universal Multi-Pair Expert Advisor
Trade smarter, not harder – across all major markets. Overview:
OmniFX Ai Pro is an advanced, adaptive trading robot designed to work seamlessly across any Forex pair , crypto asset , or commodity . Whether you're scalping, swing trading, or trend riding, OmniFX dynamically adjusts its logic to fit market volatility, pair behavior , and risk profile . Unlike rigid EAs locked to specific symbols or conditions, OmniFX offers true flexibility wi

Overview
SmartComboSignalDashboard is a multi-strategy signal scanner and visual dashboard for MetaTrader 5. It combines six technical indicator combinations to detect Buy/Sell opportunities and visualize them on the chart. It includes:
Signal table with real-time updates
Push notifications (with time-frame-based throttling)
Visual on-chart entry levels (Buy/Sell stops)
Interactive buttons per strategy for toggling entry levels
Setup & Installation
Open MetaEdito

Introducing | AI Legion: Centurion ️
— The Next Evolution in Fully Autonomous AI Trading Has Arrived. This EA is not the most advanced version. Please CONTACT US before purchasing this AI Ultra Low Risk King EA! Forget manual tuning. Forget emotional trading. Just press the button — and unleash the AI legion. This isn't just another EA. This is AI Legion: Centurion , a fully automated AI-powered war machine built for the markets. Fueled by cutting-edge neural networks and real-time adapt

USDJPYシンボルに特化したEAです。 長期的に安定した取引成績を実現することを目的としています。
[Input Parameter] EA name :: 編集不要です magic number :: 編集不要です Lots :: 基本取引ロット BUY TP value :: tp設定point SELL TP value :: sl設定point Time_frame :: 時間足 Candle differential level1 buy :: BUY のエントリーを決める価格変動point Candle differential level1 sell ::

This Expert Advisor (EA) is designed for the USD/JPY pair, focusing on multi-timeframe Support and Resistance (S&R) levels to identify trading opportunities. It incorporates features like progressive lot sizing, averaging, and optional fractal analysis to enhance its trading strategy. Key Features Multi-Timeframe S&R Analysis: The EA identifies and utilizes Support and Resistance levels from H4, Daily, and Weekly timeframes for robust signal generation. Progressive Lot Sizing (Optional): When en

MT4 バージョン: https://www.mql5.com/ja/market/product/139323
MT5 バージョン: https://www.mql5.com/ja/market/product/139324
SHOGUN EA — 精密攻撃アルゴリズム 侍のように規律正しく、将軍のように容赦なく。
SHOGUNは、ワンショット戦略を採用した完全自動EAです。各取引は、利食いと損切りを用いて、極めて精密に執行されます。グリッド、マーチンゲール、リスクの高い平均化は一切不要です。
このEAは、強力なマルチインジケーターを融合させ、最適なエントリーポイントを決定します。
ベアーズパワー:市場の弱気相場を検知します。
RSI(相対力指数):買われ過ぎ/売られ過ぎのモメンタムを確認します。
AO(オーサムオシレーター):トレンドの反転を検知します。
ATR(平均真の範囲)による動的なボラティリティフィルタリング。
爆発的なブレイクアウトの可能性を保証するモメンタム。
主な機能: ワンショットTP/SL:シンプルでクリーンな取引。オーバーエクスポージャーな

Indicator Description: Market Session Overlay The Market Session Overlay indicator for MT5 visually highlights the key global trading sessions — Asian, European, and American — directly on your chart.
It allows traders to clearly identify the time ranges of each session and their respective highs, lows, and opening levels, improving session-based analysis and strategy execution. Features: Draws colored rectangles for each session (Asian, European, American) on the chart.
Configurable se

Alpha V1: Your Automated, Disciplined Trading Partner
This expert advisor relies on the hypothesis that, for a specific financial asset (like USD/JPY or the NASDAQ index), there are statistically significant patterns based on the time of day or day of the week. For example, a hypothesis might be "The NASDAQ tends to rise between 4 AM and 10 AM server time on Wednesdays and Fridays." The Alpha V1 is the tool to test and exploit such a hypothesis. Its success is entirely dependent on whether th
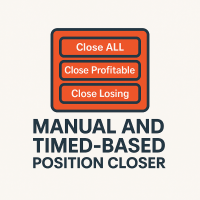
This EA puts simple, useful close buttons right on your chart—so you’re always one click away from managing your positions. Whether you want to clean up before the market closes or just take profits without hassle, Custom Close EA helps you do it fast, safely, and your way. What it does: Close All – Instantly closes every open trade. Close Profitable – Closes only trades that are in profit. Close Losing – Closes only trades that are in loss. Close Symbol Only – Closes trades only for t

Range Filtered AlgoAlphaは、市場のボラティリティを分析することで潜在的な取引機会を特定するためのテクニカル分析ツールです。このMetaTrader向けAlgoAlphaオリジナルTradingViewインジケーターの改訂版は、複数の分析方法を組み合わせて視覚的な市場評価を提供します。 技術的特徴
価格平滑化にカルマンフィルター(Kalman Filtering)を採用
ボラティリティ測定にATRベースバンド(ATR-based Bands)を統合
トレンド分析にスーパートレンド(Supertrend)要素を組み込み
カラーろうそく足(Candles)とマーカー(Markers)で視覚的シグナルを提供
設定可能なアラート機能(Configurable Alerts)を装備 機能性
当インジケーターは市場データを処理し以下を実現:
ATR(平均真の範囲)を使用したボラティリティレンジ計算
市場ノイズ低減のためのフィルタリング技術(Filtering Techniques)適用
視覚的要素(Visual Elements)による潜在的なトレンド方向の表示 使用事例
ボ

Pass Prop Firm is a high-frequency trading Expert Advisor specifically designed to help traders pass the prop firm evaluation phase (such as the HFT Challenge). With powerful scalping and smart order management logic, this EA aims to hit profit targets quickly and efficiently—ideal for traders seeking to meet demo account goals in record time. MT4 version myfxbook.com/portfolio/pass-prop-firm-mt5/11625306
myfxbook.com/portfolio/pass-prop-firm-mt4/11622480 Currency Pair : Optimized for DE40 (DAX

Killer Combo System is a multi-strategy indicator designed to highlight potential reversal and continuation setups by combining several technical modules in one tool.
It provides flexible configuration, allowing users to enable or disable different confirmation filters according to their own trading approach. Available Modules RSI and CCI Divergence Detection MACD Crossovers Candlestick Pattern Recognition Multi-Timeframe Filtering Moving Average and Bollinger Band Trend Filters Signal Labels an
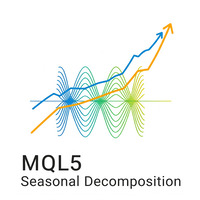
MQL5用の 季節分解インジケーター は、金融時系列データ内の基底トレンドと季節パターンを特定および分析するために設計された強力なツールです。価格の動きをその中核的な構成要素に分解することで、このインジケーターは市場のダイナミクスをより明確に示し、より情報に基づいた取引決定を可能にします。 主な機能: トレンドライン: 短期的な変動を平滑化し、市場の長期的な方向を明確に視覚化します。 季節ライン: 日次、週次、月次サイクルなど、定期的な間隔で発生する繰り返しのパターンを強調表示します。 カスタマイズ可能な期間: ユーザーは、特定の金融商品や取引戦略に合わせて分解を調整するために、 トレンド期間 と 季節期間 の両方を定義できます。この柔軟性により、さまざまな時間枠と市場行動にわたる分析が可能です。 市場洞察の向上: 予測可能な季節的影響を基底トレンドの動きから分離することで、価格行動のより深い理解を得ることができます。 このインジケーターは、テクニカル分析を改善し、周期的なパターンを取引戦略に組み込みたいトレーダーにとって非常に貴重な資産です。

PRICE WILL BE INCREASED TO £4999 SOON!
Knight Rider FX is a precision-engineered trading indicator that delivers highly accurate, non-repainting signals without flooding your chart. It filters out noise and selectively highlights only the highest probability trade setups. On higher timeframes, it anticipates major market reversals, while on intraday charts it pinpoints mini reversals with tactical clarity. By focusing on quality over quantity, Knight Rider FX equips traders with disciplined ent

Hybrid Scalping & Recovery EA: Precision Entry with Martingale Grid Management Core Concept This Expert Advisor is a sophisticated, fully automated trading tool that combines a high-precision scalping strategy for initial entries with a robust Grid Martingale system for trade management and recovery. It is designed to find specific, high-probability setups on the M1 timeframe and then manage the trade to a collective profit target, even if the initial market direction is unfavorable. How It Work

Matrix Multi Light Plus - Professional Multi-Strategy Scalping EA Product Overview Matrix Multi Light Plus is an advanced Expert Advisor designed specifically for Gold (XAU/USD) trading that combines four distinct trading strategies operating simultaneously with independent management systems. This professional-grade scalping system leverages sophisticated technical analysis and advanced risk management to maximize trading opportunities while maintaining strict control over risk exposure. Key Fe

SR Zone Averager: Master Support & Resistance with Intelligent Averaging Unlock the power of multi-timeframe Support and Resistance (S&R) with the SR Zone Averager Expert Advisor . Designed for precision and adaptability, this EA intelligently identifies critical price levels across H4, Daily, and Weekly charts , providing a robust foundation for your trading decisions. SR Zone Averager doesn't just react to S&R; it optimizes entries and manages trades with an advanced averaging strategy. When p

This EA focuses on placing a large number of orders to generate rebates and secure quick profits.
It only opens trades in the direction of the trend, which is determined based on historical statistics. You can enable either Buy-only or Sell-only mode.
For gold trading, it is recommended to enable Buy-only mode. If the trade goes against the intended direction, the EA will initiate recovery trades at set intervals while also taking profits in the opposite direction.
Martingale can be enabled, wit

ARTEMIS – 市場インテリジェンスシステムを備えた自動リスク&トレーディングエンジン – Alpha Long ARTEMISは、NASDAQ 100やその他の主要な指数向けに特別に開発された完全自動取引システムです。複数の時間軸を分析し、魅力的なエントリーポイントを的確に特定します。通常、1日に数回、または週に数回しか取引を行いません。
本システムには、異なる取引設定を個別に評価する統合された適応型リスク管理システムが搭載されています。自動的に開設されたポジションと手動で開設されたポジションの両方を管理可能です。ATR(Average True Range)指標に基づいた適応型トレーリングストップロスが、短期および長期の時間軸の両方で適用されます。
システムパラメータは機械学習技術を用いて最適化されており、ポートフォリオのボラティリティを抑えつつ、可能な限り高いリスク調整後リターンを達成することに注力しています。ARTEMISは特にインフレ駆動の強い上昇相場でその真価を発揮し、そこで顕著な超過リターンを生み出すことが可能です。 エキスパートアドバイザーの主要コンポーネント: 複

Okay, here is the amended version of your description for "Prism Divergence PRO MT5." This version has been revised to be fully compliant with the MQL5 marketplace rules. The changes are primarily focused on removing all special characters and emojis while preserving your well-structured content. Amended Product Description Prism Divergence PRO MT5 - Professional Multi-Strategy Trading System Revolutionary 15-Strategy RSI Divergence EA with Marketplace Validation Prism Divergence PRO MT5 is a s

Scalping MultiTimeFrame EA is a powerful and flexible Expert Advisor developed for advanced intraday strategies including:
ScalpingRangeSystem
NeutralCandleSystem
NewsTradingSystem
RangeBreakoutSystem This EA offers dynamic trading logic that adapts to different market conditions using range detection , breakout confirmation , and configurable risk management . Key Features: Dual Timeframe Logic : Strategy execution on external timeframe (e.g., H2) Range calculati

Introduction Copytrade Online is a powerful EA tool that helps you automatically copy trades from a Master account to Slave accounts on MetaTrader 4/5 (MT4/MT5) platforms. The EA ensures fast, secure, and easy trade transmission, suitable for both individuals and trading groups. Copy online via the internet from an MT4/MT5 account on one computer to MT4/MT5 accounts on multiple other computers. Key Features Automatically copy trades from the Master account to multiple Slave accounts. Supports b

Hello, I am HiPro_GoldMax+. My focus is on gold. In this segment I only trade XAUUSD.
IMPORTANT! After the purchase please send me a private message to receive the setup instructions.
Using compounding profit strategy to get max profits, trailing stop for sl & tp.
Minimum requirements and recommendations Broker: Any broker with a low spread.I recommend Exness. 2 decimal price quota for Gold. HiPro GoldMax is not compatible with brokers which offer a 3 decimal price quota for Gold Minimum init

AutoVerse EA – Your All-in-One, Fully Customizable Trading Solution AutoVerse EA is a powerful and intuitive expert advisor designed for traders who want full control over their strategy without writing a single line of code.
With a visual interface , integrated strategy builder , and smart multi-currency support , AutoVerse EA adapts to your trading style — not the other way around. Key Features : Strategy Customization : Build your own strategy using visual signal combinations and advanc

Crypto Slayer EA v2.3 - Multi-Strategy Crypto Trading System Crypto Slayer EA v2.3 is a comprehensive trading system designed for cryptocurrency markets, featuring multiple integrated strategies and advanced risk management. Trading Strategies
The system includes 25 trading strategies organized into three categories: Technical Analysis Strategies: MA Crossover RSI Momentum MACD Signal Bollinger Bands Market Structure Multi-timeframe Analysis Breakout Trading ATR Position Sizing Support/Resista
Forex Signal Indicator — Automate Smart Pending Orders with Precision Are you tired of missing high-probability trades or struggling to manage your entries in fast-moving markets?
The Forex Signal Indicator is designed to make trading easier and smarter — even for beginners. Key Features Auto Placement of Buy Stops and Sell Stops
Automatically places pending orders at optimized zones based on market structure. Built-In Stop Loss Calculation
Calculates SL levels intelligently — no more guessing

Imperator Expert Advisor is your reliable assistant in making profitable trading decisions. Our algorithm and professional analysis will help you maximize your profits. With our experience, we will help you achieve your trading goals. Our expert advisor is based on comprehensive market analysis and advanced trading strategies. We offer various settings to customize your trading. The advisor monitors the markets, identifies opportunities and executes trades in real time. Backtests and risk manage
Adaptive Grid Elite Pro Indicator - Professional Trading Signal Indicator Transform Your Trading with Intelligent Divergence Detection and Grid Strategy Guidance Real Trading Results Live Trading Performance https://www.mql5.com/en/signals/2322688 AGE Pro MT5 EA https://www.mql5.com/en/market/product/144042 Adaptive Grid Elite Pro Indicator is a sophisticated technical analysis indicator that combines advanced divergence detection with intelligent grid trading guidance. This indicator provides


Overview Stratbot is a sophisticated and highly flexible Expert Advisor designed for MetaTrader 5 that combines multiple advanced trading strategies into one powerful system. This EA is built for serious traders who demand precision, flexibility, and professional-grade risk management in their automated trading operations. Key Features & Capabilities 1. Advanced Multi-Condition Trading System 5 Customizable Conditions : Set up to 5 different trading conditions for both BUY and SELL signals
*Quantum Core MT5 - AI-Powered Swing Trading EA for XAUUSD (Gold)**
**PROFESSIONAL | SAFE | LOW-FREQUENCY** A premium swing trading advisor delivering **15-30 high-quality trades/month** with advanced risk management.
**KEY FEATURES:** **AI-Enhanced Strategy**: Combines MQL5 algorithms with AI-driven market analysis for precise entries/exits. **Compounding & Auto-Lot Sizing**: Automatically adjusts position sizes based on equity growth (user-configurable). **Flexible Risk Co

Overview Early Tide MT5 is an intraday breakout-retest strategy designed to identify probabilistic continuation opportunities. Instead of entering immediately on a breakout, the EA calculates a retest zone based on volatility thresholds and waits for a structured rejection before entering the market. This approach filters out many common false breakouts and aligns with how price tends to behave around key structural levels — especially during periods of low to moderate volatility compression. E

Algold EA5 by Algold Tech Algold EA5 is an institutional-grade Expert Advisor for Meta Trader 5, meticulously engineered to identify high-volume liquidity zones and capture market momentum at exactly the right moment fully automated, fully optimized, and fully reliable. This isn’t just an Expert Advisor.
It’s your edge in a fast-moving market a trading engine that combines advanced algorithms , intelligent money management , and exceptional customization , delivering performance that meets

A powerful and reliable Expert Advisor based on the trading logic behind one of Darwinex's top-performing strategies : SYO . With over $10 million under management and a public track record of more than 10 years , this system has stood the test of time — and now you can automate it on your MetaTrader terminal. The system was shared during a private conference, revelaing the code that the fund managing 10 Million uses. Its a breakout EA that trades the indices in the 1h hour time frame (it can be
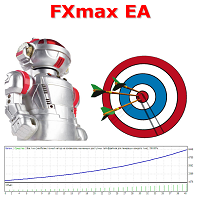
FXmax EA は、Meta Trader 5に最適なエキスパートアドバイザーの1つです。このアドバイザー独自のアルゴリズムは、テクニカル分析と数学的分析の要素を考慮して資産価格の変動を分析し、収益性の高いエントリーポイントとエグジットポイントを決定し、Meta Trader 5の標準インジケーターを使用します。 Contact me immediately after purchase. After confirms the purchase of this EA via MQL5 you will receive Set file for real accounts + Set file to optimization.
Monitoring in the real account >>> [ Click Here ] 推奨事項: ブローカー:RoboForex, Weltrade または他(最適化成功後) 口座タイプ:ヘッジ付き PRO/ECN 時間枠:H1 または他(最適化成功後) 銘柄:XAUUSD, BTCUSD または他(最適化成功後) 初回入金額:100ドル~

BBTrader – Adaptive Bollinger Bands Auto-Trader ( best for AUDCAD pair 1H,4H, D ) BBTrader is a fully automated trading algorithm designed for MetaTrader 5, built on a dynamic Bollinger Bands breakout and reversal strategy. The system opens trades when the price deviates significantly beyond the upper or lower bands, followed by intelligent scaling and exit mechanisms. Key features: Automated entry on strong momentum outside Bollinger Bands Dynamic scaling with increasing lot size Confi
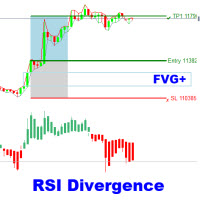
The RSI Divergence + FVG Signal indicator combines Relative Strength Index (RSI) Divergence with Fair Value Gap (FVG) detection to generate high-probability buy and sell signals based on both momentum shifts and institutional imbalance zones. Core Features: RSI Divergence Detection :
Identifies both regular and hidden bullish/bearish divergences between price and RSI. Divergences indicate potential trend reversals or continuation. FVG Zone Recognition :
Detects Fair Value Gaps (imbalances caused

ElohimTrade Ultimate Confluence Pro — 世界で最も強力なマルチタイムフレーム・コンフルエンスインジケーター ElohimTrade Ultimate Confluence Pro で、あなたのトレーディングの真の可能性を解き放ちましょう。精度・信頼性・市場の深い洞察を追求するトレーダーのために設計された、テクニカル分析ツールの最高峰です。 この最先端インジケーターは、EMA、RSI、MACD、ボリンジャーバンド、ストキャスティクス、ADX などの主要インジケーターを巧みに組み合わせ、M15、H1、H4 といった3つの主要タイムフレームを同時に分析します。その結果、市場ノイズを排除し、最も利益を生むチャンスを明確に示す「コンフルエンススコア」を提供します。 なぜ推測で取引するのですか?次のようにできます: マルチタイムフレームのシナジーを活用: 複数の時間軸を同時に分析し、トレンドや反転の精度を飛躍的に向上させます。 シグナルの品質を最大化: 複数のインジケーターとタイムフレームの確認を統合した高度なスコアリングにより、偽シグナルを大幅に削減。 リアル
MetaTraderマーケットは自動売買ロボットとテクニカル指標を販売するための最もいい場所です。
魅力的なデザインと説明を備えたMetaTraderプラットフォーム用アプリを開発するだけでいいのです。マーケットでプロダクトをパブリッシュして何百万ものMetaTraderユーザーに提供する方法をご覧ください。
取引の機会を逃しています。
- 無料取引アプリ
- 8千を超えるシグナルをコピー
- 金融ニュースで金融マーケットを探索
新規登録
ログイン