Alert System

5

Alert System

You use function keys to create horizontal lines for alerts.

1. Allow set horizontal line properties (line color, line style, line width, ...) for alerts.

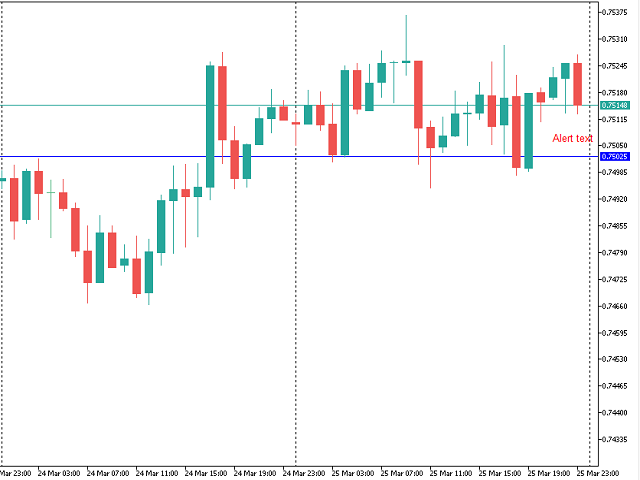
2. Allow add text to horizotanl line. You can hide or show text when you need. You can change text and its price, but time of text will be set in input named "text_time" (0 is current time, you should test this input with -1, -2, -3 or lower).

3. It has 2 types of alert: above and bellow. You can set key to create them. If price is above the "above" alert line, you will get alert, and the same for "below".

4. You can set color for these alert line when the alert is ended.

Version 1.10: Add bells to alerts, when you click the bell, alert will be enabled or disabled.

Version 1.30:

- Delete the bell when alert line is deleted.

- Add color input for enabled bell.

Recensioni 3
Saleh222
65
Saleh222 2023.05.19 18:49 
 

Please add sending notification

Prodotti consigliati
Custom Candle – Multi-Timeframe Visualization Analyzing multiple timeframes is essential for accurate trading decisions, but switching between charts can be inconvenient and inefficient. The Custom Candle indicator solves this problem by overlaying higher-timeframe (HTF) candles directly onto your lower-timeframe (LTF) chart. This allows you to see the bigger picture at a glance, align with the higher trend, and improve trade accuracy—without leaving your current chart. Key Features Multi-Timefr
FREE
SMC Structure Markup
Seyed Mohammad Hosseini Hejazi
4.67 (15)
Overview The Smart Money Structure Markup Indicator for MetaTrader 5 is a powerful tool designed to help traders identify key market structures based on popular Smart Money Concepts (SMC) strategies. This indicator detects micro-market structures, providing insights into price movements and potential trend changes. It highlights important elements such as valid Break of Structure (BOS), Change of Character (CHoCH), and Inducement (IDM), helping traders to make informed decisions. Key Features Ma
FREE
Nyse Usdxy
Mitchell Dean Ede
5 (1)
Displays a USD DXY chart in a seperate window below the main chart. YOUR BROKER MUST HAVE THESE SYMBOLS FOR THE INDICATOR TO WORK Based on EUR/USD, USD/JPY, GBP/USD, USD/CAD, USD/CHF and USD/SEK All these pairs must be added to Market Watch for the indicator to work correctly As this is calculated using a formula based on the 6 pairs it will only work when the market is open. YOUR BROKER MUST HAVE THESE SYMBOLS FOR THE INDICATOR TO WORK Displays a USD DXY chart in a seperate window below the m
FREE
This indicator uses a different approach from the previous version to get it's trendlines. This method is derived from Orchard Forex, and the process of making the indicator is demonstrated in there video   https://www.youtube.com/watch?v=mEaiurw56wY&t=1425s . The basic idea behind this indicator is it draws a   tangent line   on the highest levels and lowest levels of the bars used for calculation, while ensuring that the lines don't intersect with the bars in review (alittle confusing? I know
FREE
Dark Bands MT5
Marco Solito
4.89 (291)
Dark Bands   is an Indicator for intraday trading. This Indicator is based on Counter Trend  strategy but use also Volatility. We can enter in good price with this Indicator, in order to follow the inversions on the current instrument. Key benefits Easily visible take profit/stop loss lines Reliable bands lines with futuristic colors, and  Intuitive directional arrows Useful statistics , which indicate the win rate of the signals Plus Package  available, leave a feedback to receive it for fr
FREE
One of the simplest Pivot Point indicator, easy to operate, and most complete for a single chart in determining    Resistance   and   Support  level lines. In single chart,  it will show R&S Level Line with 5 popular types of Pivot Point, Highest&Lowest of closing price Include the Trend and up to 3 Time Frames. Five   types   (Floor, Woodie, Camarilla, DeMark, & Fibonacci)   of popular   Pivot Points   in determining   Resistance   and   Support   levels. With just using simple button on the
FREE
RSI Chart Levels
Nikolay Mitrofanov
4.83 (6)
The indicator draws levels based on the overbought and oversold values ​​of the RSI indicator. The maximum values ​​are taken into account, which are equal to or exceeded certain limits. That is, for example, when the price has gone into the overbought zone, the highest price is selected from all prices in this zone for this period of time, and as soon as the indicator value returns to a value below the overbought value, the level is fixed and the calculation of new values ​​begins. The same
FREE
Supertrend Line
Flavio Javier Jarabeck
4.87 (23)
The Supertrend indicator was originally created by a french fellow named Olivier Seban , and its goal is to identify the Primary Trend of prices . Its calculation is easy and based on the average of Highs and Lows and then we add the volatility of a custom period, plus a multiplier. This way we get the Supertrend Line. You can find in the web several approaches and trading strategies using this very useful indicator. HOW TO "READ" THIS INDICATOR If the closing prices are above Supertrend Line,
FREE
Decision Point
Zoltan Nemet
5 (1)
With this indicator user can determine not just pivot like turning points. User able to spot trading ranges boundaries and support-resistance levels.  In a strong trend the reverse signals also gives us excellent entry points. Recommended user settings: In the Attis volume: look back period : 1 or (3) MA_Lenght 99. ( of course one can play with the settings and get tailored signals... as you need)
FREE
TilsonT3
Jonathan Pereira
5 (1)
Tillson's T3 moving average was introduced to the world of technical analysis in the article ''A Better Moving Average'', published in the American magazine Technical Analysis of Stock Commodities. Developed by Tim Tillson, analysts and traders of futures markets soon became fascinated with this technique that smoothes the price series while decreasing the lag (lag) typical of trend-following systems.
FREE
CYCLE WAVE OSCILLATOR indicator is an indicator based on cyclical price fluctuations. This indicator can help you determine overbought and oversold levels, and help you predict price trends within the cycle. MT4 Version here! You can combine it with our indicators below to make your trading decisions more accurate: Supply Demand Ribbon MT5 Basic Feature: - Three Trend Types: + Zero + Basic + Advanced
FREE
Color Trend
Bruno Goncalves Mascarenhas
Combining the best of Price Action , Directional Movement , and Divergence / Convergence analysis, the Candle Color Trend is the easy and reliable way to identify the direction of the trend. The indicator automatically paints the candles according to the premise that the upward trend is defined by prices that form a series of ascending tops and bottoms. On the other hand, the downward trend is defined by prices that form a series of descending tops and bottoms. Color Trend is certainly one of
FREE
WindFlow HTF is a useful tool suited to use in conjunction together with my WindFlow indicator. This indicator will give you a background vision about the price action trend on a higher timeframe, so when it runs with the WindFlow indicator you have an almost complete trading solution. At this point, you only need some support/resistance analysis and a bit of focus to become a consistent trader. The metaphorical "wind's ballet" Professional traders know that every timeframe is governed by its o
FREE
Strong Move
Triet Lam Minh
This indicator combines RSI(14) and ADX(14) to find out the signal that price moves strongly. When it appears signal (represent by the yellow dot), and price is going down, let consider to open a SELL order. Otherwise, let consider to open a BUY order. In this case, the strength of moving is strong (normally after sideway period), so  we can set TP by 3 times of SL  . 
FREE
IQuantum
Evgeniy Scherbina
The indicator IQuantum shows trading signals for 10 symbols in the daily chart: AUDCAD, AUDUSD, EURUSD, GBPCAD, GBPCHF, GBPUSD, NZDUSD, USDCAD, USDCHF, and USDJPY. Signals of the indicator are produced by 2 neural models which were trained independently from one another. The inputs for the neural models are normalised prices of the symbols, as well as prices of Gold, Silver and markers of the current day. Each neural model was trained in 2 ways. The Ultimate mode is an overfitted neural model
FREE
ColoredMA
Paulo Henrique Faquineli Garcia
4.5 (2)
Média Móvel que possui todos tipos de Cálculo comum: Simples Exponencial Suavizada Ponderada Conta com suporte para aplicação sob outros indicadores! Seu principal diferencial é o esquema de cores em GRADIENTE que, de acordo com a mudança no ângulo da média, altera suas cores conforme demonstrado nas imagens abaixo. Com isso, espera-se que o usuário tenha uma percepção mais suavizada das pequenas alterações. Bons trades!!
FREE
I present the well-known Moving Average indicator. This indicator is presented as a channel, where the upper and lower lines are equidistant from the main line by a percentage set by the user. The indicator is easy to use. The basic settings of the moving average have been saved and a percentage parameter (Channel%) has been added. Basic parameters: Channel% - shows how much we want to deviate from the main line. The indicator is freely available.
FREE
The Periodic ATR Indicator visually compares the ATR values of each bar to the average ATR values for the same time of day over previous days. By contrasting the current ATR value with the historical average, this tool allows traders to identify exceptionally strong or weak market movements. It also helps to contextualize each market movement within the broader framework of long-term market behavior. This versatile indicator is compatible with all timeframes, including higher ones such as 4-hou
FREE
Nexus Breakout line
Mohammed Kaddour
5 (1)
INTRODUCTION : The breakout strength meter is a trading tool that is used to identify which currencies are the strongest to breakout, and which currencies are the weakest to breakout. The settings for the indicator are easy, and if you cannot find the settings, please leave a comment The tools are completely free to use Please, if you like the indicator, please leave a comment and rate the indicator in order to develop it
FREE
Accurate Buy Sell System is a clean and reliable swing-based indicator designed to identify trend reversals and entry zones with high precision. The algorithm follows the original “Accurate Swing Trading System” concept from TradingView (by ceyhun) and has been fully re-engineered for MetaTrader 5. 1:1 match with TradingView behavior Works on all symbols and timeframes Clean non-repainting signals when used after candle close Visual BUY/SELL arrows + colored dynamic trendline Popup al
FREE
VFI Quantum
Nikita Berdnikov
5 (1)
Introducing VFI (Volume Flow Indicator) – a trading indicator that analyzes the relationship between volume and price movement to identify key trading opportunities. The indicator displays the strength and direction of volume flow, providing clear signals about potential entry and exit points. Signals are formed based on zero line crossovers, crossovers between the VFI line and its exponential moving average (EMA), and when the indicator exits overbought and oversold zones. Attention! This stra
FREE
Highly configurable Force Index indicator. Features: Highly customizable alert functions (at levels, crosses, direction changes via email, push, sound, popup) Multi timeframe ability Color customization (at levels, crosses, direction changes) Linear interpolation and histogram mode options Works on strategy tester in multi timeframe mode (at weekend without ticks also) Adjustable Levels Parameters: Force Index Timeframe:  You can set the current or a higher timeframes for Force Index. Force Ind
FREE
QuantumAlert CCI Navigator is a free indicator available for MT4/MT5 platforms, its work is to provide "alerts" when the market is inside "overbought and oversold" regions in the form of "buy or sell" signals. This indicator comes with many customization options mentioned in the parameter section below, user can customise these parameters as needful. Join our   MQL5 group , where we share important news and updates. You are also welcome to join our private channel as well, contact me for the pri
FREE
Trend Strength Analyzer
Andrey Sorokin
4.8 (5)
The technical indicator Trend Strength Analyzer measures the deviation of the price of an instrument from average values ​​over a specific period of time. A comparative analysis of the relative strength of bulls and bears underlies the indicator. If bulls prevail, an upward trend. If bears are stronger - a downward trend.      Settings: Strike Energy (2 solid lines) = 14. Influence Power (2 dotted lines) = 50. The TSA oscillator is effective in an active market. The most commonly used indicator
FREE
A buy signal can be seen on the dashboard when the previous signal is red and the next signal is green, then the SAR is green and the RSI is green. A Sell Signal can be seen on the dashboard when the previous Signal is green and the Signal after it is red, then the SAR is red and the RSI is red. Line function - shows on the chart the lines of Opening, Stop Loss, Take Profit. With this function, it is easy to create a new order and see its additional characteristics before opening.   TP and SL
FREE
Introducing the AI Keltner Channel , a cutting-edge Forex indicator that leverages machine learning to dynamically calculate Keltner Channels in real-time. Unlike traditional Keltner Channel indicators, which rely on static inputs, the AI Keltner Channel adapts continuously to ever-changing market conditions, providing traders with a more accurate and responsive view of price trends and volatility. Powered by advanced machine learning algorithms, the AI Keltner Channel analyzes historical and re
FREE
EMA Multi Timeframe (MTF) – MT5 Indicator Description: The EMA Multi Timeframe (MTF) indicator for MT5 allows you to display an Exponential Moving Average (EMA) from a higher (or lower) timeframe directly on your current chart. Example: You can see the Daily (D1) EMA 9 plotted directly on your H1 chart, or even on an M5 chart, helping you align your entries with higher timeframe trends without switching between charts. Key Features: Display EMA from selectable timeframes (M1, M5, M15, M30, H1
FREE
Daily VWAP Indicator
Rafael Gazzinelli
5 (6)
Daily VWAP Indicator (Volume Weighted Average Price) Special Deal! Leave a review and get the indicator  Long & Short Cointegration Analyzer for free — just send me a message! Description The Daily VWAP (Volume Weighted Average Price) indicator is an essential tool for traders seeking to identify the true average price of an asset throughout the day, adjusted by traded volume. Primarily used by institutional and professional traders, the daily VWAP serves as a reference point to identify the av
FREE
Blahtech Moving Average indicator is a multitimeframe version of the standard Moving Average indicator. It is also enhanced with customisable alerts, period breaks and other configuration options. The 50 day and 200 day moving averages are widely followed by investors and traders, with breaks above and below the MA lines considered to be signals of interest. Links [  Install  |  Update  |   Training   |   All Products  ] Feature Highlights Up to three timeframes Configurable calculation variabl
FREE
Gli utenti di questo prodotto hanno anche acquistato
SuperScalp Pro
Van Minh Nguyen
5 (3)
SuperScalp Pro – Sistema avanzato di indicatore per scalping con filtri multipli SuperScalp Pro è un sistema avanzato di indicatore per scalping che combina il classico Supertrend con molteplici filtri di conferma intelligenti. L’indicatore funziona in modo efficiente su tutti i timeframe da M1 a H4 ed è particolarmente adatto per XAUUSD, BTCUSD e le principali coppie Forex. Può essere utilizzato come sistema stand-alone o integrato in modo flessibile nelle strategie di trading esistenti. L’indi
FX Trend MT5 NG
Daniel Stein
5 (2)
FX Trend NG: La Nuova Generazione di Intelligenza di Trend Multi-Mercato Panoramica FX Trend NG è uno strumento professionale di analisi del trend multi-timeframe e monitoraggio dei mercati. Ti consente di comprendere la struttura completa del mercato in pochi secondi. Invece di passare tra numerosi grafici, puoi identificare immediatamente quali strumenti sono in trend, dove il momentum sta diminuendo e dove esiste un forte allineamento tra i timeframe. Offerta di Lancio – Ottieni FX Trend NG
Se acquisti questo indicatore, riceverai il mio Trade Manager Professionale + EA  GRATUITAMENTE. Innanzitutto è importante sottolineare che questo sistema di trading è un indicatore Non-Repainting, Non-Redrawing e Non-Lagging, il che lo rende ideale sia per il trading manuale che per quello automatico. Corso online, manuale e download di preset. Il "Sistema di Trading Smart Trend MT5" è una soluzione completa pensata sia per i trader principianti che per quelli esperti. Combina oltre 10 indicat
ARIPoint
Temirlan Kdyrkhan
ARIPoint is a powerful trading companion designed to generate high-probability entry signals with dynamic TP/SL/DP levels based on volatility. Built-in performance tracking shows win/loss stats, PP1/PP2 hits, and success rates all updated live. Key Features: Buy/Sell signals with adaptive volatility bands Real-time TP/SL/DP levels based on ATR Built-in MA Filter with optional ATR/StdDev volatility Performance stats panel (Success, Profit/Loss, PP1/PP2) Alerts via popup, sound, push, or email Cu
Entry In The Zone and SMC Multi Timeframe is a real-time market analysis tool developed based on Smart Money Concepts (SMC). It is designed to analyze market structure, price direction, reversal points, and key zones across multiple timeframes in a systematic way. The system displays Points of Interest (POI) and real-time No Repaint signals, with instant alerts when price reaches key zones or when signals occur within those zones. It functions as both an Indicator and a Signal System (2-in-1), c
Divergence Bomber
Ihor Otkydach
4.89 (81)
Ogni acquirente dell’indicatore riceverà inoltre gratuitamente: L’utilità esclusiva “Bomber Utility”, che gestisce automaticamente ogni operazione, imposta i livelli di Stop Loss e Take Profit e chiude le posizioni secondo le regole della strategia I file di configurazione (set file) per adattare l’indicatore a diversi asset I set file per configurare il Bomber Utility in tre modalità: “Rischio Minimo”, “Rischio Bilanciato” e “Strategia di Attesa” Una guida video passo-passo per installare, conf
Azimuth Pro
Ottaviano De Cicco
5 (4)
LAUNCH PROMO Azimuth Pro price is initially set at 299$ for the first 100 buyers. Final price will be 499$ . THE DIFFERENCE BETWEEN RETAIL AND INSTITUTIONAL ENTRIES ISN'T THE INDICATOR — IT'S THE LOCATION. Most traders enter at arbitrary price levels, chasing momentum or reacting to lagging signals. Institutions wait for price to reach structured levels where supply and demand actually shift. Azimuth Pro maps these levels automatically: swing-anchored VWAP, multi-timeframe structure lines, an
Game Changer è un indicatore di tendenza rivoluzionario, progettato per essere utilizzato su qualsiasi strumento finanziario, per trasformare il tuo MetaTrader in un potente analizzatore di trend. Funziona su qualsiasi intervallo temporale e aiuta a identificare i trend, segnala potenziali inversioni, funge da meccanismo di trailing stop e fornisce avvisi in tempo reale per risposte tempestive del mercato. Che tu sia un professionista esperto o un principiante in cerca di un vantaggio, questo st
Power Candles MT5
Daniel Stein
5 (6)
Power Candles – Segnali di ingresso basati sulla forza per tutti i mercati Power Candles porta l’analisi di forza collaudata di Stein Investments direttamente sul grafico dei prezzi. Invece di reagire solo al prezzo, ogni candela viene colorata in base alla reale forza di mercato, consentendo di identificare immediatamente accumuli di momentum, accelerazioni della forza e transizioni di trend pulite. Un’unica logica per tutti i mercati Power Candles funziona automaticamente su tutti i simboli di
Atomic Analyst MT5
Issam Kassas
4.07 (28)
Innanzitutto, vale la pena sottolineare che questo indicatore di trading non è repaint, non è ridisegno e non presenta ritardi, il che lo rende ideale sia per il trading manuale che per quello automatico. Manuale utente: impostazioni, input e strategia. L'Analista Atomico è un indicatore di azione del prezzo PA che utilizza la forza e il momentum del prezzo per trovare un miglior vantaggio sul mercato. Dotato di filtri avanzati che aiutano a rimuovere rumori e segnali falsi, e aumentare il pote
Super Signal – Skyblade Edition Sistema professionale di segnali di tendenza senza repaint / senza ritardo con tasso di vincita eccezionale | Per MT4 / MT5 Funziona meglio su timeframe più bassi, come 1 minuto, 5 minuti e 15 minuti. Caratteristiche principali: Super Signal – Skyblade Edition è un sistema intelligente di segnali progettato specificamente per il trading di tendenza. Utilizza una logica di filtraggio multilivello per identificare esclusivamente i movimenti direzionali forti, supp
FX Power MT5 NG
Daniel Stein
5 (31)
FX Power: Analizza la Forza delle Valute per Decisioni di Trading Più Intelligenti Panoramica FX Power è lo strumento essenziale per comprendere la reale forza delle principali valute e dell'oro in qualsiasi condizione di mercato. Identificando le valute forti da comprare e quelle deboli da vendere, FX Power semplifica le decisioni di trading e rivela opportunità ad alta probabilità. Che tu segua le tendenze o anticipi inversioni utilizzando valori estremi di Delta, questo strumento si adatta
Top indicator for MT5   providing accurate signals to enter a trade without repainting! It can be applied to any financial assets:   forex, cryptocurrencies, metals, stocks, indices .  Watch  the video  (6:22) with an example of processing only one signal that paid off the indicator! MT4 version is here It will provide pretty accurate trading signals and tell you when it's best to open a trade and close it. Most traders improve their trading results during the first trading week with the help of
Trend Screener Pro MT5
STE S.S.COMPANY
4.84 (100)
Indicatore di tendenza, soluzione unica rivoluzionaria per il trading di tendenze e il filtraggio con tutte le importanti funzionalità di tendenza integrate in un unico strumento! È un indicatore multi-timeframe e multi-valuta al 100% non ridipingibile che può essere utilizzato su tutti i simboli/strumenti: forex, materie prime, criptovalute, indici e azioni. Trend Screener è un indicatore di tendenza che segue un indicatore efficiente che fornisce segnali di tendenza a freccia con punti nel gra
L'indicatore " Dynamic Scalper System MT5 " è progettato per il metodo di scalping, ovvero per il trading all'interno di onde di trend. Testato sulle principali coppie di valute e sull'oro, è compatibile con altri strumenti di trading. Fornisce segnali per l'apertura di posizioni a breve termine lungo il trend, con ulteriore supporto al movimento dei prezzi. Il principio dell'indicatore. Le frecce grandi determinano la direzione del trend. Un algoritmo per generare segnali per lo scalping sott
L’indicatore evidenzia le zone in cui viene dichiarato interesse sul mercato , per poi mostrare la zona di accumulo degli ordini . Funziona come un book degli ordini su larga scala . Questo è l’indicatore per i grandi capitali . Le sue prestazioni sono eccezionali. Qualsiasi interesse ci sia nel mercato, lo vedrai chiaramente . (Questa è una versione completamente riscritta e automatizzata – non è più necessaria un’analisi manuale.) La velocità di transazione è un indicatore concettualmente nuo
Smart Stop Indicator – Precisione intelligente dello stop-loss direttamente sul grafico Panoramica Smart Stop Indicator è la soluzione ideale per i trader che desiderano posizionare il loro stop-loss in modo chiaro e metodico, senza dover indovinare o affidarsi all’intuizione. Questo strumento combina la logica classica del price action (massimi e minimi strutturali) con un moderno riconoscimento dei breakout per identificare il prossimo livello di stop realmente logico. In trend, in range o i
Gold Entry Sniper
Tahir Mehmood
5 (3)
Gold Entry Sniper – Dashboard ATR Multi-Timeframe per Scalping e Swing Trading sull’Oro Gold Entry Sniper è un indicatore avanzato per MetaTrader 5 che offre segnali di acquisto/vendita precisi per XAUUSD e altri strumenti, basato sulla logica ATR Trailing Stop e l' analisi multi-timeframe . Caratteristiche e Vantaggi Analisi Multi-Timeframe – Visualizza trend su M1, M5, M15 in un'unica dashboard. Trailing Stop Basato su ATR – Stop dinamici che si adattano alla volatilità. Dashboard Professional
Ogni giorno, molti trader affrontano una sfida comune: il prezzo sembra rompere un livello chiave, entrano in un'operazione, e poi il mercato si inverte, attivando il loro stop loss. Questo è noto come falsa rottura (false breakout) — un movimento di prezzo che supera brevemente un livello di supporto o resistenza prima di invertire la direzione. Questi movimenti possono causare l'attivazione degli stop loss prima che la direzione effettiva del prezzo diventi chiara. Nell'analisi tecnica, questo
Quantum TrendPulse
Bogdan Ion Puscasu
5 (20)
Ecco   Quantum TrendPulse   , lo strumento di trading definitivo che combina la potenza di   SuperTrend   ,   RSI   e   Stocastico   in un unico indicatore completo per massimizzare il tuo potenziale di trading. Progettato per i trader che cercano precisione ed efficienza, questo indicatore ti aiuta a identificare con sicurezza le tendenze di mercato, i cambiamenti di momentum e i punti di entrata e uscita ottimali. Caratteristiche principali: Integrazione SuperTrend:   segui facilmente l'andame
Quantum Entry   è un potente sistema di trading basato sull'azione del prezzo, costruito su una delle strategie più popolari e conosciute tra i trader: la strategia di   Breakout ! Questo indicatore genera segnali di acquisto e vendita chiari e cristallini basati sulla rottura di aree chiave di supporto e resistenza. A differenza dei tipici indicatori di breakout, utilizza calcoli avanzati per confermare con precisione la rottura! Quando si verifica una rottura, ricevi avvisi immediati. Nessun r
Support And Resistance Screener è in un indicatore di livello per MetaTrader che fornisce più strumenti all'interno di un indicatore. Gli strumenti disponibili sono: 1. Screener della struttura del mercato. 2. Zona di ritiro rialzista. 3. Zona di ritiro ribassista. 4. Punti pivot giornalieri 5. Punti pivot settimanali 6. Punti pivot mensili 7. Forte supporto e resistenza basati sul modello e sul volume armonici. 8. Zone a livello di banca. OFFERTA A TEMPO LIMITATO: il supporto HV e l'indicatore
Bill Williams Advanced
Siarhei Vashchylka
5 (10)
Bill Williams Advanced is designed for automatic chart analysis using Bill Williams' "Profitunity" system. The indicator analyzes four timeframes at once. Manual (Be sure to read before purchasing) Advantages 1. Analyzes the chart using Bill Williams' "Profitunity" system. Signals are displayed in a table in the corner of the screen and on the price chart. 2. Finds all known AO and AC signals, as well as zone signals. Equipped with a trend filter based on the Alligator. 3. Finds "Divergence Bar
Trend indicator AI mt5
Ramil Minniakhmetov
5 (15)
Trend Ai indicator è un ottimo strumento che migliorerà l'analisi di mercato di un trader combinando l'identificazione della tendenza con punti di ingresso utilizzabili e avvisi di inversione. Questo indicatore consente agli utenti di navigare nelle complessità del mercato forex con fiducia e precisione Oltre ai segnali primari, l'indicatore Ai di tendenza identifica i punti di ingresso secondari che si presentano durante i pullback o i ritracciamenti, consentendo ai trader di capitalizzare le
Grabber System MT5
Ihor Otkydach
4.82 (22)
Ti presento un eccellente indicatore tecnico: Grabber, che funziona come una strategia di trading "tutto incluso", pronta all’uso. In un solo codice sono integrati strumenti potenti per l’analisi tecnica del mercato, segnali di trading (frecce), funzioni di allerta e notifiche push. Ogni acquirente di questo indicatore riceve anche gratuitamente: L’utility Grabber: per la gestione automatica degli ordini aperti Video tutorial passo dopo passo: per imparare a installare, configurare e utilizzare
[ Il mio canale ] , [ I miei prodotti ] Il Lorentzian Distance Classifier è un indicatore di trading basato sul machine learning che utilizza la distanza di Lorentz come metrica principale all’interno del framework degli Approximate Nearest Neighbors (ANN). Invece di fare affidamento sulla tradizionale distanza euclidea, tratta l’azione dei prezzi finanziari come se avvenisse in uno spazio “distorto” prezzo-tempo (simile al modo in cui gli oggetti massicci curvano lo spazio-tempo nella relativit
Trend Hunter MT5
Andrey Tatarinov
5 (3)
Trend Hunter è un indicatore di tendenza per lavorare nei mercati Forex, criptovaluta e CFD. Una caratteristica speciale dell'indicatore è che segue con sicurezza la tendenza, senza cambiare il segnale quando il prezzo supera leggermente la linea di tendenza. L'indicatore non viene ridisegnato; un segnale per entrare nel mercato appare dopo la chiusura della barra. Quando ci si sposta lungo un trend, l'indicatore mostra ulteriori punti di ingresso nella direzione del trend. Sulla base di quest
FX Levels MT5
Daniel Stein
5 (13)
FX Levels: Supporti e Resistenze di Precisione Eccezionale per Tutti i Mercati Panoramica Rapida Cercate un modo affidabile per individuare livelli di supporto e resistenza in ogni mercato—coppie di valute, indici, azioni o materie prime? FX Levels fonde il metodo tradizionale “Lighthouse” con un approccio dinamico all’avanguardia, offrendo una precisione quasi universale. Basato sulla nostra esperienza reale con i broker e su aggiornamenti automatici giornalieri più quelli in tempo reale, FX
Crystal Heikin Ashi Signals - Professional Trend & Signal Detection Indicator Advanced Heikin Ashi Visualization with Intelligent Signal System for Manual & Automated Trading Overview Crystal Heikin Ashi Signals is a professional-grade MetaTrader 5 indicator that combines pure Heikin Ashi candle visualization with an advanced momentum-shift detection system. Designed for both manual traders and algorithmic systems, this indicator delivers clear trend analysis with precise entry signals through v
TrendMaestro5
Stefano Frisetti
Attenzione alle truffe, questo indicatore e' distribuito esclusivamente su MQL5.com nota: questo indicatore e' per METATRADER5, se vuoi la versione per  METATRADER4 questo e' il link:   https://www.mql5.com/it/market/product/108106 TRENDMAESTRO ver 2.5 TRENDMAESTRO   riconosce un nuovo TREND sul nascere, non sbaglia mai. La sicurezza di identificare un nuovo TREND non ha prezzo. DESCRIZIONE TRENDMAESTRO identifica un nuovo TREND sul nascere, questo indicatore prende in esame la volatilita' i
Altri dall’autore
Draw and Sync Objects
Nguyen Thanh Sang
5 (7)
Draw and Sync Objects Multiple Charts 1. Draw objects by key press. ( You must: 1.  Press Function key => 2. Click where you want to draw => 3. Draw it => 4. Press ESC to complete). (If you don't want to draw after pressing function key, you must press ESC to cancel). 2. Developing  : Sync selected objects to multiple charts by button. 3. Developing: Hide objects that do not belong to the current symbol (Objects drawn with this indicator will belong to the symbol they are plotted on. When your c
FREE
Draw and Sync Objects MT4
Nguyen Thanh Sang
4.67 (6)
Draw and Sync Objects Multiple Charts 1. Draw objects by key press. ( You must: 1.  Press Function key =>   2.   Click where you want to draw =>   3.   Draw it =>   4.   Press ESC to complete). (If you don't want to draw after pressing function key, you must press ESC to cancel). 2.   Developing  : Sync selected objects to multiple charts by button. 3. Developing: Hide objects that do not belong to the current symbol (Objects drawn with this indicator will belong to the symbol they are plotted
FREE
Round Number By Pips
Nguyen Thanh Sang
5 (2)
Indicator draws Round Number lines by distance of pips. 1. You can enable / disable indicator to show / hide the lines. 2. You can set distance of pips between the lines. 3. You can edit the number of lines.  4. You can edit properties of lines by inputs (style (DASH, DOT, SOLID, ...) , width (1 for DASH, DOT, 2 is not for DASH, DOT, it only SOLID), color). When indicator is deleted from the chart, the lines will be removed.
FREE
Tokyo Session Box
Nguyen Thanh Sang
3 (1)
Tokyo Session Box Indicator : Draw a box of Tokyo session. Inputs tutorial: 1. Automatic: true/false. To calculate box automatic base GMT. 2. Broker time zone: if Automatic is False, you have to define broker time zone (ex: 2 ) 3. Button ON/OFF properties: x, y, corner, color, background fill, width, height, font name, font size.   This button will toggle showing or hiding Tokyo session box.
FREE
Candle Time Remaining
Nguyen Thanh Sang
5 (2)
This indicator show candle time remaining. The remaining time of the candle is calculated every 200 milliseconds. 1. You can set x (horizontal), y (vertical) of text. 2. You can set font, color, size of text. 3. You can remove the text without having to remove the indicator from the chart. The remaining time of the candle depends on the timeframe of the chart with the indicator.
FREE
Synchronize objects from one chart to multiple charts. Synchronize objects from one chart to multiple charts. 1. Allows automatic synchronization of new and edited objects to other charts. 2. Allows synchronization of all objects on the chart to other charts at the current time. 3. Allows setting the charts to synchronize based on the position of the chart in the MT4 window. Version 1.2: Allow set list of object names that you don't want to sync (Separated by commas ",") Allow set 5 types of o
FREE
Switch symbols and timeframe by arrow buttons 1. You can switch multiple symbols of one or all charts. 2. You can set list of symbols to switch between them or get them from Market Watch. 3. You can change timeframe of one or all charts. List of timeframes here [M1, M5, M15, M30, H1, H4, D1, W1, MN1]. Switch symbol of all charts: indicator check current symbol of the chart to get index of it in list and change for next or previous. Key functions: - Right arrow key: switch to next symbol. - Left
FREE
List of buttons to switch between symbols on multiple charts 1. Set x, y coordinates (horizontal, vertical) for list of buttons. 2. Show/hide buttons by clicking button or keypress. 3. The number of columns of the button list. 4. The color of the buttons and the color of the current symbol button. 5. The button list is separated by commas. If the list is empty, the indicator takes the list of symbols in the Market Watch. 6. Set the keypress to show and hide the list of buttons. 7. Multiple Char
FREE
Filtro:
Saleh222
65
Saleh222 2023.05.19 18:49 
 

Please add sending notification

JavierMz
227
JavierMz 2022.03.27 01:35 
 

L'utente non ha lasciato alcun commento sulla valutazione.

Mary Gomes
359
Mary Gomes 2022.03.26 07:47 
 

L'utente non ha lasciato alcun commento sulla valutazione.

Rispondi alla recensione