 MetaTrader 5
 Experts
 Indicatori
 librerie
 Utilità
 Widget
 Regole
Guarda i video tutorial del Market su YouTube
Come acquistare un Robot di Trading o un indicatore
Esegui il tuo EA
hosting virtuale
hosting virtuale
Prova un indicatore/robot di trading prima di acquistarlo
Vuoi guadagnare nel Market?
Come presentare un prodotto per venderlo con successo
Indicatori tecnici per MetaTrader 5 - 68
 I segnali degli indicatori tecnici giocano un ruolo cruciale nell'apertura e nella chiusura delle transazioni sui mercati azionari e Forex. L'essenza degli indicatori è una trasformazione matematica del prezzo di un simbolo finanziario, finalizzata alla previsione dei cambiamenti futuri dei prezzi. Prova gli indicatori tecnici, per prevedere al meglio il comportamento del mercato e ricavarne dei guadagni.

Pivot Point Slim Indicator Overview A professional-grade pivot point indicator equipped with 6 types of pivots. With a clean, easy-to-read design, it automatically displays important support and resistance levels on your chart. Customizable Display Settings Individual color settings for each level (P, S1-S5, R1-R5) Show/hide toggle for each level Label display on/off Price display on/off Label position (left/right) Label offset adjustment (spacing between lines and text) Line width adjustment Hi
FREE

This indicator is based on the Bollinger Bands indicator. It helps the user identifying whether to buy or sell. It comes with an alert that will sound whenever a new signal appears. It also features an email facility. Your email address and SMTP Server settings should be specified in the settings window of the "Mailbox" tab in your MetaTrader 5. Blue arrow up = Buy. Red arrow down = Sell. Line = Trailing Stop. You can use one of my Trailing Stop products that automatically move the Stop Loss and
FREE

Magnified Price Experience trading like never before with our Magnified Price indicator by BokaroTraderFx , designed exclusively for MetaTrader 5. This revolutionary tool provides traders with instant insights into price movements, offering a clear advantage in today's fast-paced markets.
Key Features: 1. Real-time Precision: Instantly magnify price action to uncover hidden trends and patterns. 2. Enhanced Visibility: Clear visualization of price movements with adjustable zoom levels. 3. User
FREE

This project did not reach the basic funding number, so I am abandoning it momentarily. The system is now free for other traders to continue the idea. You can follow my new project through my signals.
A tool for institutional investor, now avaliable for Home users. We equip you like banks equip their analysts!
How it works
Focused on the Forex market, it takes advantage of the need of nations to control the value of their currency and the world exchange variations to analyze, through the pro
FREE

The indicator calculates ZigZag using the classic algorithm with three parameters: Depth, Deviation, and Backstep. Its main function is detecting and visualizing repaints — moments when the last ZigZag point shifts to a new bar.
Upon loading, the indicator performs a simulation over the specified history depth. The algorithm sequentially recalculates ZigZag for each bar, comparing the current position of the last point with the previous one. If a shift is detected, a repaint line appears on the
FREE

Super Strike — The Ultimate Trend Precision System
Super Strike is an advanced trend-following system that combines the proven accuracy of the SuperTrend algorithm with the filtering power of a dynamic Moving Average . Built for traders who demand precision and confidence, this indicator transforms raw price action into a clean, intuitive, and highly informative visual system — a complete framework for making smarter trading decisions.
At the heart of Super Strike lies a dynamic calculation o
FREE

Kito Session Range Projection is a MetaTrader 5 indicator for traders who organize intraday analysis around the Asia, London and New York trading sessions.
The indicator draws each configured session as a broker-time range, tracks the high, low and midpoint, and extends symmetric projection levels above and below the range. It also compares the session range with the average daily range calculated from 20 completed daily candles.
The indicator is designed for chart analysis. It does not open,
FREE

LotCalc is a minimalist MT5 indicator designed for fast, precise position sizing. Set your risk amount in dollars, click the button, then click your entry and stop-loss levels directly on the chart — the lot size and point distance are calculated and displayed instantly. No clutter, no extra panels, just the one tool you actually need before placing a trade.
FREE

Three Anchors On One Chart Most volume weighted average lines restart once a day. This one draws three at the same time: one anchored to the current trading session, one to the day, one to the week. Their spread tells you something a single line cannot. When the session line sits far under the weekly one, the week has been trading higher than today is; when all three sit together, the market has spent the week in one place. Why The Session Anchor Is Not Midnight The session line starts where the
FREE

Crypto Position Size Calculator - a free position size calculator built for cryptocurrency traders. Enter your account balance, risk percentage, entry and stop-loss prices, and instantly get the exact position size for BTC, ETH and any other crypto symbol your broker offers. Crypto prices move fast and vary wildly between coins, so a fixed position size can mean wildly different risk from one trade to the next. This calculator measures the distance to your stop in the coin's own price and conver
FREE

RSI talking, use all your senses while trading!
The idea When trading your eyes might be very stressed. Therefore I programmed the RSItalking. Trade what you see and what you hear !
Function This indicator says "rsioverbought" when rsi is over a threshold value (default 75%) and "rsioversold" if it is under a lower threshold (default 25%). When you keep a long position be adviced to realize profit when the indicator tells you "rsioverbought" and vice versa. You will find an explanation of the
FREE
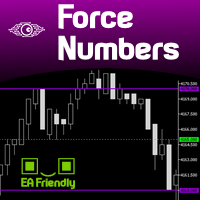
Several assets in several markets have the behavior of using specific numbers as Force Numbers, where support, resistance and price thrust is created. Let this indicator draw those levels of support and resistance for you. You can also stack it to show different level of Prices! This technique is being used by Tape Readers and Order Flow traders all over the world for a long time. Give it a try. Challenge yourself to study new ways of Price Action!
SETTINGS
What Price reference to use in the c
FREE

Trend flow ICT helps you quickly assess the strength and direction of the trend on the chart. *Note: Free indicator included - https://www.mql5.com/en/market/product/149447
Configuration guide Score: The length of the scoring window. Smaller → more sensitive, prone to noise. Larger → smoother, less signals. ATR: ATR period to standardize fluctuations. Trend threshold: Threshold to confirm a trend. Strong trend: Strong trend threshold. Min Body (x ATR): Minimum candle body to confirm a breakou
FREE

What It Shows Candle Clock Desk puts four lines on the chart. The first is the time left until the current bar closes. The next three answer a question the clock alone cannot: is this bar unusually busy, or unusually quiet, right now. Bar closes in - the countdown, in minutes and seconds So far - volume this bar has accumulated since it opened Usual here - what this symbol had accumulated by this same minute, in the past Pace - the first divided by the second The Pace Line Pace of 1.00 means the
FREE

Fusion Range MTF The Ultimate Multi-Timeframe Confluence Cockpit. Introduction The biggest challenge for any trader is not finding a signal, but confirming its validity across multiple timeframes. Fusion Range MTF is an advanced structural analysis dashboard that merges the power of the ZigZag (Classic & PSAR modes) with a high-end Visual Gauge System for 10 simultaneous timeframes (from Monthly down to 15M). How Does It Work? The indicator calculates an "Institutional Range" in real
FREE
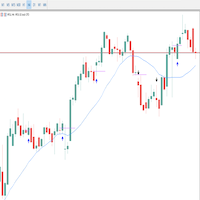
Multset This is inte_plays indicator, which helps the trader to enter the trades appropriately it plots an arrow when there is appropriate environment which permits trading
Features 1. Sends push notification on mobile devices 2. Plots arrow on chart when the setting is found
TimeFrame Is suggested to be used on higher time frames only, especially starting 15min and above for proper moves
For more informations please Visit: https://t.me/Tz_Fx_Lab Subscribe to our Youtube channel: https:
FREE

Questo indicatore è stato sviluppato per aiutarti come trader a identificare la direzione del mercato, NEL trading abbiamo tre tipi di movimenti e UPTREND, DOWNTREND e SIDEWAYS, il movimento laterale del mercato è dove la maggior parte dei trader rimane intrappolata, poiché il prezzo è consolidare, questo significa semplicemente che non c'è direzione, per gli scalper questo può essere un vantaggio per loro SOLO se sanno come identificare quando le classi di attività sono in questo periodo.
Un
FREE

CLC Smart Gold V2.00 – Precision Gold Trading System CLC Smart Gold V2.00 is a sophisticated technical analysis tool specifically engineered for XAUUSD (Gold) . Built on a foundation of advanced price action algorithms and momentum filtering, Version 2.00 is designed to capture high-probability reversals and trend continuations in the volatile gold market. This indicator is ideal for both professional scalpers and day traders who require precision and reliability without the noise of traditional
FREE

Daily ATR Range + Percent + Daily Open Professional indicator that displays dynamic price levels based on Daily Average True Range (ATR) calculated from the Daily Open price. Key Features: • Automatic Daily ATR calculation with optional outlier filter • Key percentage levels: 25%, 50%, 75%, 100%, 150% of Daily ATR • Daily Open line with customizable style and color • Clear labels positioned on the left side of each level • Informative panel showing ATR value, expected move, distance to levels a

Hi there! Since I am starting commercial and non-commercial product publishing I would highly appreciate: If you like this product, please rate it. That will help to promote not only this product, but indirectly another ones. So, such promotion will help to make some money from commercial products. Thus, I will have opportunity to fund my another directions of trading researches like bot development using mql4 and mql5 programming languages as well as python written products like crypto bots. If
FREE

Mahdad Candle Timer è un indicatore leggero e preciso per MetaTrader 5 che mostra il tempo rimanente alla chiusura della candela corrente, visualizzato direttamente accanto all’ultima barra. È stato progettato per i trader che si affidano a un timing accurato — che si tratti di scalping, day trading o dell’attesa della conferma di una candela in configurazioni swing. Caratteristiche principali Conto alla rovescia accurato – Tempo rimanente in formato HH:MM:SS (opzionalmente millisecondi) Pos
FREE

Click2FiboDrawer – Instantly Draw Fibonacci Retracement Lines with 2 Clicks Click2FiboDrawer is a powerful manual drawing tool for discretionary traders who use Fibonacci retracements in their technical analysis.
With just two mouse clicks, you can draw clean and precise Fibonacci levels directly on your chart — no clutter, no menus, no hassle. Even during fast-paced scalping sessions, this tool enables you to quickly add Fibonacci retracement levels and react to market moves in real-time.
It’s
FREE
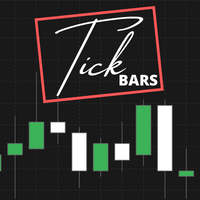
Indicator that show candlestick bars with an different sampling method than time fixed. Real time data is sourced to the indicator and it may be used as substitute of the default graph. Each bar is formed when a predefined amount of ticks is received, showing in the graph the OHLC of this clusteri of ticks. The input variable is the amount of ticks of each bar. It's a different approach of sampling, the amount of bars is proportional to the amount of negotiations insted of a sample in a fixed am
FREE

CCI Multi-Timeframe Dashboard shows the CCI reading of four timeframes at the same time, so you can measure momentum extremes across the market at a glance. By default it displays the M15, H1, H4 and D1 timeframes, and the period, applied price and levels are configurable. Each timeframe is color coded, with red when the reading is above the upper level, green when it is below the lower level and grey when it is in the normal zone, which makes stretched conditions easy to see. Alerts are based o
FREE
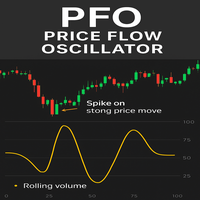
PFO Price Flow Oscillator – MT5 Indicator
The PFO Price Flow Oscillator is a highly advanced tool designed to help traders anticipate explosive price movements and identify market momentum with precision.One of its most powerful features is the ability to anticipate explosive price moves before they occur, giving traders an early edge in volatile markets. Unlike standard oscillators, the PFO does not rely on price alone—it integrates multiple market factors to provide clear, actionable insight
FREE
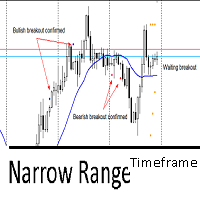
This indicator utilizes the Narrow Range 7 concept . This concept says that if the seventh candle is the one with the smallest range, that is, the smallest difference between maximum and minimum of all 7 candles. The indicator marks this candle with two markers and waits for a breakout to happens in the next 6 candles. It's called "timeframe" because if in the next 6 candles the breakout not happens, it will remove all marks on candle. If it exceeds 7 times the timeframe, it also will remove the
FREE
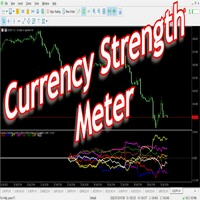
Have you ever wondered which currency is the strongest at any particular time? Or which currency pair is trending the most. Well, the currency strength meter helps with just that. It compares USD , EUR , AUD , CHF , GBP , CAD and NZD depending on the timeline you have chosen in settings, and ranks them on the number of pips each has moved compared to the rest. N/B: All currency charts of the above pairs must have loaded. You can do this by highlighting all major and minor currencies in
FREE
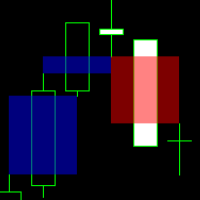
This indicator identifies and highlights market inefficiencies, known as Fair Value Gaps (FVG), on price charts. Using a custom algorithm, the indicator detects these areas of imbalance where the price moves sharply, creating potential trading opportunities. Indicator Parameters: Bullish FVG Color (clrBlue) : Color used to highlight bullish inefficiencies. The default value is blue. Bearish FVG Color (clrRed) : Color used to highlight bearish inefficiencies. The default value is red. Bullish FVG
FREE

Az Filter Trend Signal is a high-precision trading tool that combines statistical analysis with advanced trend filtering. By utilizing the Z-Score algorithm, this indicator normalizes price action to identify how far the current price is from its statistical mean, effectively filtering out market noise. The core of the indicator is a smoothed Signal Line (EMA) derived from the Z-Score. This line features a dynamic color-coding system based on its slope and a customizable sensitivity threshold, a
FREE

The MTF MACD .mq5 indicator is a custom technical indicator designed for the MetaTrader 5 (MT5) platform . It is a Multi-Timeframe (MTF) implementation of the standard MACD (Moving Average Convergence Divergence) indicator . With the MTF capability, you can view MACD signals from a higher timeframe (e.g., H1 or D1) directly on your active chart timeframe (e.g., M5 or M15) without switching chart views . Visual Display & Features Separate Window : Displays in an indicator window below the main p
FREE

Free until ...
The MACD Indicator is a MetaTrader 5 tool that helps traders analyze market trends and momentum. It shows three components in a separate window below the price chart: the MACD Line, Signal Line, and Histogram. What It Shows: MACD Line (Blue): Tracks the difference between a fast and slow moving average. Signal Line (Orange): A smoothed average of the MACD Line. Histogram (Bars): Shows the gap between MACD and Signal Lines with colors: Dark Green : Rising momentum above zero. Lig
FREE

ONLY DEMO ACCOUNT Live Versión Here : https://www.mql5.com/en/market/product/170738 ADX System is an advanced trend-strength and momentum confirmation indicator built on ADX and Directional Movement logic. It transforms traditional ADX data into a structured visual system that helps traders identify: • Trend initiation
• Strength acceleration
• Buy/Sell confirmation phases
• Momentum shifts
• Continuation zones The indicator features a two-step confirmation process (Alert → Confirmation), a
FREE
Breakout Shift Trader – MT5 Indicator Trade Like the Market Architects — Not the Victims. Most traders are fighting blind against a rigged game. Market makers engineer false breakouts, liquidity grabs, and “stop hunts” that wipe out retail accounts in seconds. Breakout Shift Trader flips the script. This MT5 indicator decodes the footprints left by institutional manipulation and aligns your trades with the power brokers driving real price action. Proven Results – Tested, Verified, Relentless N
FREE
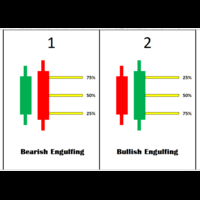
Engulfing Levels Indicator – Smart Entry Zones for High-Probability Trades Overview:
The Engulfing Levels Indicator is designed to help traders identify key price levels where potential reversals or trend continuations can occur. This powerful tool combines Engulfing Candle Patterns , Percentage-Based Levels (25%, 50%, 75%) , and Daily Bias Analysis to create high-probability trading zones . Key Features:
Engulfing Pattern Detection – Automatically identifies Bullish and Bearish Engulf
FREE
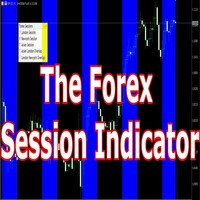
Having trouble marking where the various forex sessions start and end? Or perhaps your strategy requires you trade only in a specific session, then this is for you.
The session indicator shades the session you require in a certain color so that you can identify it easily. The sessions shown include: London session, New York session, Asian Session, Asian - London overlap and London - New York Overlap.
Difference source give varying time ranges for the various session, mostly differing by not m
FREE

MACandleApprox — Moving-Average Approximate Candle Indicator MACandleApprox is a custom indicator that, on the main price chart, applies a selected type of moving average to the open, high, low, and close price series respectively, and replots them as "approximate candles". It does not modify the original candlesticks; instead, it overlays a smoothed candle view based on moving averages, helping traders observe the smoothed price movement and directional changes more intuitively. The indicator s
FREE

Reversal Oscillator — Advanced Momentum Shift Detector
Reversal Oscillator is a free indicator designed to highlight price zones that are statistically outside their normal movement patterns, helping traders anticipate potential turning points before they occur. Unlike traditional oscillators that react mainly to overbought/oversold conditions, this indicator applies third derivative analysis (the "acceleration of the acceleration" of price) calculated using two independent methods within a n
FREE

This is a regression tree indicator for MT4/MT5.
This indicator classificate nodes on the time period so that the deviation becomes smaller,
and displays regression line and channel for each node.
It's free!
Attached CartDemo.ex4 and CartDemo.ex5 is a Demo version and has the following limitations:
Can't use HighSpeed method (default method is RandomForest)
Maximum number of bars is 260 (increase from 200)
There is no expiration date and can be started many times, but it stops after an hour.
FREE
MT5用 サブウィンドウにスプレッドとBUY SWAP(BS)とSELL SWAP(SS)を表示するインジケーターです。
表示の文字フォントの大きさと色の設定、スプレッドの表示をPIPS表示もしくはPOINTS表示切替が可能ですので、チャートの色設定などに合わせて、お好みでご利用いただけます。 サブウィンドウの表示サイズに合わせて、その中央に表示するようになっています。
(ご協力お願いします!) こちらは無料でご利用いただけます。どうぞご自由にご利用ください。 もしよければ MS High Low indicator も紹介していますので、どうぞご参照の上、DEMO版のダウンロードをお試しください!
Happy Trading :)
FREE
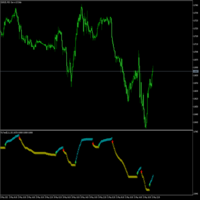
Es un indicador que no se repinta y que muestra la tendencia a corto plazo. contiene lo siguiente: Visual Mode MA Period MA Method MA Price
ATR Period Volatility Factor Offset Factor Use Break Use Envelopes Use Alert
cualquier sugerencia hagamelo saber en los comentarios y también colocar estrellas para postear más contenido, indicadores y advisor actualizadas
FREE

The Phoenix FVG & S&R Toolkit is a professional-grade visual engine designed to pinpoint institutional liquidity and market imbalances with surgical precision. By automating the detection of Fair Value Gaps (FVG) and Support & Resistance (S&R) zones, this tool removes the guesswork from technical analysis and helps you focus on high-probability "Smart Money" setups. The indicator identifies areas where price has moved too quickly, leaving behind "unmitigated" gaps that act as magnets for future
FREE

AGORA RADAR es un monitor gratuito multisímbolo y multi-marco temporal para MetaTrader 5. Escanea todos los símbolos visibles en Market Watch en M1, M5, M15, H1 y D1, mostrando señales activas, antigüedad de la señal, precio y estadísticas recientes de TP/SL. AGORA RADAR es un indicador visual gratuito de monitorización para MetaTrader 5. Escanea todos los símbolos visibles en Market Watch y analiza cinco marcos temporales: • M1
• M5
• M15
• H1
• D1 El panel de radar muestra: • Última señal
FREE

MUD Dynamic Reversal Bands MT5
Professional Multi-Timeframe Dynamic Reversal Zone Indicator
MUD Dynamic Reversal Bands MT5is a professional trading indicator designed to identify high-probability reversal zones directly on the price chart. Using adaptive dynamic bands, it highlights potential support and resistance areas where price is statistically more likely to react, helping traders spot buying and selling opportunities with greater confidence.
Unlike traditional static support and resis
FREE
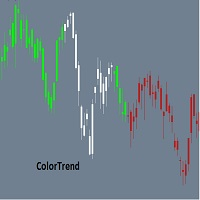
Combining the best of Price Action , Directional Movement , and Divergence / Convergence analysis, the Candle Color Trend is the easy and reliable way to identify the direction of the trend. The indicator automatically paints the candles according to the premise that the upward trend is defined by prices that form a series of ascending tops and bottoms. On the other hand, the downward trend is defined by prices that form a series of descending tops and bottoms.
Color Trend is certainly one of
FREE
Next Arrival : Flip or Die Trading Arena. Flip a trading account: https://flipordie.com/chapter-1-thirteen-doublings-double-a-trading-account/
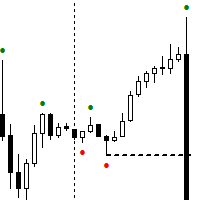
The Expert Advisor for this Indicator can be found here: https://www.mql5.com/en/market/product/115567 The Contraction/Expansion Breakout Lines with Fair Value Gaps (FVGs) Indicator for MetaTrader 5 (MT5) is a powerful technical analysis tool designed to help traders identify and visualize breakouts at critical levels of contraction and expansion in fi
FREE

Detailed blogpost: https://www.mql5.com/en/blogs/post/766378
Key Features
Adaptive Upper/Lower bands Smooth Center Line Customizable Length (sensitivity) Non-Repainting (only current ongoing bar is updated every "Refresh After Ticks" number of ticks) Multiple Price Sources - Choose from close, open, high, low, median, typical, or weighted close Components:
The Basis Line The smooth center line represents the weighted average of price. Think of this as the "true" price level when all the noise
FREE

TrendView — Clear Trend Visualization for Confident Trading
TrendView is a free trend indicator designed to give traders a clean and reliable view of market direction. It displays clear trendlines in three colors, making it easy to identify bullish, bearish, and neutral phases without cluttering the chart with unnecessary elements. Whether you are monitoring long-term market structure or short-term price action, TrendView helps you keep your focus on the bigger picture. For traders who also w
FREE

Chronolines – Temporal Support and Resistance Levels for MetaTrader 5 Introduction to Chronolines
Chronolines is a graphical indicator designed to identify and visualize temporal support and resistance levels using the Highs and Lows of four predefined periods. It is compatible with all assets available on MetaTrader 5 , including stocks, currencies, commodities, indices, and cryptocurrencies, offering a logical and structured approach to tracking market behavior. Lines and Periods
Chronolines
FREE
A flexible BB indicator You're no longer limited to the built in default of using BB off a SMA method, now you can choose from: SMA - SMMA - EMA - LWMA - ADAPTIVE - FRACTAL ADAPTIVE - DEMA - TEMA - VARIABLE INDEX DYNAMIC
You now also have 2 standard deviation levels. A more featured version is available with 5 deviation levels, color gradients to lines and filling as well as candles, with full alerts too: Bollinger Bands Max MT5
Options: - MTF - 9 choices of MA to base the BB off
- 2 adjustabl
FREE

CDS SR Fractal Level: Dynamic Fractal Support & Resistance with Breakout Alerts Overview Tired of manually drawing and updating support and resistance lines? The CDS SR Fractal Level indicator automates this crucial process by intelligently identifying key market levels based on fractals. This lightweight and efficient tool allows you to focus on your trading strategy, not on chart setup, ensuring you never miss an important price level or a potential breakout. This indicator is clean, simple,
FREE

Ultimate Multi-Timeframe Pattern Scanner Dashboard is a high-performance, advanced technical tool designed to automatically scan and identify 14 of the most powerful candlestick patterns simultaneously across multiple currency pairs and timeframes. Built with a highly optimized, timer-driven architecture, this dashboard updates seamlessly without causing platform lag or freezing, making it the perfect scanner for active traders who want to monitor the entire market from a single chart. ️ IMPORT
FREE

Chaikin's volatility indicator calculates the spread between the maximum and minimum prices. It judges the value of volatility basing on the amplitude between the maximum and the minimum. Unlike Average True Range , Chaikin's indicator doesn't take gaps into account. According to Chaikin's interpretation, a growth of volume indicator in a relatively short space of time means that the prices approach their minimum (like when the securities are sold in panic), while a decrease of volatility in a l
FREE

VWAP for IntradayTraders
Session-aware VWAP lines for fast, precise scalps.
Best used with OmniFlow Intraday Trading system : https://www.mql5.com/en/market/product/179364
️ Inputs (MT4/MT5) Enable_Hourly_VWAP: Toggle hourly VWAP. Enable_Asia_VWAP: Toggle Asia session VWAP. Enable_Europe_VWAP: Toggle Europe session VWAP. Enable_NA_VWAP: Toggle North America session VWAP. Enable_Extended_VWAP: Toggle extended session VWAP. Enable_Daily_VWAP: Toggle daily VWAP. Asia Session (GMT)
Session_Asi
FREE
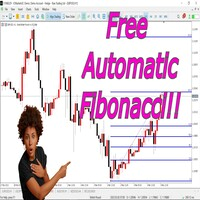
This indicator is an automated version of the Fibonacci retracement (Fib) indicator. Deciding the best areas to use when drawing the fib can be tricky and this indicator was made with that in mind. When you drop it on the chart it will automatically choose the best points to draw the fib with, but in case you aren't satisfied with those regions, you can adjust it as you wish.
FREE

Name: 1-Throw Tweezers Pro Mabrouk Full Description: Capture high-precision market reversals with the 1-Throw Tweezers Pro, a professional Price Action tool designed to identify the elite "Tweezer Top" and "Tweezer Bottom" patterns. Unlike standard indicators, V1.0 uses a strict validation engine to ensure every signal represents a true institutional price rejection. What Makes the PRO Version Different? Dynamic Wick Filter: Detects real price exhaustion by filtering out candles with small wick
FREE

Master SuperTrend for MetaTrader 5 Description Master SuperTrend is a technical indicator developed for MetaTrader 5 to provide a clear visual representation of market trend direction based on price movement and volatility. The indicator uses the classic SuperTrend calculation based on Average True Range (ATR). It combines current price behavior with market volatility to calculate a dynamic trend line that follows price movements on the chart. Trend Analysis Master SuperTrend automatically ident
FREE
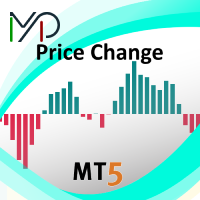
MP Price Change Indicator is a tool to calculate the price movement by percentage. The Value of this indicator can be adjusted to look back of the percent of price change within certain timeframes. This is a powerful tool when used by other indicators as well, such as ATR and ADR, for understanding price fluctuations and tolerance in different strategies. ___________________________________________________________________________________ Disclaimer:
Do NOT trade or invest based upon the analysi
FREE
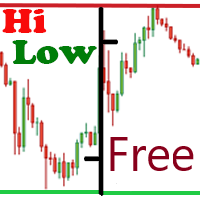
The free version of the Hi Low Last Day indicator . The Hi Low Levels Last Day indicator shows the high and low of the last trading day . The ability to change the color of the lines is available . Try the full version of the Hi Low Last Day indicator , in which additional indicator features are available : Displaying the minimum and maximum of the second last day Displaying the minimum and maximum of the previous week Sound alert when crossing max . and min . levels Selecting an arbitrary audio
FREE

Breakout Bands — Adaptive Scalping & Breakout Retest Indicator Identify Potential Scalping Entries Around Adaptive Volatility Bands Breakout Bands is a specialized intraday scalping indicator designed exclusively for M1-M5 charts . The indicator creates an adaptive band structure around a smoothed 89-period EMA reference , with the band distance derived from the market's ATR-based volatility range . Rather than simply following price, Breakout Bands is designed to help traders identify situatio
FREE

Cyclic Trend is a MetaTrader 5 indicator that presents a confirmed market bias and an adaptive price zone. It processes price data through a proprietary cycle-detection framework and outputs two visual elements: a trend label (BULLISH, BEARISH, or NEUTRAL) and a dynamic channel that appears on the relevant side of price (lower band during bullish phases, upper band during bearish phases). Visual Output A text label in a user‑selectable corner, with customisable font, size, colour, and offset. A
FREE

The Support n Resistance V2 is an advanced technical indicator that automatically calculates and plots highly accurate S/R channels based on Pivot Points . Upgraded with ATR volatility filtering and Smart Classification, this tool not only finds key levels but also analyzes historical price action and tick volume to validate the strength of each zone . Key Features Smart Classification: Automatically analyzes historical wick rejections and price touches to classify levels strictly as Support (S
FREE
> Elevate Your Trading Strategy This free tool is just the beginning. At code4trading , we specialize in developing high-performance indicators and Expert Advisors designed for precision and professional-grade analysis. Looking for more advanced features? Discover our full suite of premium tools, including optimized signals, advanced oscillators, and institutional-grade trading utilities at our official MQL5 store. > Explore the full catalog here: https://www.mql5.com/en/users/pablogx9
FREE

Il Round Number Calculator è un indicatore che disegna automaticamente livelli di prezzo psicologicamente importanti sul tuo grafico. A differenza dei semplici strumenti "Round Number", questo indicatore distingue in modo intelligente tra coppie Forex (pip) e indici/metalli/cripto (punti), per fornire sempre la griglia perfetta. Perché Round Numbers Pro? I trader istituzionali e gli algoritmi spesso piazzano i loro ordini su numeri “tondi”. Questo strumento ti aiuta a individuare immediatamente
FREE

Candle color RSI (Relative Strength Index) indicators change candlestick colors on the price chart to visually show RSI conditions like overbought/oversold levels or bullish/bearish momentum, using colors like red for overbought/bearish and green for oversold/bullish, helping traders spot reversals or strength at a glance without looking at the separate RSI pane. These custom indicators often color candles red above 70 (overbought), green below 30 (oversold), and keep default colors in between
FREE

LZ Fibo Ribbon displays a smooth ribbon of four Exponential Moving Averages (EMAs) calibrated to the popular Fibonacci sequence numbers (21, 34, 55, 89) by default. This combination forms a dynamic band of support and resistance on your chart, making it easy to instantly identify trend direction, momentum, and potential pullback zones.
Feature highlights
- Trend Identification: clearly visualizes the trend direction and strength based on the spacing and order of the moving averages within the
FREE

# MiniBull Report (v1.06) — free
**Your market briefing in a sub-window. MiniBull Report answers the questions an intraday trader asks before every decision — in plain language, in your own time zone, and with the same answers on every chart timeframe.**
*Where is price against the monthly, weekly, daily and 4H trend? How far is it stretched? How much of today's typical range is used? Where are the nearest resistance and support? Is a high-impact event coming? What speaks for a long, what spe
FREE
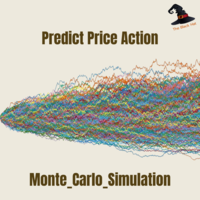
Monte Carlo simulation is an Indicator that uses a Monte Carlo model to calculate the probability of the price going up or down. If the price has a probability of going up or down more than 90%, the system will enter a trade by doing a back test of gold assets. It was found that it was able to generate a return of more than 20% in a period of 5 months while having a MAX DD of less than 7%.
What is a Monte Carlo simulation?
A Monte Carlo simulation is a model used to predict the probability of
FREE

Aprire una posizione quando lo spread si è ampliato in modo impercettibile costa più del previsto, e questo è facile da trascurare quando si osserva solo il grafico di un singolo simbolo.
Phoenix Spread Panel mostra una tabella in tempo reale degli spread di più simboli contemporaneamente, con un codice colore che li contrappone alla media di ciascun simbolo, in modo che un ampliamento dello spread sia visibile prima di inserire l’ordine.
Come garantisce la visibilità dei costi di spread
FREE

Win Streak Size Creep Mirror legge esclusivamente lo storico delle operazioni già chiuse del proprio conto e conta un solo schema: aprire una nuova posizione durante una serie di vincite, con un lotto superiore al proprio volume abituale. Lo strumento non prevede nulla e non dà alcun consiglio. Ogni numero nel pannello è qualcosa che è già accaduto su questo conto.
Come vengono costruiti i numeri: legge fino a 31 giorni di operazioni chiuse su tutti i simboli e tutti i magic number - è una foto
FREE

Alligator Window Indicator : Potencialize suas análises no MetaTrader com o Alligator Window. Este indicador coloca o clássico Alligator de Bill Williams em uma janela separada, permitindo uma visualização mais clara e organizada. Ideal para traders que buscam precisão e eficiência em suas operações, o Alligator Window proporciona insights nítidos e facilita a identificação de tendências sem poluir o gráfico principal. Experimente agora e leve suas estratégias de trading a um novo patamar!
FREE
Il MetaTrader Market è un negozio online unico di robot di trading e indicatori tecnici.
Leggi il promemoria utente di MQL5.community per saperne di più sui servizi unici che offriamo ai trader: copia dei segnali di trading, applicazioni personalizzate sviluppate da freelance, pagamenti automatici tramite il Sistema di Pagamento e il MQL5 Cloud Network.

Ti stai perdendo delle opportunità di trading:
- App di trading gratuite
- Oltre 8.000 segnali per il copy trading
- Notizie economiche per esplorare i mercati finanziari
Registrazione
Accedi
Accetti la politica del sito e le condizioni d’uso
Se non hai un account, registrati