Guarda i video tutorial del Market su YouTube
Come acquistare un Robot di Trading o un indicatore
Esegui il tuo EA
hosting virtuale
hosting virtuale
Prova un indicatore/robot di trading prima di acquistarlo
Vuoi guadagnare nel Market?
Come presentare un prodotto per venderlo con successo
Indicatori tecnici per MetaTrader 5 - 117
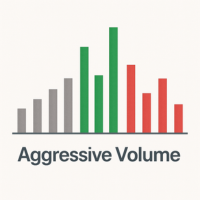
Aggressive Volume Real Tick + Media Mobile Opzionale Aggressive Volume Real Tick + Media Mobile Opzionale è un indicatore professionale che identifica i volumi aggressivi di acquisto e vendita analizzando la struttura delle candele e il volume reale o di tick. Permette ai trader di visualizzare chiaramente dove si trovano le pressioni più forti nel mercato, facilitando decisioni rapide e precise. Come funziona?
L’indicatore analizza il rapporto tra il corpo della candela e il suo intervallo t

TrendFusion Pro — strumento di analisi dei trend TrendFusion Pro ti aiuta a organizzare il lavoro sui grafici e semplifica la ricerca dei punti di ingresso. Elimina il rumore del mercato e mostra solo segnali chiari basati sul suo sistema di analisi integrato. Funzionalità:
Segnali visivi con frecce per individuare potenziali punti di ingresso.
Notifiche e avvisi integrati.
Analisi multi-timeframe per filtrare i segnali deboli.
Valutazione della forza del trend per decisioni più consapev
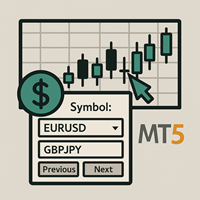
Chart Changer – Switch Symbols with One Click Boost your trading efficiency by quickly switching between multiple charts without hassle. This lightweight indicator displays customizable buttons for your favorite symbols, letting you jump between charts instantly with a single click. Key Features: Supports a flexible list of symbols you can set up in seconds Customizable button design (colors, font size, spacing) Works seamlessly on any chart timeframe Saves time and improves workflow for active

Visual Trend Reversals — Professional Trend Reversal Indicator for MetaTrader 5 Visual Trend Reversals is a modern and efficient indicator for MetaTrader 5, specifically designed for the timely identification of trend reversal points and analysis of market conditions on any instrument: forex, cryptocurrencies, stocks, indices, and commodities.
The indicator is optimized to improve entry quality, minimize false signals, and maximize clarity for traders of any experience level. Key Advantages of V
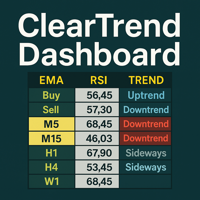
ClearTrend Dashboard Indicator V2.0 — Multi-Timeframe Trend Scanner
ClearTrend Dashboard Indicator V2.0 is an indicator for MetaTrader 5 that displays market trends across multiple timeframes in a single dashboard. It combines exponential moving average and relative strength index analysis to provide a clear and rapid overview of market conditions. if you do not understand how to use technical support via product feedback or the MQL5 messaging system.
Key Features Multi-timeframe analysis: M1,

Directional Trend Line — Directional Trend Indicator for MetaTrader
**Directional Trend Line** is a professional tool for traders that allows you to:
* Accurately determine the current market trend * Timely detect phase shifts in market structure * Clearly visualize the dominant price movement direction
### ** Key Features **
#### 1. ** Automatic Adaptation to Any Timeframe **
* Automatically adjusts the CCI period for M1…MN * Enables optimal sensitivity across different timeframes *

Trend TD Ultimate — The All-in-One Trend Indicator for MetaTrader Trend TD Ultimate is a modern, all-in-one trend indicator for MetaTrader 5. It combines advanced trend-following logic, smart price pattern analysis, and integrated trade evaluation features — all in one powerful tool. It is built for traders who need accuracy, flexibility, and visual clarity — on forex, stocks, indices, commodities, and crypto . Key Features & Benefits 1. Multi-Purpose Trend Signal Engine Generates Buy and

The Second-Level Tick Candlestick Generator is a professional-grade MT5 indicator tool specifically designed for high-frequency trading and short-term scalping. It can convert raw tick data into highly customizable second-level candlestick charts in real-time, helping traders accurately capture micro-market fluctuations and optimize entry and exit timing. This tool provides clear chart displays, allowing you to more intuitively identify price action patterns and improve trading decision efficien

Watermark – Marca D'Água para MetaTrader 5 O Watermark é um indicador visual elegante e funcional projetado para exibir uma marca d'água centralizada no gráfico do MetaTrader 5. Ele mostra automaticamente: Símbolo atual (ex: EURUSD) Timeframe ativo (ex: H1) Nome completo do ativo (opcional) Ideal para traders que desejam personalizar visualmente seus gráficos com informações importantes, mantendo o espaço de negociação organizado e informativo. Principais Recursos: Marca d'água centralizada At

AltoX Capital Spirol Indicator brings professional‐grade, pattern‐based signals to your MT5 charts in a single, easy-to-use tool.
Advantages & Key Benefits • Clear, Actionable Signals Automatically plots buy/sell arrows when your custom Spirol pattern completes on a closed bar—no guessing whether a signal is valid. • Built-In Trend Filter • Automatic Reference Levels Draws Retracement lines for quick visual pullback targets. • Real-Time Alerts Popup alerts in MT5 plus mobile push noti

PRECISION ENTRY MASTER INDICATOR Get In At The Perfect Price - Every Single Time ENTER THE MARKET AT THE MOST PROFITABLE MOMENTS Tired of buying the top and selling the bottom? Discover the SECRET to entering trades at the EXACT perfect timing - where institutional money flows and retail traders get liquidated. This isn't just another indicator... it's your gateway to professional-level entry precision. PERFECT ENTRIES = MAXIMUM PROFITS PINPOINT MARKET REVERSALS Catch the EXACT mom

Trend Continuity — Advanced Trend Detection Indicator for Professional Trading Trend Continuity is a highly accurate, non-repainting trend indicator designed to identify and confirm trend continuation with precision. Built on a dynamic moving average system enhanced with trend-strength logic, it provides traders with reliable entry signals while filtering out flat or noisy market phases.
Optimized for both manual and automated strategies, this indicator offers clear directional signals and is

**Volume Trend Navigator** is a modern volume-based trend indicator that spots when market momentum is accelerating or fading by analyzing volume and recent price swings over three bars:
* **Bullish acceleration**: Draws an ↑ arrow when the current bar’s volume exceeds that of the two preceding bars **and** price closes above the previous bar’s high—signaling a strengthened up-trend. * **Bearish acceleration**: Draws a ↓ arrow when the current bar’s volume exceeds that of the two preceding bar

SymbolPro is a smart indicator for new generation traders Switch it over. Control it. Earn money. We present SymbolPro, which is not just an indicator, but an intelligent control center for your trading. Designed for those who trade multiple assets and value every second.
What does SymbolPro do?
Instant switching between financial instruments right from the chart — without unnecessary clicks, without exiting the session. Customize the buttons for your assets: EUR/USD, XAU/USD, BTC/USD, indi

Indicator “Tempest” for MQL5 Market (SEO-optimized, in English)
1. Introduction The Tempest indicator is a modern technical tool for MetaTrader 5 designed to automatically detect market reversal points by analyzing RSI across multiple timeframes.
Provides clear BUY/SELL signals that allow traders to react instantly to market conditions.
Easily integrates into Expert Advisors for fully automated trading.
SEO Keywords: Tempest, RSI indicator, MQL5 trading robot, Forex automation, RSI strategy

TDI PRO DIRECTX – STRUMENTO DI MISURAZIONE DIRETTA DEL MOMENTUM SUL PREZZO
Il mercato fluttua costantemente, richiedendo ai trader punti di ingresso precisi, SL ristretti e alti tassi di vincita.
TDI PRO DIRECTX è stato progettato per misurare e riflettere il momentum del mercato direttamente sul prezzo, ottimizzando i punti di ingresso e la gestione del rischio. PROBLEMI REALI CHE I TRADER AFFRONTANO
Gli indicatori isolati come RSI, EMA e Bollinger spesso generano segnali rumorosi, rendendo dif
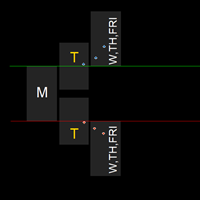
Monday Range Breakout Indicator
## **Scan Markets in Seconds**
**Are you always feeling overwhelmed analyzing endless charts to find potential trade setups?** This indicator does the heavy lifting for you by instantly highlighting Monday's accumulation range and directional bias - giving you the edge to anticipate daily candle direction.
## **Why Would You Love This Tool**
**Quick Market Scanning**: Instantly see which pairs have established clear Monday ranges and established direct

Equilibrium — Multi-Timeframe CCI Reversal Indicator for MetaTrader 5 Equilibrium is a powerful technical indicator for MetaTrader 5, built on the Commodity Channel Index (CCI) to automatically detect potential market reversal points.
Designed for both manual traders and automated strategies, Equilibrium delivers precise BUY/SELL signals, adapting to changing market conditions in real time. Easily integrates into any MQL5 Expert Advisor for full automation.
SEO Keywords: CCI indicator,
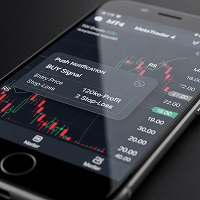
Nirvana Trend — Indicatore di trend e framework di rischio basato su ATR Nota: Questo strumento fornisce esclusivamente informazioni analitiche e non garantisce, promette né suggerisce profitti, redditi o risultati specifici (incluso il superamento di valutazioni/challenge). La decisione d’uso e la responsabilità restano all’utente. Introduzione
Nirvana Trend è un indicatore di analisi tecnica progettato per standardizzare il processo decisionale e migliorare la disciplina operativa. Grazie a s

INDICATOR: GEN TradeZones Developer: gedeegi General Description GEN TradeZones is a price action-based indicator that automatically identifies key market areas using price swing and volatility (ATR) patterns. It is designed to detect potential BUY or SELL entry points based on price breakouts from a dynamically calculated average zone. This indicator is suitable for breakout, reversal, or mean reversion strategies for both intraday and swing trading. Key Features Automatic detection of supply

INDICATOR: GEN SignalBunker Developer: gedeegi General Description GEN SignalBunker is an indicator designed to identify strong trading signals after the market has gone through a period of consolidation (sideways). This indicator automatically detects "ranging" market conditions using two selectable methods: the ADX method or the Volatility method. Once a ranging condition is detected, the indicator waits for a breakout signal from its dynamic channel. When a breakout occurs, it generates a cl

Title: DS Candle Painter – Clean Trend Candles with Smoothed MA Logic Description: DS Candle Painter is a lightweight and effective indicator that paints traditional Japanese candles based on a Smoothed Moving Average trend filter. Instead of replacing the candles with custom bars, this tool simply colors the standard candles : Green when the price closes above the Smoothed MA Red when the price closes below This makes it ideal for: Trend visualization without clutter Combining with
Smart Zone Pro is an advanced support and resistance indicator that automatically identifies key market levels and provides high-probability trading opportunities. Unlike static S&R levels, this intelligent system creates dynamic channels that adapt to market volatility using sophisticated ATR-based calculations. Key Features: Smart Channel Detection : Automatically identifies the strongest support and resistance zones based on recent price action ATR-Based Precision : Uses Average True Range to

Introducing MACD Enhanced — an improved MACD (Moving Average Convergence Divergence) indicator that gives traders expanded capabilities for analyzing trend and momentum in financial markets. The indicator uses the difference between fast and slow exponential moving averages to determine momentum, trend direction, and strength, generating clear visual signals for potential entry and exit points.
Attention! For best results, it is recommended to adapt the indicator parameters to specific trading i

The MQL5 code you provided is for an MT5 indicator. Here is a description or "bio" for this indicator, written in a clear and engaging style, as if for a trading community or a marketplace listing. Sofi Spike Zone Indicator (M5 & M15) The Sofi Spike Zone Indicator is a powerful yet simple tool designed to help traders identify potential supply and demand zones on the M5 and M15 timeframes. Created with a focus on precision and clarity, this indicator highlights key price rejection areas where in

Globex Range Levels – Gold Edition Market Focus: XAUUSD / Gold / Futures-style Assets m5-m15
Designed For: Day Traders, Scalpers, Institutional-Level Strategies What is Globex Globex is the electronic trading platform operated by CME Group, enabling nearly 24-hour trading of futures and options across global markets. It runs outside traditional U.S. trading hours and is commonly referred to as the overnight session . In trading, the term "Globex session" typically refers to the period between th
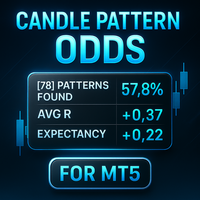
Il **Dashboard delle Probabilità dei Modelli di Candele** è un indicatore intuitivo per analizzare e visualizzare in tempo reale le statistiche dei principali modelli di candele. Questo strumento rileva modelli come Engulfing, Cambio di Carattere (CHOCH), Squilibrio, Pin Bar e Inside Bar, presentando le loro metriche di performance in un pannello personalizzabile sul grafico. I trader possono ottenere informazioni sulla affidabilità dei modelli, tassi di vincita e rapporti rischio-rendimento, r
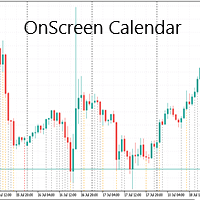
Onscreen Calendar uses the Metatrader calendar events and displays them automatically right on the screen within the range of days of your choice. With many factors influencing every trade, it is easy to lose sight of what truly moves the market, so having the calendar visible at all times can greatly help. You will also save a lot of time understanding how different types of news, such as moderate impact news, affect the market. You have total control of the content to display on your screen.

Questo indicatore è progettato per i trader che operano con le regole rigorose dei conti di prop trading e richiedono un monitoraggio trasparente di rischi e limiti. Lo strumento è esclusivamente informativo, non interviene nelle operazioni e aiuta a mantenere il focus sull’analisi e sull’esecuzione del piano di trading. Caratteristiche principali Monitoraggio del drawdown giornaliero e totale: calcola e mostra con precisione limiti e valori correnti in un pannello chiaro sul grafico; sai sempr
Chart Switcher Pro: One-Click Symbol & Timeframe Panel with Countdown Timer Tired of manually clicking through dozens of charts and timeframes? Streamline your technical analysis and never miss an opportunity with Chart Switcher Pro! This powerful and lightweight indicator adds a clean, professional, and fully customizable on-chart panel to your MT5 terminal. With a single click, you can instantly switch between any symbol in your Market Watch or a custom list, and jump to any timeframe you need

AI Trend Breakout Radar – Smart Institutional Flow Tracker Indicator Overview
This AI-powered trend breakout indicator leverages big data analysis and machine learning to detect institutional order flow in real time. Designed for forex traders, it identifies high-probability breakout opportunities during peak trading sessions (London/New York), helping you align with "smart money" movements. Key Features
AI-Generated Signals Bullish Breakout : Red upward arrow (customizable) Bearish Breako
Migliora la tua precisione nel trading con l'Ultimate Confluence Signal Indicator MT5, una potente suite multi-indicatore che sincronizza segnali da oltre una dozzina di strumenti tecnici provati per setup ad alta probabilità in forex, CFD, criptovalute e commodities. Ispirato ai principi fondamentali del trading di confluence —pionierati negli anni '90 da esperti come Alexander Elder nel suo sistema "Triple Screen"— questo indicatore ha guadagnato popolarità tra i trader che cercano di sovrappo

tak.WPR Pro is a powerful enhancement of the classic Williams %R oscillator.
It adds modern visual tools and a robust output buffer for EA integration. Highlights: Clean line representation of Williams %R. Customizable overbought/oversold levels. Visual zones with persistence detection (optional). Optional smoothed line (SMA, EMA, SMMA, LWMA). Signal buffer for EA usage (state: overbought, oversold, neutral). Clean rendering, customizable visuals. EA-Ready : A dedicated buffer outputs sign

Bande di Bollinger Auto-Ottimizzate – Strumento adattivo di volatilità basato sul comportamento reale del mercato Questo indicatore avanzato per MT4 trova automaticamente i migliori periodi e deviazioni standard simulando operazioni sui dati storici. Invece di parametri fissi, si adatta dinamicamente ai cambiamenti del mercato e alla struttura dei prezzi per creare bande che riflettono più accuratamente la volatilità in tempo reale. Nessuna regolazione manuale necessaria. Funzionalità principali
Trend Pilot
Indicator for the mt5 platform, can be used solely for trading, best combined with other indicators Developed, tested and used with an EA/Algo with no issues. Products on chart arrow for entry signal or setup/entry with retrace
Features: Sell and Buy arrows Visual and sound alert Trend continuation / Early trend change signal All time frames, non repaint, fast loading
Usage: This Indicator can be used with most asset groups, low spread products can used min 5 timeframe and low

Adaptive EMA Complete System Intelligent Self-Optimizing Moving Average System WHAT THE INDICATOR DOES The Adaptive EMA Complete System is an advanced indicator that manages 4 exponential moving averages with periods that automatically adapt to market conditions. Unlike traditional static EMAs, this system continuously analyzes historical performance and optimizes periods to maximize signal effectiveness in real-time. ️ HOW THE SYSTEM OPERATES Intelligent Optimization Engine The syste

GEN TrendPivot Hunter Developer: Gede Egi Overview GEN TrendPivot Hunter is a multifunctional indicator for MetaTrader 5. It combines Pivot-based Support & Resistance, Fair Value Gaps (FVG), and Trendlines into one analytical tool. The indicator helps visualize possible price reaction areas and market structures directly on the chart. All drawing styles, alerts, and notifications can be customized through the input parameters. The tool does not generate trading signals automatically; it is inte

TRI Visualizer MT5 – Thermodynamic Market Analysis Overview
The TRI (Thermal Range Indicator) Visualizer Enhanced is a rare market analysis indicator that goes beyond conventional technical analysis, applying principles of thermodynamics from physics. It interprets market price fluctuations as “thermodynamic energy,” enabling the highly accurate detection of subtle market changes that are often overlooked. Innovative Mechanisms 1. Dual Calculation Engines Classic TRI Mode Formula: |Close

- Come funziona? Concetto di base Si tratta di un indicatore di breakout di range che identifica i periodi di consolidamento (range) e genera segnali quando il prezzo esce da questi intervalli. Può operare sia in modalità trend che mean reversion. Componenti chiave: 1. Identificazione dell'intervallo Periodo di intervallo : definisce una finestra temporale specifica per ogni giorno di negoziazione (ad esempio, dalle 10:00 alle 12:00) Calcolo dell'intervallo : Durante questo periodo, l'in
This Indicator is inspired by the popular beat the market maker indicator from MT4.
Now you can utilize it for MT5 use.
Opening Range Breakout (ORB) Indicator for MT5 – Product Description Overview
The Opening Range Breakout (ORB) Indicator for MetaTrader 5 is designed to give traders a clear and instant view of the most important price action of the day — the opening range. It automatically marks the high and low of the first minutes or hours you choose, helping you see where the market is
Inspired by the popular beat the market maker Multi MA.
Now available for MT5 to be utilized.
Multi Exponential Moving Average (Multi-EMA) Indicator for MT5 The Multi-EMA Indicator is designed to help traders visualize multiple exponential moving averages on one chart with precision and clarity.
It plots five customizable EMA lines, each with distinct colors, making it easy to identify market trend direction, strength, and potential reversal zones at a glance. Key Features: Plots five indepen
Inspired again by beat the market makers CrossOver indicator
Now available and FREE for MT5
CrossOver Arrow – Multi EMA Edition
This indicator plots precise Buy and Sell arrows directly on your chart whenever a crossover occurs between short-term and long-term Exponential Moving Averages (EMAs) . It’s designed for traders who prefer clear visual signals without unnecessary clutter. Key Features: Detects bullish and bearish crossovers between customizable EMA periods. Displays easy-to-read arr
TRAGOS Indicator – The GOAT of All Trading Indicators TRAGOS (Greek for “male goat”) isn’t just a name — it’s the GOAT: Greatest of All Time in trading indicators.
Designed for Forex, Indices, Gold, Crypto, and Deriv Synthetic Indices (Boom & Crash, Volatility 75, Step, Jump, etc.), it gives you non-repainting buy, sell, and exit signals with unmatched clarity. Why TRAGOS? Non-Repainting Signals – 100% reliable.
Audible, Email & Push Alerts – Never miss a trade.
Trend Following – Rid
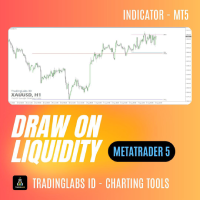
Draw On Liquidity (DOL) – PDHL, PWHL & Kill Zones Liquidity levels often act as magnets for price movement. The highs and lows of the previous day (PDHL) and week (PWHL) are key reference points where stop orders and institutional activity tend to cluster. Identifying these levels manually is time-consuming and prone to error. The Draw On Liquidity (DOL) indicator automatically plots these essential levels on your chart and highlights high-probability trading windows through session kill zones.

Quantum Support Resistance Pro: Advanced Market Level Indicator Revolutionize Your Technical Analysis Quantum Support Resistance Pro is a cutting-edge trading tool that automatically identifies critical market levels, giving you the professional edge without manual effort. Perfect for all traders looking to enhance their technical analysis with precise, real-time support and resistance detection.
Key Advantages Time-Saving Automation - Automatically plots key levels - no more manual d

Una media mobile intelligente, codificata a colori, con smoothing professionale, notifiche chiare e supporto multi-timeframe, progettata per i trader di tutti i giorni.
## In parole povere, ecco cosa fa: - Traccia una linea media mobile sul grafico. - La linea cambia colore a seconda della direzione. -Blu = Tendenza al rialzo - Rosso = Tendenza al ribasso -Giallo = Opaco/Neutro - Invia una notifica quando cambia la direzione della linea (facoltativo). - Lavorare ent

Lot Size Calculator – Calcolatore Dimensione Lotto Questo indicatore calcola la dimensione del lotto in base alla percentuale di rischio scelta e alla distanza dello stop loss. È adatto a Forex, metalli, indici, materie prime e criptovalute.
Caratteristiche principali Calcolo della dimensione del lotto in base al saldo e al rischio % Modalità ordine a mercato e ordine pendente Linee visive sul grafico: ingresso, stop loss e take profit Visualizzazione del rapporto rischio/rendimento Regolazion
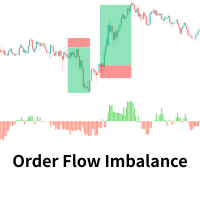
Order Flow Imbalance Indicator Description The Order Flow Imbalance Indicator is a technical analysis tool that measures the imbalance between bullish and bearish order flow over a specified period. This indicator helps traders identify prevailing market sentiment and potential reversal points. How It Works The indicator analyzes order flow for each candle: Bull Order Flow – volume of candles where the closing price is higher than the opening price (green candles) Bear Order Flow – volume of can
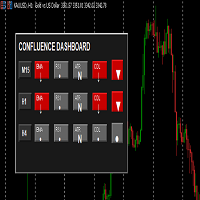
Panoramica Questo indicatore MT5 crea una dashboard di trading professionale che analizza simultaneamente 4 indicatori tecnici chiave su 3 timeframe (M15, H1, H4) per identificare opportunità di trading ad alta probabilità attraverso l'analisi di confluenza.
1. Analisi del trend EMA (Media Mobile Esponenziale) 2. Analisi del momentum RSI (Indice di Forza Relativa) 3. Analisi della volatilità ATR (Average True Range) 4. Analisi del pattern a candela (CDL) Design ottimizzato per dispositivi mobi
Analisi della Distribuzione dei Drawdown – Strumento Professionale di Valutazione del Rischio
L’indicatore Drawdown Risk Profiling offre una diagnosi dei rischi completa e statisticamente solida direttamente su MetaTrader 5. Progettato per trader, gestori di portafoglio e analisti quantitativi, applica metodologie di livello accademico per misurare, interpretare e controllare con precisione il rischio di trading. Base Accademica
Basato su teorie finanziarie e ricerche empiriche di riferimento:
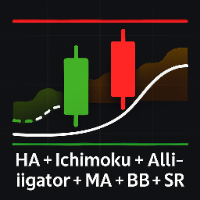
Indicatore Combinato: Heikin Ashi + Ichimoku + Alligator + Media Mobile Personalizzata + Bande di Bollinger + Supporto/Resistenza Questo indicatore riunisce diversi strumenti tecnici ben noti in un unico pannello, offrendo una visione completa del mercato in modo ordinato e senza sovraccaricare il grafico. Componenti inclusi Candele Heikin Ashi con cambio di colore in base alla forza del segnale. Ichimoku completo : Tenkan‑sen, Kijun‑sen, nuvole (Senkou Span A/B) e Chikou Span. Alligator : linee

INDICATOR: GEN Quantum Divergence Developer: gedeegi General Description GEN Quantum Divergence is an advanced technical indicator designed to automatically detect divergence signals. Unlike typical divergence indicators that use standard oscillators, GEN Quantum Divergence utilizes a unique RSI of Momentum calculation, making it highly sensitive to upcoming changes in trend strength. This indicator not only identifies and displays bearish and bullish divergence formations on the chart but also

Cambia simbolo + Linea di tendenza – Porta il tuo trading al livello successivo! Non è più necessario cercare ogni simbolo manualmente! Il nostro Cambia simbolo mostra automaticamente tutti gli asset dal Pannello dei simboli . Cambiare l’ordine o rimuoverli è molto semplice – basta regolare nella finestra Ctrl+M e farà il resto. Scopri subito lo stato delle tue operazioni: In profitto – verde In perdita – rosso Ordine pendente – SlateGray Simbolo attivo corrente – blu Inoltre, Linee di ten

1. INFORMAZIONI GENERALI Nome Indicatore: BullBear Display Versione: 1.00 Sviluppatore: [Il Tuo Nome] Società: MT5TOOLSLAB Tipo: Indicatore di Grafico Mercato: Forex, Azioni, Futures, Criptovalute 2. DESCRIZIONE BullBear Display è un indicatore visivo che mostra in tempo reale: Forza dei tori (compratori) Forza degli orsi (venditori) Dominanza del mercato (chi controlla il prezzo) L'indicatore mostra queste informazioni nell'angolo superiore sinistro del grafico, consentendo un'an
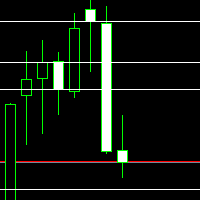
Daily Key Levels Indicator
Spot the market’s key price levels from the daily session at a glance!
This indicator automatically plots the important daily price levels , helping you quickly identify strategic zones for entries and exits. Features: Automatic display of important daily market levels. Fully customizable : Choose the number of levels to display. Set the line color to match your personal or chart style. Works on all instruments and all timeframes (Forex, indices, commodi

IL Allerta tendenza Donchian è un filtro di analisi tecnica progettato per misurare oggettivamente forza del trend, bias di mercato e segnali di inversione utilizzando i principi di Breakout del Canale di Donchian . Questo indicatore monitora l'azione dei prezzi rispetto a un canale del periodo definito dall'utente (predefinito: 10 barre), generando frecce visive e avvisi in tempo reale quando significativo conferme di breakout o camb

Quantum Trend Master Pro Enhanced - AIgo-Powered Trend Analysis System Quantum Trend Master Pro Enhanced is a professional trading indicator designed for MetaTrader 5, providing advanced trend analysis and high-precision signal generation using multiple algorithmic approaches. Key Features & Benefits Advanced Algorithmic Analysis Kalman Filtering Technology: Adaptive noise reduction for signal clarity Multi-Timeframe Analysis: Comprehensive market view across all timeframes Fractal Dimension An
Introduction: The Basic Automatic Swing Detector MT4 is designed exclusively for the MetaTrader 5 platform. It displays three different market levels, helping traders identify critical price zones and pinpoint the most optimal entry and exit points for their chosen symbols.
Our Team Services: If you are want to see our products click the link: LINK If you have an idea you'd like to develop into an application, click the link: LINK
Category: Platform: MetaTrader 5 Type: Indicator Level: Interme
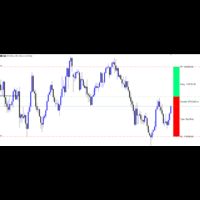
Pending Order SL/TP Visualizer
This MetaTrader 5 indicator makes trade planning crystal clear by displaying Stop Loss (SL) and Take Profit (TP) levels directly on your chart for all pending orders. Features: Instantly see SL and TP placement before orders trigger ️ Works with Buy/Sell Limit and Stop orders Color-coded lines for easy identification Updates automatically with order modifications Perfect for precision entry planning and risk management

Headline: Stop Guessing, Start Winning. Unleash the Power of the Heiken Ashi Supertrend Indicator. Body: Are you tired of market noise, confusing charts, and missed opportunities? The Heiken Ashi Supertrend Indicator is the ultimate tool designed to bring clarity and confidence to your trading, once and for all. We've combined two of the most powerful concepts in technical analysis into one seamless, easy-to-use indicator: Crystal-Clear Trends with Heiken Ashi: Say goodbye to choppy price action

Introduction = Universal Trendline Breakout Strategy MT5 = Questo indicatore MT5 è una strategia professionale di breakout su linee di tendenza per Meta Trader 5. Analizza la struttura del mercato e genera segnali BUY SELL su rotture confermate. Riduce la soggettività del disegno manuale.
Why use this Tool - Elimina errori nel tracciamento manuale - Identifica BUY SELL basati su struttura - Filtra falsi breakout con conferma di chiusura - Migliora la lettura del mercato - Supporta analisi disc

Supertrend Catcher (MT5 Indicator) A clean, visual “smart structure” indicator that helps you spot momentum shifts fast.
It draws recent Order Blocks (OB) with Break of Structure (BOS) , a dynamic baseline (support/resistance), entry/SL/TP suggestions , and a compact info panel . It now includes real-time alerts (terminal/push/sound) when a fresh signal appears. Why traders like it Clear structure at a glance: BOS lines + filled OB zones show where price imbalanced and where it may return. Act

EA DOCUMENTATION
#property copyright "ISP Trading System" #property link "" #property version "1.00" #property strict #include <Trade/Trade.mqh> #include <Trade/SymbolInfo.mqh> #include <Trade/PositionInfo.mqh> input double InpLotSize = 0.1; input int InpStopLoss = 200; input int InpTakeProfit = 400; input ulong InpMagicNumber = 2024; input bool InpCloseOnOpposite = true; input string InpSignalPrefix = "I

Screens realtime- https://t.me/ +rEuJQo8zHLllMzgy Signals.Metals.etc
This tool is designed to detect anomalies in market trading activity. It analyzes price movements and volumes to identify moments of unusually strong buying or selling pressure. Such periods are often followed by a cooling phase or consolidation, providing traders with valuable reference points for decision-making.
The indicator requires no complex setup and is suitable for both experienced traders and beginners.
Screensho

XAUUSD Supertrend Orderblock (MT5 EA) Built specifically for Gold (XAUUSD) and the way it moves.
This EA blends a Supertrend-style momentum filter with Order Block + Break of Structure (BOS) logic to catch impulsive continuation and clean mean-reversions on gold’s volatility. KINDLY LEAVE A REVIEW AND GET ONE OF MY PAID EAs for free It doesn’t chase candles. It waits for structure to break, confirms with impulse/ATR , optionally checks for Fair Value Gaps , then places a rules-based entry with S
Screens realtime- https://t.me/ +rEuJQo8zHLllMzgy in Signals.Metals.etc
VI Calculator is a professional MetaTrader 5 indicator that analyzing volume at the moment. This synergy allows traders to evaluate both the strength of market movements and overbought/oversold conditions at the same time. The indicator automatically processes market data and provides clear trading signals directly on the chart in the form of arrows and text recommendations. It is ideal for identifying entry and exit p
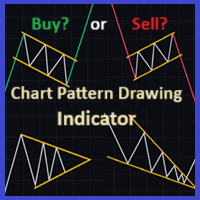
Description of the "GraphicPatternsBuilder" Indicator Principle of Operation and Advantages: The indicator automatically plots support (green) and resistance (red) lines on the chart, identifying key price levels. Works on any asset (cryptocurrency, stocks, Forex) and all timeframes.
Key Advantages: 1. Automation of Routine Work – The indicator independently identifies significant extrema and draws lines. 2. Two Construction Algorithms : - Type 1 : Line is built using two

Fusion Trend – Multi-Signal Indicator
Fusion Trend (Alpha Trend) is an advanced technical indicator designed to identify market trends and provide automated buy and sell signals. It combines ATR, RSI, MFI, and trend-following logic for technical analysis on any timeframe.
Features:
• Alpha & Offset Lines – visualize the main trend and its offset. • Buy & Sell Signals – automatic arrows appear when trend changes are detected. • Adaptive ATR Filter – adjusts sensitivity based on market vol

Overview
Market Session & Bar Counter displays bar numbers on your chart while highlighting major trading sessions with semi-transparent overlays. Perfect for traders who need to track bar progression and monitor session activity simultaneously.
Key Features Bar Counting Numbers each bar from the start of the trading day Customizable display intervals (show every bar or every Nth bar) Milestone highlighting for important bar numbers Real-time countdown timer showing time until next bar Weeken

Mario Order Block Indicator Overview
The Professional Order Block Indicator is an advanced technical analysis tool that automatically identifies and displays institutional order blocks on your chart. Based on smart money concepts, this indicator helps traders identify high-probability support and resistance zones where institutional traders have placed significant orders. Key FeaturesAutomatic Order Block Detection Identifies bullish and bearish order blocks based on pivot point analysis Uses so
Il MetaTrader Market è un negozio online unico di robot di trading e indicatori tecnici.
Leggi il promemoria utente di MQL5.community per saperne di più sui servizi unici che offriamo ai trader: copia dei segnali di trading, applicazioni personalizzate sviluppate da freelance, pagamenti automatici tramite il Sistema di Pagamento e il MQL5 Cloud Network.
Ti stai perdendo delle opportunità di trading:
- App di trading gratuite
- Oltre 8.000 segnali per il copy trading
- Notizie economiche per esplorare i mercati finanziari
Registrazione
Accedi
Se non hai un account, registrati
Consenti l'uso dei cookie per accedere al sito MQL5.com.
Abilita le impostazioni necessarie nel browser, altrimenti non sarà possibile accedere.