 MetaTrader 5
 Experts
 Indicatori
 librerie
 Utilità
 Widget
 Regole
Guarda i video tutorial del Market su YouTube
Come acquistare un Robot di Trading o un indicatore
Esegui il tuo EA
hosting virtuale
hosting virtuale
Prova un indicatore/robot di trading prima di acquistarlo
Vuoi guadagnare nel Market?
Come presentare un prodotto per venderlo con successo
Indicatori tecnici per MetaTrader 5 - 167
 I segnali degli indicatori tecnici giocano un ruolo cruciale nell'apertura e nella chiusura delle transazioni sui mercati azionari e Forex. L'essenza degli indicatori è una trasformazione matematica del prezzo di un simbolo finanziario, finalizzata alla previsione dei cambiamenti futuri dei prezzi. Prova gli indicatori tecnici, per prevedere al meglio il comportamento del mercato e ricavarne dei guadagni.

AutoLevels – Rilevamento intelligente di supporti e resistenze AutoLevels è un indicatore avanzato che identifica automaticamente le zone chiave del mercato utilizzando i dati del grafico in tempo reale. Analizza i punti di swing (massimi e minimi locali) , la volatilità del mercato (ATR) e le reazioni ripetute del prezzo per individuare livelli di supporto e resistenza affidabili. Basato su: Swing High e Swing Low con sensibilità regolabile (LeftBars e RightBars) Larghezza dinamica delle

AutoLevelsPro — un indicatore che analizza i dati di prezzo e segna automaticamente zone di supporto e resistenza .
È stato progettato appositamente per funzionare su timeframe bassi , in particolare sul grafico a 15 minuti , dove il mercato mostra le reazioni più dinamiche. Dati utilizzati: High — prezzo massimo della candela Low — prezzo minimo della candela Close — utilizzato per il calcolo dell’ATR Timestamp di ogni candela per posizionare correttamente le zone ️ Processo di

Smart Risk Manager Pro – Trada con fiducia trascinando sul grafico Smart Risk Manager Pro è uno strumento professionale di gestione del rischio sul grafico che calcola la dimensione della posizione in base al tuo rischio in dollari. Ti basta cliccare e trascinare sul grafico e l’indicatore mostra immediatamente: Direzione (Buy / Sell) Distanza in punti Lotto consigliato in base al valore di RiskUSD Lo strumento è ultra leggero, estremamente veloce ed è pensato per i trader che vogliono un grafic

Red and Green Light – Intelligent Trading Signal Indicator Product Overview Red and Green Light is a professional trading signal indicator based on the multi-stage T3 smoothing algorithm. It integrates a visual traffic light system, intelligent signal recognition, risk alerts, and multiple notification features. Whether you're a manual trader or an Expert Advisor (EA) developer, this indicator helps you capture market opportunities with greater precision and effectively avoid the risks of

Comprehensive Trading Analysis Tool This tool has four main parts that help traders understand the market and manage risk in a simple way 1 Risk and Reward Visual Tool It shows two boxes on the chart a pink box for risk and a navy blue box for reward It shows the risk to reward ratio You can move and resize the boxes It shows pips and possible money for risk and reward It gives a clear picture of possible profit and loss It helps plan trades before entering It keeps risk levels consistent It hel

King Smart Liquidity MT5 è un indicatore analitico avanzato progettato specificamente per tracciare i flussi di denaro istituzionali e le grandi banche nel forex, oro, indici, Bitcoin e altri mercati. Questo indicatore è stato sviluppato sulla base della metodologia "Smart Money Concept", che si basa sulla comprensione dell'azione del prezzo, delle zone di liquidità e di come si comportano le principali istituzioni finanziarie nel mercato. Questo indicatore non si limita a disegnare linee o zon
What It Does for xauusd only Finds Order Blocks (ANN + SMC) on big and small timeframes. Marks them with clean bullish/bearish zones. Drops arrows (blue = BUY, red = SELL) right inside each block. Shows an info panel on the right with the exact high/low of the newest blocks. Lets you change chart colors (background, bull candle, bear candle) instantly. How To Use It Drop the indicator into MQL5/Indicators → restart MT5. Add it to your chart. In the settings: Pick your background , bull candle ,

Moving Polynomial Regression The Moving Polynomial Regression indicator provides traders with a statistically robust and adaptive method for identifying the true trend, predicting immediate momentum shifts, and filtering market noise. Unlike traditional moving averages that simply lag the price, this tool fits an optimal polynomial curve to the market, giving you a dynamic and predictive view of price action. Key Advantages Superior Noise Filtering: Uses advanced mathematical techniques
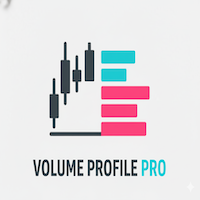
Indicatore Volume Profile Pro Questo indicatore è lo strumento Volume Profile Pro , che aiuta ad analizzare "a quale prezzo avviene la maggiore attività di trading". Presenta le seguenti capacità speciali: Modalità di Visualizzazione (Display Modes) Volume Profile (Normale): Mostra il volume totale degli scambi (Total Volume) a ogni livello di prezzo per identificare zone chiave di supporto e resistenza. Delta / Money Flow: Mostra la "differenza" tra pressione di acquisto e vendita (Buy vs Sell)

Estensione TradingView Porta gli strumenti di disegno e analisi in stile TradingView direttamente sul tuo grafico MetaTrader Utilizza grafici illimitati senza restrizioni della piattaforma Crea e gestisci avvisi illimitati basati su condizioni personalizzate Usa indicatori popolari in stile TradingView all’interno di MetaTrader Dopo l’acquisto, riceverai una cartella aggiuntiva con indicatori e guida all’installazione Introduzione
Trading View Extension è un indicatore professionale progettato

SISTEMA DI PUNTEGGIO DI MERCATO – Indicatore Avanzato Multi-Timeframe Sistema professionale di analisi del mercato che combina indicatori tecnici, modelli di machine learning e conferme multi-timeframe per generare segnali di trading estremamente accurati. CARATTERISTICHE PRINCIPALI Analisi Multi-Timeframe:
Conferma dei segnali su diversi timeframe (M5, H1) per una maggiore probabilità Motore di Punteggio Intelligente:
Calcolo di trend, range e incertezza analizzando le ultime 25 candele Rilev

LiquidZones Pro automatically detects and visualizes supply and demand zones on your chart. By analyzing swing highs and lows over a configurable lookback period, the indicator highlights critical areas where price has historically reacted. Key Features: Automatic detection of supply (resistance) and demand (support) zones. Configurable lookback period , swing strength , and zone width . Zones merge automatically if price levels are close, keeping charts clean. Minimum touch filter to avoid wea
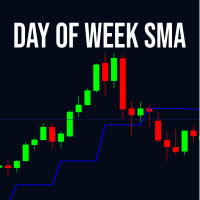
L'indicatore SMA del Giorno della Settimana calcola una media mobile basata sui prezzi di chiusura di un giorno specifico della settimana scelto dall'utente. Supporta vari tipi di medie mobili tra cui Semplice (SMA), Esponenziale (EMA), Smussata (SMMA) e Ponderata Lineare (LWMA). Il periodo definisce quante istanze del giorno selezionato includere nel calcolo. Questo strumento è utile per analizzare i pattern settimanali nei mercati finanziari, aiutando i trader a identificare trend specifici di
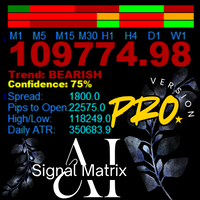
AanIsnaini Signal Matrix MT5 PRO - Bayesian Multi-Timeframe Dashboard "Advanced multi-timeframe dashboard with Bayesian Learning, real-time Signal Strength, and persistent memory. The older it runs, the smarter it becomes."
The free version (v1.3) gave you visibility. The PRO Version gives you the edge . AanIsnaini Signal Matrix MT5 PRO is a sophisticated multi-timeframe analysis system that combines classical technical indicators with adaptive probabilistic reasoning. Designed for serious tra
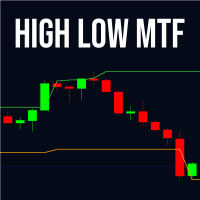
High Low MTF – Massimi e Minimi Multi-Timeframe High Low MTF è un indicatore professionale che consente ai trader di visualizzare potenti aree di supporto e resistenza basate sui massimi e minimi di qualsiasi timeframe. Mostra questi livelli provenienti da periodi più alti o più bassi direttamente nel grafico corrente, fornendo una visione completa del mercato su più timeframe. È adatto per scalping, day trading, swing trading e anche per sistemi algoritmici tramite iCustom. L’indicatore identif

BUY and SELL smart The BUY and SELL Smart Indicator is a next-generation trading tool engineered for precision scalpers, intraday strategists, and professional analysts who demand both speed and clarity in market visualization. It seamlessly integrates smart candle-based analytics, adaptive ATR logic, and real-time economic event awareness — giving you a fully synchronized view of market volatility and momentum. Through an elegant and optimized interface, FlashScalp delivers instant signal fee

Fine Timeframes è un indicatore di timeframe sub-minuto per MT5. Crea grafici con intervalli da 1 a 30 secondi, consentendo di accedere a movimenti di mercato che rimangono invisibili sui grafici minuti e orari, pur mantenendo la piena funzionalità di trading: è possibile aprire e chiudere posizioni proprio come sui timeframe standard. Fine Timeframes funziona solo su tick live e non è progettato per Strategy Tester: scarica la versione demo e prova l'indicatore in condizioni di mercato reali su
Squeeze Momentum Alert 1. Identifica i Punti di "Esplosione" del Prezzo (The "Squeeze") Il vantaggio principale è la capacità di catturare i momenti di "consolidamento" prima di un grande movimento. Perché è utile: Lo strumento ti dice: "Il grafico si sta comprimendo, preparati al prossimo scatto" , assicurandoti di non perdere l'inizio di un trend. 2. Distingue la "Forza" del Trend (Color Coded Momentum) L'istogramma usa 4 colori : Verde Lime (Lime): Rialzo forte. Verde Scuro (Dark Green): Rial

Engulfing Signal Pro is a powerful and lightweight MQL5 indicator designed to deliver high-probability market entries based on candlestick Engulfing patterns combined with advanced internal calculations. This indicator is built for traders who demand accuracy, clarity, and speed—without repainting. Key Features Smart Engulfing Detection
Automatically detects bullish and bearish Engulfing patterns using strict candle-body rules, ensuring that only meaningful price reversals trigger signals. Mult

RSI Divergence PRO (Non-Repaint) – MT5 Indicator Overview
RSI Divergence PRO automatically detects Bullish and Bearish Divergence between price and RSI and plots clear arrows on the chart. The indicator is 100% non-repainting because signals are generated only after pivot points are fully confirmed.
This is one of the most reliable reversal detection tools used by both beginners and professional traders. ------------------------------------------------------------------ -------------------
This is MT5 version only. For MT4 visit: https://www.mql5.com/en/market/product/156000/
Detailed blog post with screenshots: https://www.mql5.com/en/blogs/post/765529
Features Overview Bull and Bear Power Visualization: Histograms or Lines or Bands Combined Bull/Bear Power (BBP) Mode: To see the net power balance Customize Colors: for instant pattern recognition Smoothing (Optional): reduces noise for cleaner signals Additional Filter Options: Price Divergence visualization to spot potential
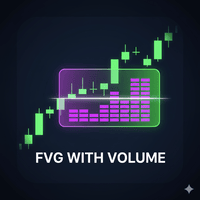
FVG Volume Profile (Institutional Price Action) Unlock the hidden liquidity inside Market Imbalances. The FVG Volume Profile is an advanced Price Action indicator that goes beyond standard Fair Value Gap detection. It looks inside the gap using lower timeframe data to construct a Volume Profile specifically for that imbalance. This helps you identify exactly where the "Smart Money" is defending positions. Key Features: Internal Volume Profile: Automatically scans lower timeframes
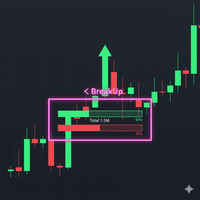
Breakout Boxes with Volume Pressure This indicator automates the identification of key consolidation zones (Supply and Demand) based on Market Pivots and Volatility (ATR). Unlike standard support/resistance tools, this indicator provides a unique Volume Pressure Analysis inside every box, giving you insight into the battle between Buyers and Sellers before a breakout occurs. Key Features Automated Supply & Demand Zones: Automatically detects significant Pivot Highs and Lows to draw dyna
Trend Duration Forecast It utilizes a Hull Moving Average (HMA) to detect trend direction and statistically forecasts the probable duration of the current move based on historical market behavior. Key Features Smooth Trend Detection: Uses the Hull Moving Average (HMA) to filter noise while minimizing lag, providing clean Bullish/Bearish signals. Real-Time Duration Counter: Displays a dynamic label at the start of the current trend showing the "Real Length" (number of bars the trend has b

Spot high-impact reversal zones with precision. This indicator highlights candles where the wick exceeds a customizable percentage of total candle length — a key signal of price rejection and potential turning points. Features include: • Wick ratio filter (e.g. wick > 50% of candle length) • Minimum candle length threshold (in pips) • Real-time chart arrows for upper/lower wick dominance • Optional alerts for fresh wick signals Perfect for traders who rely on candlestick psychology to a

Nadaraya-Watson Envelope Indicator for MT5 Overview
This indicator expands on the original Nadaraya-Watson smoothing methods by introducing a dynamic envelope system built using kernel regression. Unlike the standard Nadaraya-Watson estimator, this tool applies a contrarian approach: the envelope boundaries are designed to identify potential reversal zones when price extends too far from its smoothed trend estimate. The indicator includes integrated alerts based on price crossings above or belo

Trade in the Footsteps of the Institutions The SMC Institutional Order Flow indicator brings the power of professional trading strategies directly to your MetaTrader 5 terminal. Based on the core principles of Smart Money Concepts (SMC) , this advanced tool automatically maps the key levels and structures used by banks and large institutions to move the market. Stop guessing and start seeing the market through the lens of order flow. This all-in-one suite identifies where institutions have
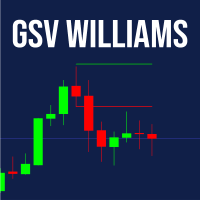
GSV – Guided Swing Value Levels Il GSV – Guided Swing Value Levels è un indicatore esclusivo sviluppato per i trader che desiderano individuare aree di prezzo in cui il mercato tende a reagire con maggiore precisione statistica.
Il suo calcolo è ispirato ai concetti presentati da Larry Williams nel libro “Long-Term Secrets to Short-Term Trading” , dove viene evidenziata l’importanza della media statistica degli swing del mercato per prevedere zone in cui il prezzo probabilmente si fermerà, corre
Multi Pivot Pro — 5 Pivot Methods in One Indicator (MT5) Multi Pivot Pro draws daily pivot levels on your MetaTrader 5 chart using five different calculation methods. Switch between methods from a single dropdown — no need to install five separate indicators. Pivot points are widely used support and resistance levels that help traders plan entries, exits and stop placement. Pivot methods Classic Fibonacci Camarilla Woodie DeMark (DM) Features Pivot (P), resistance R1–R3 and support S1–S3 levels

Link to our products: https://www.mql5.com/en/users/alireza.saeedian/seller TradeX candlestick indicator is one of the leading indicators in the market. you can show/hide any pattern with one click or you can change the setting from setting tab.
If you don't have any information about candle stick pattern you can watch it from my YouTube channel. This indicator will be updated day by day.

Uncover Institutional Footprints with Volume-Based Supply & Demand Liquidity Zones is a sophisticated Price Action and Volume analysis tool designed for MQL5. Unlike standard Support & Resistance indicators that rely solely on price history, this indicator integrates Volume Volatility Analysis to identify high-probability reversal levels. It automatically detects key Swing Highs and Swing Lows where significant trading activity (volume) occurred. In Smart Money Concepts (SMC), these areas r
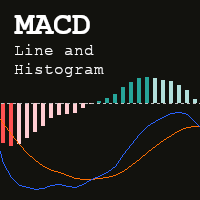
The MACD Line and Histogram is an enhanced version of the classic Moving Average Convergence Divergence (MACD) indicator. While the traditional MACD consists of two lines—the MACD (Main) line and the Signal line —the extended version introduces a Histogram that visually represents the difference between these two lines. Inputs Fast MA method (Simple, Exponential, Smothed or Linear weighted) Fast MA period Slow MA method (Simple, Exponential, Smothed or Linear weighted) Slow MA period

Multi Indicator Scanner — 10 Indicators, One Panel (MT5) Multi Indicator Scanner reads 10 popular technical indicators at the same time and shows each one as BUY, SELL or NEUTRAL in a single on-chart panel, together with an overall summary. Instead of loading and checking ten indicators one by one, you see the full picture in one place. Indicators analyzed RSI (Relative Strength Index) Stochastic %K CCI (Commodity Channel Index) ADX (Average Directional Index) MACD Moving Average Williams %R Mom

TouchGuard Alert – Advanced Price Alert & Notification Indicator for MetaTrader 5 (MT5) TouchGuard Alert is a fast, lightweight, and highly accurate price-touch Alert & Notification system designed for MetaTrader 4 (MT4) and MetaTrader 5 (MT5) . It automatically sends real-time Alerts, Pop-Up Alerts, Email Notifications, Push Notifications and early-warning notifications when price touches or approaches your chart objects. Key Features (High-Precision Alert & Notification System) Comprehensive P

Adaptive RSI is an advanced Relative Strength Index indicator. Adaptive RSI can change the look back period dynamically based on current market condition. Adaptive RSI adapts to the market changes as much as possible. Adaptive RSI is more advanced than conventional RSI.
Adaptive RSI is a tool to catch more over-bought/sold opportunities!
Features Dynamic look back period - Adaptive RSI changes the look back period dynamically basing on smartly designed adaptive methods. No worry about RSI peri
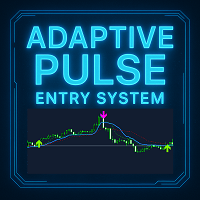
Adaptive Pulse - Sistema Professionale di Segnali di Trading Descrizione Breve Adaptive Pulse è un indicatore professionale di segnali di trading basato sulla tecnologia di analisi adattiva del mercato. L'indicatore si adatta automaticamente alla volatilità e genera segnali precisi di acquisto e vendita con frecce visive sul grafico. Funziona su tutti i timeframe e strumenti finanziari. Caratteristiche Principali L'indicatore fornisce un sistema di analisi a tre livelli con tre linee adattive in

Point and Fignure (P&F) chart plots price against changes in direction by plotting a column of Xs as the price rises and a column of Os as the price falls.
Features Support for several kinds of price types - High/Low and Close. Clean and easy-to-read chart. Displays column high and low prices as indicator values. Support for both 4 and 5-digit brokers. Customizeable colors.
Advantages Filter insignificant price movements and noise. Less noise and more stable work. Focus on important price move
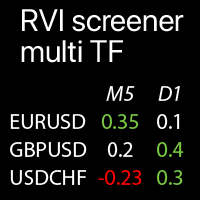
Valori RVI multi-timeframe sui Simboli selezionati: confronta le tendenze attuali del mercato L' indicatore mostra i valori dell'Indice di Vigore Relativo (RVI) da tutti i timeframe e Simboli selezionati in una singola tabella , che ti consente di analizzare rapidamente le tendenze attuali dei prezzi di mercato . La mia utilità multifunzionale : 66+ funzionalità | Contattami per qualsiasi domanda | Versione MT4 Ogni Simbolo può esse
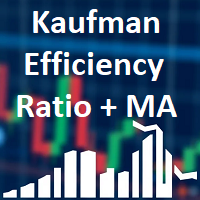
Shows Kaufman Efficiency Ratio value and smoothed by MA. Calculation is based on movement divided by volatility on a specified period. Levels are adjustable as well as visualization. Parameters: KERPeriod - period for ratio calculation. EMAPeriod - period for moving average. Shift - indicator shift. HigherLevel - low value of the higher zone. LowerLevel - high value of the lower zone. ShowHigherZone - allow higher zone drawing. HigherZoneColor - higher zone color. ShowLowerZone - allow lower zon

TradeEasy Panel - Professional Trading Control Panel Overview TradeEasy Panel is a comprehensive, professional-grade trading control panel designed for MetaTrader 5. This powerful indicator provides traders with an all-in-one solution for executing trades, managing positions, and monitoring market activity directly from the chart window. With its intuitive interface and advanced features, it streamlines the trading process for both novice and experienced traders. Key Features Real-Time Market M
Session Range Pro – Professional Session & ADR Analytics for MetaTrader 5 See what really moves the market – by session, by day, with stats that actually matter. What is Session Range Pro? Session Range Pro is a professional-grade MetaTrader 5 indicator that highlights the true behavior of price during the three main trading sessions: Asia London New York It draws clean, color-coded session ranges directly on your chart, and powers them with deep statistics : average session range, breakout win

Gamma & Volatility Levels Pro [XAUUSD Edition] – The indicator used by professional gold traders in 2025 Fully automatic indicator developed exclusively for XAUUSD (Gold). Displays in real time the most powerful institutional levels that move gold price every single day: • HVL (High Volatility Level) – Orange dashed line Dynamic extreme volatility level (20-period SMA + 1 standard deviation). Gold bounces or breaks this level 87 % of sessions with moves of +$40 to +$120. • CALL RESISTANCE – Blue
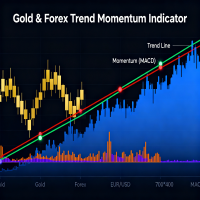
Overview QuantumEdge Oscillator is the ultimate momentum and trend detection tool for serious traders. After extensive testing and refinement, this professional indicator delivers reliable signals across all market conditions and timeframes. Used by discretionary traders and algorithmic systems worldwide. Advanced Algorithm The indicator employs a sophisticated dual-layer approach: Primary Engine : Exponential moving average applied to RSI for smooth momentum tracking Volatility Adjustment : Smo
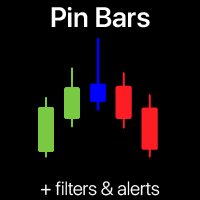
Scanner del modello Pin Bar | Avvisi intelligenti e filtro di tendenza Non perdere mai più un'inversione Pin Bar ad alta probabilità! Questo scanner automatizzato del modello Pin Bar fa il lavoro pesante per te.
Questo strumento di trading scansiona i tuoi grafici in tempo reale, identifica il potente modello Pin Bar (Martello/Stella cadente) e ti invia segnali immediati. L'indicatore di trading è progettato sia per trader principianti che esperti che vogliono sfruttare la potenza della pura a

HolyGrail M N/B: All our product purchase comes with our free ‘’DAILY SCALPER EA’’ - bit.ly/4qlFLNh Whatsapp Developer for yours after successful purchase
m ost wanted Edition Overview ATTENTION ALL TRADERS!
FINALLY UNVEILED: The "HolyGrail MostWanted" Indicator - Your All-in-One Institutional Trading Dashboard for MetaTrader 5
SPECIAL BONUS (VALID TILL JUNE 2026)- OUR DAILY SCALPER EA for BTCUSD and VIX75 •·································································•
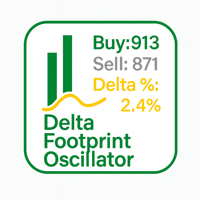
Delta Footprint Oscillator – Professional Order Flow Tool for MT5 The Delta Footprint Oscillator is a powerful order-flow indicator that lets you see buy/sell pressure directly inside your chart. It tracks micro-price movements tick-by-tick and calculates real-time Delta , Delta% , and a full per-bar footprint history .
Perfect for scalpers, day traders, volume/flow traders, and anyone who wants deeper insight into market aggression. Key Features Real order-flow delta from tick-based bid/ask m
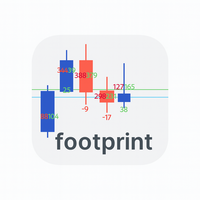
Footprint_Indicator_Fixed is a lightweight yet powerful footprint tool designed for traders who want real-time insight into market microstructure.
This indicator displays buy/sell tick counts and delta values directly on each candle, helping you instantly see which side of the market is dominant. Key Features ️ Real-time tick-based buy/sell volume counting ️ Delta footprint displayed underneath each candle ️ Clean and simple on-chart text objects—no buffers, no clutter ️ Automatic management
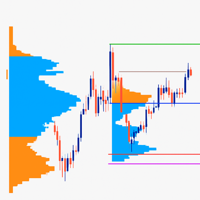
Daily Volume Profile (Multi-Day) for MT5 This indicator provides a clean, fast and highly optimized Daily Volume Profile for the last N days , updated automatically every minute without flickering or chart lag.
It draws full market structure: POC, VAH, VAL, Value Area, Day High/Low, Volume Distribution Buckets , and adapts dynamically to any timeframe using built-in shifting logic. Key Features:
Volume Profile for the last N days (configurable)
True daily POC, VAH, VAL with automatic labels
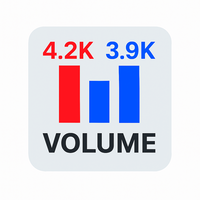
Volume Display Indicator – Clean and Powerful Volume Visualization This professional MT5 indicator displays tick volume as a color-coded histogram and automatically adds clear volume labels above each bar for the current trading day. Rising candles are painted blue, falling candles red, giving you instant insight into market strength and momentum. Key Features: Colored volume histogram (blue/red) Automatic volume labels for each bar of the current day Smart scaling for perfect readability Auto-c

SMART STRUCTURE – Analisi della Struttura del Mercato e SMC per MT5 Comprendi la struttura del mercato. Identifica le principali zone di prezzo. SMART STRUCTURE è un indicatore di analisi visiva per MetaTrader 5, progettato per identificare la struttura del mercato, le rotture confermate, gli Order Blocks e i Fair Value Gaps (FVG). Organizza queste informazioni direttamente sul grafico e integra un pannello di controllo che consente di monitorare la direzione del mercato e i livelli di prezzo ri
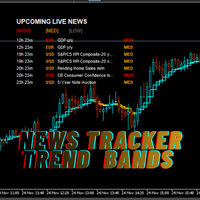
Price Following Trend Indicator with Live Economic News Filter
Overview Price Following Trend Indicator is a professional MetaTrader 5 indicator designed to help traders visualize market direction while staying aware of important economic news events. The indicator combines an intelligent moving average trend ribbon with a built-in live economic calendar, allowing traders to monitor market conditions without leaving the chart. It is suitable for Forex, Gold, Indices, Commodities, and other C

This indicator will help traders quickly identify inside bars, which are often used in price action trading strategies as potential consolidation or continuation patterns. An inside bar formation is a counter trend candle on both sides as it didn't break the previous candle high or low.
Key feature: Identify inside bars in real-time. Colours inside bars while keeping normal bars. Configurable history bars. Optional pop-up alerts and phone notifications with symbol name and time of detection. W
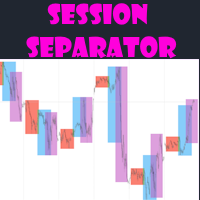
Session separator indicator draws boxes for each trading session to show the trader open and close hours with its high and low.
Key features: Option to set hours and colours for 3 trading sessions. Boxes update immediately when breaking out of high/low. Hour shift or auto time zone. Choose the amount of days to draw session boxes. Indicator works on H1 and lower for visibility. Choose border style
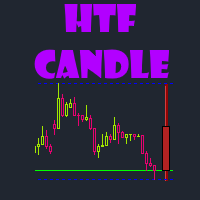
HTF Candle helps traders by drawing selected higher timeframe candle on your open chart.
This way it is easier to manage your bias without having to switch time frames which costs time. Key features: Select the higher time frame to retrieve data from. Enter the amount of candles to draw Personalize the drawn candle colours Optional horizontal lines for high and low Works on any time frame
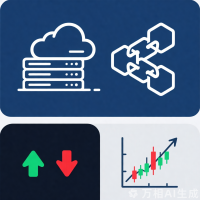
Product Name: Combined KD Enhanced Multi-Signal Stochastic Indicator Core Benefits: - **Signals in 1 Glance**: Red (buy) / green (sell) arrows + dual curves; auto-marked 20/80 overbought/oversold zones – no complex math needed. - **All-Market Fit**: Default KD(9,3,3); customizable settings work for stocks/forex/futures (any MT5 timeframe: M1-MN1). - **Lag-Free Performance**: 20% faster than official MT5 Stochastic – smooth loading even on large historical datasets.
Key Features: - Intui
FRAMA Matrix Pro is a multi-layer trend and momentum intelligence panel designed for traders who demand clarity, precision, and confirmation before entering the market.
The system combines several advanced filters into one clean, informative dashboard: FRAMA Trend Engine (fast adaptive trend detection) Dual EMA Bias Structure (20 & 200) ADX Strength Filter RSI Directional Bias Force Index Volume-Price Power ATR Candle Structure Analysis Fractal Dimension (D) Noise Filter Stochastic PRO Logic FRA

Buyer Seller Balance Analyzer offre una panoramica completa della forza di acquirenti e venditori su diversi timeframe. Componenti principali: Tabella Buyer/Seller Balance Mostra il rapporto tra acquirenti e venditori Copre i timeframe da M1 a MN1 Valori codificati a colori (verde = acquirenti, rosso = venditori) Metriche chiave: Buyers (%) – Percentuale di acquirenti Sellers (%) – Percentuale di venditori ️ Balance – Differenza tra acquirenti e venditori Strength –

SuperTrend Pro MT5 - The Ultimate Trend Following System
For MT4 version : https://www.mql5.com/en/market/product/156454
Unlock the full potential of the SuperTrend indicator on MetaTrader 5. Designed for traders who need precision and performance. SuperTrend Pro MT5 is a next-generation trading system built for the modern trader. It combines the classic SuperTrend with advanced Multi-Timeframe (MTF) analysis and smart filtering to identify high-probability setups on the MT5 platform. Why Sup
The Trend Duration Forecast MT5 indicator is designed to estimate the probable lifespan of a bullish or bearish trend. Using a Hull Moving Average (HMA) to detect directional shifts, it tracks the duration of each historical trend and calculates an average to forecast how long the current trend is statistically likely to continue. This allows traders to visualize both real-time trend strength and potential exhaustion zones with exceptional clarity. KEY FEATURES Dynamic Trend Detection: Utiliz

Nebula Trend Nebula Trend è un indicatore di inversione di tendenza semplice progettato per identificare con precisione potenziali punti di svolta del mercato. L'indicatore genera chiari segnali di frecce di acquisto e vendita direttamente sul grafico, rendendo facile individuare quando la tendenza è probabile che si inverta. Che tu sia un principiante alla ricerca di segnali di trading semplici o un trader esperto alla ricerca di conferme di inversione affidabili, Nebula Trend fornisce la chiar

Si tratta di una versione aggiornata regolarmente, ricompilata e ampliata per le attuali build di MT5.
I mercati valutari si muovono in termini relativi. Una configurazione EURUSD apparentemente forte può fallire se l’euro si sta indebolendo in generale, oppure avere successo solo perché il dollaro sta perdendo terreno ovunque altrove. Analizzare una coppia in modo isolato significa trascurare tale contesto.
Currency Strength Suite offre una visione strutturata e in tempo reale della forza re
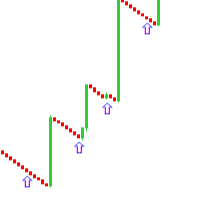
LES PIDO POR FAVOR QUE CUANDO ADQUIERAN EL PRODUCTO SE COMUNIQUEN CONMIGO PARA DARLES LOS PARÁMETROS CORRECTOS
Este indicador de trading funciona en los pares de índices sintéticos; Boom 1000, boom 900, boom 600, crash 1000, crash 900, crash 600 , en la temporalidad de M1 y este indicador es mas preciso con indicador y para obtenerlo te puedes comunicar al 0967713191 te obsequiare dos indicadores por la compra de este. Este indicador sirve para cazar picos y si quieres mas precisión y confian
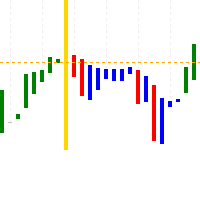
L3 Banker Fund Flow Trend Oscillator v5 is a simple translation of blackcat's work from pine script (language used by TradingView platform) to mql5. It generates buy and sell signals when two calculated buffers cross over each other in the oversold and overbought oscillator territory. Current version does not offer any changable inputs, but could be easily added in the modified version if requested.

BOS and CHoCH Detector is an indicator designed to detect BOS (Break of Structure) and CHoCH (Change of Character) within the Smart Money Management strategy. It helps traders get a clearer view of the market on the chart and optimize their trading strategy. An additional advantage of this indicator is its color system: Green : signals a high probability of a buy opportunity. Red : signals a high probability of a sell opportunity. This tool is perfect for gaining clarity and confidence in your t

VISUAL THEME SWITCHER PRO v3.2
Professional chart theme switcher for MetaTrader 5 with advanced features and multi-language support.
KEY FEATURES: • 9 Professionally Designed Themes • Drag & Drop Panel Interface • Multi-language Support (5 languages) • 7-Day Fully Functional Trial • Fullscreen Mode Toggle • Auto-Generated Theme Buttons • Professional Security System • Position Restoration • One-Click Theme Application
PROFESSIONAL THEMES INCLUDED: 1. NEON - Futuristic black and gree

Indicator shows balance curves based on magic number for portfolio analysis. It allows to visually estimate different strategies performance on a single symbol. Any of magic number can be hidden by clicking on the value in legend. Parameters: HideAllOnStart - all magics are hidden and can be activated by clicking on its value; MAMode - shows average profit from trades; MAPeriod - Moving average period; Magics - a string with magic numbers separated by comma like "1,2,123". If this field is empty

VIP Scalper è un indicatore professionale di scalping Forex progettato per trader che necessitano di segnali precisi, stop-loss ridotto e alta stabilità.
L’indicatore è ideale per operare su M1 e offre ottime prestazioni su coppie volatili con spread basso. Vantaggi principali Segnali di scalping altamente accurati Stop-loss 2–3 pips, take-profit fino a 10 pips Pochi falsi segnali grazie al filtro di trend Logica semplice con un solo parametro principale Funziona su EURUSD, GBPUSD, AUDUSD, EURJ

Overlay higher timeframe candles onto the lower timeframe candles for both live time trading and back testing to see how higher timeframe candles are formed with lower timeframe candles. Helps traders to see the multi timeframe alignment between timeframes in each moment to find refined entry within market structure. Give the trader a full view of price across all timeframes by just looking at one timeframe.

Fast Multi-Timeframe Pivots – Precision Levels from M1 to W1 • Ultra-fast pivot detection across M1–W1
• Clean, stable architecture with zero repaint
• Perfect for breakout, trend, and reversal strategies
• Automatic color-coded levels for instant clarity
• Works on all assets: Forex, Crypto, Metals, Indices
• Lightweight design – ideal for real & prop-firm trading Fast Multi-Timeframe Pivots (M1 to W1) A high-performance pivot indicator designed for professional traders, automated systems, and

Key Features Visual Risk/Reward Planning Spawns interactive rectangles on the chart for Buy and Sell setups. Pink Box: Represents your Risk (Entry to Stop Loss). Green Box: Represents your Reward (Entry to Take Profit). The Green box automatically adjusts its size based on your preferred Reward Ratio (e.g., 1:2). Auto-Lot Calculation Automatically calculates the correct Lot Size based on your Account Balance and defined Risk Percentage. Takes into account the symbol's Tick Value and Cont
Sai perché MetaTrader Market è il posto migliore per vendere strategie di trading e indicatori tecnici? Non c'è bisogno di pubblicità o di protezione del software, nessun problema di pagamento. Tutto ciò è fornito da MetaTrader Market.

Ti stai perdendo delle opportunità di trading:
- App di trading gratuite
- Oltre 8.000 segnali per il copy trading
- Notizie economiche per esplorare i mercati finanziari
Registrazione
Accedi
Accetti la politica del sito e le condizioni d’uso
Se non hai un account, registrati