Guarda i video tutorial del Market su YouTube
Come acquistare un Robot di Trading o un indicatore
Esegui il tuo EA
hosting virtuale
hosting virtuale
Prova un indicatore/robot di trading prima di acquistarlo
Vuoi guadagnare nel Market?
Come presentare un prodotto per venderlo con successo
Indicatori tecnici per MetaTrader 5 - 105

Trend Following with Adaptive Weighted Average (AWA) Indicator The Adaptive Weighted Average (AWA) indicator is is a powerful technical analysis tool designed to provide highly accurate trading signals across various symbols and timeframes. This indicator leverages a unique Adaptive Weighted Average (AWA) calculation, combining multiple moving averages with user-defined weights, and incorporates advanced filtering techniques to minimize noise and whipsaw signals. The indicator is particularl
【R】【Y】【M】 【R】【Y】【M】 【R】【Y】【M】
The Linear Regression Channel Indicator is a powerful technical analysis tool that helps traders capture price trends and potential reversal points. By calculating and displaying linear regression channels, bands, and future projections, this indicator offers an in-depth perspective on market dynamics. It aids in identifying overbought and oversold conditions, trend direction, and provides clear visual cues for potential future price movements.
STILL ON I
Il Brilliant Reversal Multicurrency Scanner MT5 è uno strumento potente progettato per aiutare i trader a monitorare più coppie di valute e timeframe utilizzando l'indicatore Brilliant Reversal. Questo scanner semplifica l'identificazione di potenziali inversioni di mercato fornendo scansioni in tempo reale e avvisi direttamente da un cruscotto centralizzato. Che tu stia negoziando coppie principali, minori o esotiche, questo strumento offre una copertura completa del mercato e impostazioni pe

Candlestick Pattern Scanner Dashboard MT5 è uno strumento potente per monitorare i modelli di candlestick su più coppie di valute e timeframe. Organizza i modelli rilevati in un formato a griglia, mostrando la forma breve del modello e quante candele fa è apparso (ad esempio, BUEN(3) per un modello di Bullish Engulfing rilevato tre candele fa). Puoi trovare la versione MT4 qui: CandleStick Patterns Multicurrency Scanner MT4 Per documentazione dettagliata clicca qui Documentation Link Caratte

Ichimoku Multicurrency Scanner Dashboard MT5 è uno strumento di trading potente progettato per monitorare più coppie di valute e timeframe utilizzando l'Ichimoku Kinko Hyo. Organizza i segnali in un formato a griglia, con simboli raggruppati per valute di base e timeframe, da M1 a MN1. I trader possono abilitare o disabilitare timeframe specifici per adattarsi alle loro strategie. Lo strumento mostra segnali basati sulle seguenti strategie: Kijun Cross Strategy: Segnali generati quando il prezz

Parabolic SAR Multicurrency Scanner Dashboard MT5 è uno strumento di trading completo progettato per monitorare più coppie di valute e timeframe utilizzando l’indicatore Parabolic SAR (PSAR). Organizza i segnali in un formato a griglia, mostrando lo stato di ogni simbolo nei timeframe da M1 a MN1. I trader possono abilitare o disabilitare timeframe specifici in base alle loro strategie, garantendo un’analisi di mercato mirata ed efficiente. La versione per MT4 è disponibile qui: Parabolic SAR Mu
RSI Multicurrency Scanner Dashboard MT5 è uno strumento di trading potente progettato per monitorare più coppie di valute e timeframe utilizzando l’Indice di Forza Relativa (RSI). Organizza i segnali in un formato a griglia, mostrando lo stato di ogni simbolo nei timeframe da M1 a MN1. I trader possono abilitare o disabilitare timeframe specifici per adattarsi alle loro strategie, garantendo un’analisi di mercato precisa ed efficiente. Lo strumento mostra segnali basati sulle seguenti strategie
Stochastic Multicurrency Scanner Dashboard MT5 è uno strumento potente progettato per monitorare più coppie di valute e timeframe utilizzando l’oscillatore Stocastico. Organizza i segnali in un formato a griglia, mostrando lo stato di ogni simbolo nei timeframe da M1 a MN1. I trader possono abilitare o disabilitare timeframe specifici per adattarsi alle loro strategie. La versione per MT4 è disponibile qui: Stochastic Oscillator Multicurrency Scanner MT4 Per la documentazione dettagliata, clicca

Description:
This indicator adds customizable buttons for symbols (currency pairs) and timeframes directly onto the chart. It allows traders to quickly switch between different symbols and timeframes by simply clicking on the respective buttons. The indicator also includes a toggle button to show or hide all the symbol and timeframe buttons, providing flexibility in chart customization. Key Features: Symbol Buttons: Automatically generates buttons for symbols from the Market Watch or allows man

Indicators Tracking for Trader Sale on MT5 The Indicators Tracking feature in MetaTrader 5 (MT5) is an essential tool for traders looking to optimize their sales and decision-making processes. This functionality allows traders to monitor key market metrics and analyze trends effectively, enhancing the accuracy of trade executions and strategy adjustments. Key Features: Real-Time Market Monitoring :
Track live data across various markets, including forex, stocks, and commodities, with indicators
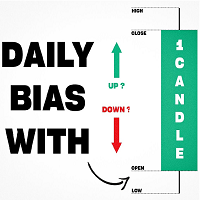
Inspired by TTrades video on daily bias, this indicator aims to develop a higher timeframe bias and collect data on its success rate. While a handful of concepts were introduced in said video, this indicator focuses on one specific method that utilizes previous highs and lows. The following description will outline how the indicator works using the daily timeframe as an example, but the weekly timeframe is also an included option that functions in the exact same manner.
On the daily timefr

The Market Heart indicator scans market entries after high volatility is noticed. Most big moves occur a short time after market volatility. Most big moves occur a short time after market volatility. The idea is to look for entries after the rectangles form and not necessarily as trade entry signals. . For example, you could use the Retracement Feeder indicator that generates arrow signals.
Market Heart MT4 Version
How to use: 1. Primary use The White Box is the first to be formed an

This Simple Smart Money Concepts indicator displays real-time market structure (internal & swing BOS / CHoCH), order blocks, premium & discount zones, equal highs & lows, and much more...allowing traders to automatically mark up their charts with widely used price action methodologies.
"Smart Money Concepts" (SMC) is used term amongst price action traders looking to more accurately navigate liquidity & find more optimal points of interest in the market. Trying to determine where institutional

EMA Cloud System is a Trading System Invented by Ripster where areas are shaded between two desired EMAs. The concept that the EMA cloud area serves as support or resistance for Intraday & Swing Trading. Can be utilized effectively on 10 Min for day trading and 1Hr/Daily for Swings. Ripster utilizes various combinations of 5-12 EMA clouds 34-50 EMA clouds among others. 8-9, 20-21 EMA clouds can be used as well. Adjust what works for you. Ideally 5-12 or 5-13 EMA cloud acts as sold fluid Trendli
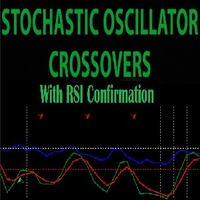
Combined RSI and Stochastic Indicator for MT5 Overview
The Combined RSI and Stochastic Indicator integrates the Relative Strength Index (RSI) and Stochastic Oscillator to provide trend confirmation and momentum-based trading signals. This MetaTrader 5 (MT5) indicator helps traders identify potential buy and sell opportunities by combining stochastic crossovers with RSI trend validation. RSI Trend Confirmation: Filters stochastic signals based on overall trend direction. Stochastic Crossovers:
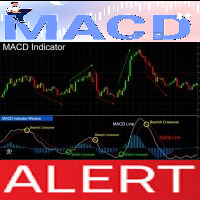
MACD Crossover with Alerts, Colored Histogram, and Zero Line Arrows Overview
The MACD Crossover Indicator is designed to help traders analyze trend direction and momentum shifts. This enhanced version of the classic MACD includes visual crossover markers, dynamic histogram coloring, and real-time alerts, offering a clear and structured approach to market analysis. Histogram color changes based on MACD position (above or below zero). Zero-line arrows for crossover points to highlight key trend

CandleSculptor: Master the Art of Candlestick Patterns and Take Your Trading to the Next Level! Unlock the power of advanced candlestick pattern recognition with CandleSculptor , the ultimate indicator for traders who want to gain a competitive edge in the markets. Whether you're a beginner or an experienced trader, CandleSculptor will help you spot key market reversal and continuation signals instantly, right on your chart. Key Features: Accurate Candlestick Pattern Detection: Automatically ide
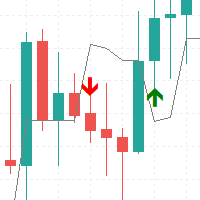
UT Bot Alert Indicator: Detailed Functionality Core Mechanism The UT Bot Alert indicator is a sophisticated trading tool designed to identify market trends and potential entry/exit points using a dynamic trailing stop method. Key Technical Components Volatility Calculation Uses Average True Range (ATR) to measure market volatility ATR period is customizable by the trader Provides adaptive tracking of price movements Trailing Stop Mechanism Creates a dynamic stop line that follows price action Ad

Multi-functional Pattern Indicator: Your Assistant for Successful Trading Looking for a tool to help you identify the most critical market patterns and improve your trading decisions? Our indicator is a versatile assistant for traders of any level. Automatic Detection and Plotting:
The indicator automatically analyzes the chart and highlights patterns, saving you from the hassle of searching for them manually.

The SuperTrend Indicator is a powerful trend-following tool that overlays directly on your price chart. Designed to help traders identify prevailing trends and potential reversals, this indicator uses Average True Range (ATR) calculations to dynamically adjust to market volatility. The intuitive color-coded display ensures clear visualization of trend changes. Key Features: Dynamic Trend Identification: Utilizes ATR-based calculations to provide responsive support/resistance levels in line with
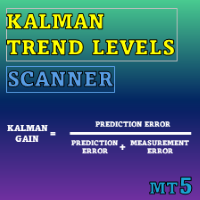
Special offer : ALL TOOLS , just $35 each! New tools will be $30 for the first week or the first 3 purchases ! Trading Tools Channel on MQL5 : Join my MQL5 channel to update the latest news from me Kalman Trend Levels è un indicatore avanzato di follow-up delle tendenze che utilizza la tecnologia all'avanguardia dei filtri di Kalman per fornire ai trader segnali analitici potenti. Progettato per precisione e adattabilità, questo strumento non solo identifica zone critiche di suppor

With this indicator, you can predict future price behavior for a certain number of bars ahead, giving you the ability to anticipate market dynamics. The indicator draws a forecast line , which models potential future price values based on sophisticated algorithms analyzing past data. This information can be leveraged not only for market entry and exit decisions but also for setting or adjusting stop-loss levels to better manage your positions. Application of the Forecast The data provided
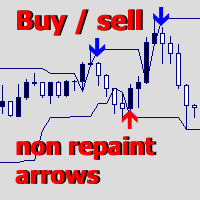
Upper and Lower Reversal - Sistema per la previsione anticipata dei momenti di inversione. Ti consente di trovare punti di svolta dei prezzi ai confini dei canali di movimento dei prezzi superiore e inferiore.
L'indicatore non si ricolorerà né cambierà mai la posizione delle frecce del segnale. Le frecce rosse sono un segnale di acquisto, le frecce blu sono un segnale di vendita.
Si adatta a qualsiasi intervallo temporale e strumento di trading L'indicatore non si ridisegna, funziona solo quan
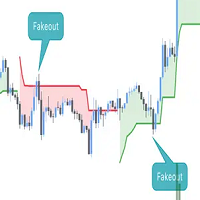
This script is an enhanced version of the classic Supertrend indicator. It incorporates an additional feature that ensures trend reversals are more reliable by introducing a Fakeout Index Limit and a Fakeout ATR Mult. This helps avoid false trend changes that could occur due to short-term price fluctuations or market noise. In smart money concept, when institute , "big-fish" want to buy, they usually sell first to take sellside liquidity and vice versal. This is why the indicator become importan

The Breakaway Fair Value Gap (FVG) is a typical FVG located at a point where the price is breaking new Highs or Lows.
USAGE Figure 1 In the figure 1, the price range is visualized by Donchian Channels.
In theory, the Breakaway FVGs should generally be a good indication of market participation, showing favor in the FVG's breaking direction. This is a combination of buyers or sellers pushing markets quickly while already at the highest high or lowest low in recent history. Figure 2 Whi

Hello good people this is The Rangers Fx We have released indicator for Sniper entries it gives most signals on the lows and on the highs then other signals it's for continuation This indicator it's not complicated you only follow signals that are shown on the screen which is blue arrow for buy and red arrow for sell Timeframe is M15 (15 minutes) This indicator works on currencies,indices,cryptocurrencies,stocks,volatility index,step index etc as long as it's meta trader 5 this indicator will wo
JESUS CROSS Indicator by Damion Description: The MA Crossover indicator is designed to alert traders when two moving averages cross on a 30-minute chart. It uses a Fast Moving Average (10-period) and a Slow Moving Average (21-period) to detect crossovers, which are commonly used as signals for potential trend changes. Key Features: Fast and Slow MA : The indicator employs a 10-period Fast Moving Average (FastMA) and a 21-period Slow Moving Average (SlowMA). Customizable Settings : Users can req
The pip Zapper is a light scalping indicator that generates alternate signals to help you close, gaining or losing trades quickly. This helps you capture trending and ranging scenarios.
When an arrow is generated enter trade after the candle closes. The indicator works with all instruments that are available on mt4 and mt5, including synthetic indices(Volatility, Range Break, Boom, Crash, etc.). Works in both ranging and trending phases. The default settings are already optimized.
MT4 Version

Are you looking for precision and reliability in your trading strategy? This non-repainting indicator is designed to elevate your trading game by providing entry signals aligned with the current trend direction, offering a powerful edge for traders of all styles. Key Features: Dual Signal Modes for Ultimate Flexibility :
1️⃣ Swing Trading Mode : Ideal for longer trades. Hold positions with confidence and target higher profit potential.
2️⃣ Scalping Mode : Designed for quick trades with minim

The ABC Indicator analyzes the market through waves, impulses, and trends, helping identify key reversal and trend-change points. It automatically detects waves A, B, and C, along with stop-loss and take-profit levels. A reliable tool to enhance the accuracy and efficiency of your trading. This product is also available for MetaTrader 4 => https://www.mql5.com/en/market/product/128179 Key Features of the Indicator:
1. Wave and Trend Identification: - Automatic detection of waves based on mov

Detailed Explanation of Using the Indicator for Bitcoin Trading 1. Understanding the Indicator The indicator uses moving averages and ATR (Average True Range) to detect trends and generate buy/sell signals. This is similar to Trade Sniper except designed for BTC 2. Setting Periods for Different Time Frames Configure the indicator with periods suitable for each time frame. Here’s a suggested table for periods and ATR-based stoploss/take profit settings: Time Frame PERIOD Stoploss Take Profit 1
The Advanced Price Level Alert is a powerful price monitoring tool designed for traders who need reliable and customizable price level alerts. This professional-grade indicator combines visual price level tracking with sophisticated alert mechanisms to keep you informed of significant price movements.
Key Features:
Customizable Alert Frequencies - Choose from 6 different alert frequencies (1-20 alerts per minute). Multi-Channel Notifications - Receive alerts through desktop, mobile push notifi

MA Crossover and Trend Alert Indicator Latest Updates: Fixed multiple buy and sell icons on each candle for cleaner signals. Optimized alert logic to prevent duplicate notifications. Enhanced compatibility – Now works with Heiken Ashi or regular candles. Updated print statement – Alerts now log directly to alerts.txt for future reference. Overview
The EMA Crossover and Trend Alert Indicator is a trend-following tool designed to assist traders in identifying moving average crossovers and short-

Trend Compass: All-in-One Trend Tracking Trend Compass is an advanced, all-inclusive trading indicator that provides a comprehensive solution for trend-following traders, designed to simplify market analysis and decision-making.
Trade How You Like: Extreme Customization Trend Compass is not just a rigid system, it is a highly adaptable framework designed to fit your specific trading style. With over 100 configurable settings, you have total control over how the market is analyzed, filtered

Master Support & Resistance Trading with Precision LevelGuard SmartSMA leverages the power of moving averages to help you trade confidently across markets. Designed to identify dynamic support and resistance levels, this EA delivers precise trade entries and exits, empowering traders to capitalize on market movements with ease. How It Works Core Strategy: Uses a central SMA (e.g., 50 or 200-period) as a dynamic support or resistance line.
Additional SMAs (optional) provide stronger confirmation

# ZigZag RSI with Dynamic Trendlines and Multi-Level Alerts
## Overview The ZigZag RSI indicator is an advanced technical analysis tool that combines the power of RSI (Relative Strength Index) with ZigZag pattern detection and dynamic trendline analysis. It helps traders identify potential trend reversals, support/resistance levels, and provides automated alerts for multiple trading scenarios.
## Key Features - Combined RSI and ZigZag pattern detection - Dynamic swing high/low identification

The ATR Trade System is a sophisticated trading tool designed for active traders seeking precise entry and exit points based on market volatility. This system combines adaptive trend identification with dynamic support and resistance levels, making it suitable for any trading instrument and timeframe. Key Features: Adaptive trend detection with color-coded signals Multiple volatility modes (Tight to FOMC) for different market conditions Higher timeframe trend analysis for better context Customiz

Advanced Trading Chaos The main purpose of the indicator is to help the trader detect the signals described by Bill Williams in his books to make a quick and correct trading decision.
1)Bullish/Bearish Reversal Bar(BDB) 2) Divergent Bar(DB) 3) Second Sage Signal — the third consecutive Awesome Oscillator bar 4) Working fractals (Fractals that worked above/below the red forehead 5) Three bar coloring modes
5.1) Coloring of bars according to the AO indicator (Including the squatting bar)
5.2
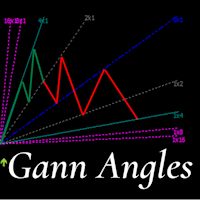
This indicator is, without a doubt, the best variation of the Gann Angles among others. It allows traders using Gann methods to automatically calculate the Gann angles for the traded instrument. The scale is automatically calculated when the indicator is attached to the chart. When switching timeframes, the indicator recalculates the scale for the current timeframe. Additionally, you can enter your own scales for the Gann angles. You can enter your own scales either for both vectors or for each

Visual EMA CrossPro - Your Ultimate Trading Companion! Are you ready to enhance your trading strategy with a powerful yet easy-to-use tool? Introducing the Visual EMA CrossPro, an intelligent indicator designed to help traders identify precise market entry and exit points based on EMA crossovers. For just $65, you get access to a reliable solution to simplify your trading journey. How It Works:
The Visual EMA CrossPro leverages two key EMAs (Exponential Moving Averages) to identify trends and p

The Visual EMA MultiFlex Indicator is designed to enhance your decision-making by combining the power of three Exponential Moving Averages (EMAs). Whether you're a beginner or an experienced trader, this tool helps identify precise market entries and exits. How It Works:
The Visual EMA MultiFlex Indicator leverages Short, Medium, and Long EMAs to analyze market momentum and confirm trend direction: Short EMA – Captures quick market shifts. Medium EMA – Smooths out short-term fluctuations. Long

The Visual EMA PriceSync Indicator is a cutting-edge trading tool designed to synchronize price action with EMA (Exponential Moving Average) trends. It helps you identify precise market entry and exit points, making it an essential tool for any trader. What does it do?
The indicator detects crossover signals between the price and EMA, which signify potential trend reversals or market corrections. These signals are displayed directly on your chart with clear and vibrant buy (lime green) and sell

The Visual EMA ReversalScout Indicator combines a powerful EMA crossover strategy with RSI-based divergence detection to generate reliable buy and sell signals. Its advanced logic ensures robust and actionable market insights while maintaining flexibility for optimization. Strategy Breakdown EMA Crossovers: Uses Fast EMA and Slow EMA to identify trend directions and reversals. Bullish signals arise when the Fast EMA crosses above the Slow EMA, indicating an uptrend. Bearish signals occur when t

Visual EMA SignalLine Pro – Your Ultimate Trading Companion Experience a smarter, more precise approach to trading with Visual EMA SignalLine Pro! This powerful indicator simplifies complex market analysis, allowing you to focus on what matters most: profitable trading decisions. Available now for just $65, this tool is your gateway to mastering trends, identifying entry and exit points, and managing trades like a pro. How Does It Work?
The Visual EMA SignalLine Pro combines the power of Expone

Adaptive Reversal Star is a new generation indicator with an advanced Adaptive algorithm , which additionally tracks potential reversal points and compares the values of the current market volatility when forming the main signals of the indicator.It provides accurate signals in real time without delays and redraws.Adaptive Reversal Star does not require any complex settings and additional calculations, just set it to the desired timeframe and select the parameter - Signal Filter. Why choose

VisualEMA TrendForce Indicator — Empower Your Trading with Precision Price: $65
Discover a Smarter Way to Trade with EMAs! The VisualEMA TrendForce Indicator is designed to elevate your trading with a reliable and visually intuitive trend-following system. Leveraging the power of Exponential Moving Averages (EMAs), this indicator provides actionable buy and sell signals based on dynamic market conditions, enabling traders to capture profitable trends with confidence. Core Features: Dynamic EMA

Visual CrossPulse Indicator - Revolutionize Your Trading! Take your trading to the next level with the Visual CrossPulse Indicator, a cutting-edge tool designed for precision and ease. This indicator combines powerful technical analysis with user-friendly features to identify profitable market opportunities effectively. What Makes Visual CrossPulse Special?
The Visual CrossPulse Indicator is a hybrid strategy tool that integrates the MACD (Moving Average Convergence Divergence) and an optional

The Pure Price Action ICT Tools indicator is designed for pure price action analysis, automatically identifying real-time market structures, liquidity levels, order & breaker blocks, and liquidity voids. Its unique feature lies in its exclusive reliance on price patterns, without being constrained by any user-defined inputs, ensuring a robust and objective analysis of market dynamics. Key Features Market Structures A Market Structure Shift, also known as a Change of Character (CHoCH), is a pivot
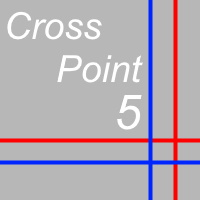
CrossPoint5 is an indicator that helps novice traders.
In addition to the standard "Crosshair" function (Ctrl + F), CrossPoint5 will show you how to set the StopLoss and TakeProfit levels correctly, taking into account the minimum allowable level, calculate the number of points between two points and convert this into the currency of the account, taking into account the expected lot of the transaction.
Sometimes, when opening a deal, a novice trader completely forgets about the spread.
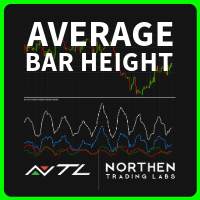
ABH - Candle Component Analysis - User Guide Overview and Features The ABH - Average Bar Height indicator is designed to help traders analyze market volatility and identify potential buy and sell signals by measuring the average size of each candlestick component over a specific period. The indicator calculates and displays four lines representing different candlestick metrics. By analyzing these values, traders can interpret market strength, volatility, and potential trend changes. Beyond
How to Add a Product Description (MetaTrader Market) To add the product description effectively in MetaTrader's Market, follow these steps: 1. Log into the MetaTrader Market: Go to your MQL5 account . Navigate to the "Seller's Dashboard" or "Products" section. Select your product, DuhokTrend . 2. Writing the Description: To enhance the product's rating, write a detailed and structured description : Template for Product Description:
DuhokTrend - Advanced Indicator for Trend Analysis Overview:

High Low Mid Daily Weekly Revolutionize Your Chart Analysis with Precision Levels! High Low Mid Daily Weekly is a powerful and intuitive indicator designed for traders seeking to elevate their technical analysis. This indispensable tool automatically plots the key price levels of the current day and week directly on your chart, ensuring you never miss crucial support and resistance zones. Key Features: Daily and Weekly Levels : Instantly displays today’s and this week’s High , Low , Mid levels

This indicator is for scalpers who want to make profit from recovery and retracements. As a scalping indicator, you won't win big but small and steady profits. How to use this? Open a stop buy order if the price close below the "Recovery" at the recovery price with a TP at the "Expected recovery". It's best to use with an EA to open orders automatically closing at the current "Expected recovery" instead of setting a TP. Doing so will ensure orders will close no matter where the price go without

Soutien et résistance Omega Un indicateur unique pour les stratégies d'achat bas et de vente élevée Entrées de type inversion, à mesure que le prix monte jusqu'à la ligne complète, attendez-vous à ce que le prix tourne/balance/inverse Peut échanger des graphiques de 1 à 5 minutes avec 4 heures pour les configurations interjournalières ou m15 et plus avec quotidiennement, 1 heure avec hebdomadaire pour les configurations à long terme Prédicteur de prix futur de haute précision pour le haut ou le
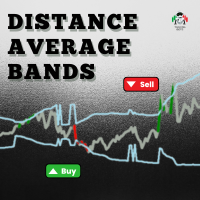
A very assertive and easy-to-view indicator, which can be used in any financial asset.
This indicator aims to show moments when the average price deviation in relation to the average deviation exceeds the configured standard deviation.
Step 1: We measure the distance between the price and the average configured in the "MAPrice" parameter;
Step 2: We calculate the average "MADistancePeriod" of the distances measured in Step 1.
Step 3: We calculate the standard deviation "Deviation" from th

Overview In the fast-paced world of forex and financial markets, quick reactions and precise decision-making are crucial. However, the standard MetaTrader 5 terminal only supports a minimum of 1-minute charts, limiting traders' sensitivity to market fluctuations. To address this issue, we introduce the Second-Level Chart Candlestick Indicator , allowing you to effortlessly view and analyze market dynamics from 1 second to 30 seconds on a sub-chart. Key Features Support for Multiple Second-Level
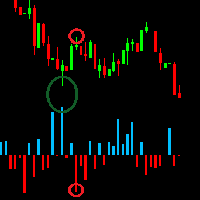
The Tick Volume Balance indicator is created based on the tick volumes of the instrument on the selected timeframe, taking into account the trading balance of supply and demand prices.
The indicator considers the nature of candle formation used in the Price Action strategy. With equal volume, a regular candle and a candle with a pattern will have a larger size and will be colored according to its pattern. I would like to note that large volume candles colored in bullish and bearish colors at t
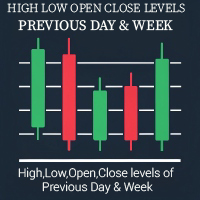
Revolutionize Your Chart Analysis with "Previous Daily Weekly HLOC Levels"! The Previous Daily Weekly HLOC Levels indicator is a must-have tool for traders who want to sharpen their technical analysis. This intuitive and powerful indicator automatically plots the High, Low, Open, and Close levels of the previous day and week on your chart, giving you a clear view of critical support and resistance zones. Key Features: Daily and Weekly Levels: Effortlessly displays the High, Low, Open, and Clos
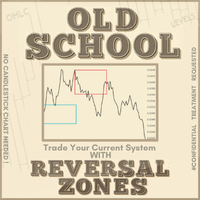
I'll keep it Short and to the point. Let Your Backtest Results Speak for Themselves. After much deliberation, we’ve decided to release the foundational logic behind our process for public use.
This isn’t about changing the way you trade—because we know that’s unique to you. The best ways to enter a position? Those have always been confidential ! What we can share is the first of three essential steps we use before entering any trade. This tool is designed to keep you on the right side of the m

Introducing to your attention the unique trading system/indicator "Scaled Vidya Trends", designed for dynamic scalp trading on trend volatility pairs hour + timeframes.
Main features of Scaled Vidya Trends:
-Multi-level market analysis: it works on H1, H2, H3 timeframes; -Uses the most popular currency pairs: EURUSD, GBPUSD, USDCAD. Brokers usually set one of the lowest spreads for these pairs; -Applies a scalping method based on local targets for signals; -Signals appears at the new open of

The Easy Trend Trading Indicator delivers quick and accurate BUY/SELL signals, ensuring that traders can make timely decisions. It works flawlessly across various timeframes and supports all symbols, making it a versatile tool for any market. Whether you're trading short-term or long-term, this indicator adapts to your needs with ease. Quick Setup: Simply "Enable" the indicator via input settings With a low memory footprint, the indicator is designed for efficiency, ensuring smooth performance e
Overview "L3 Counter Peacock Spread" is a comprehensive technical analysis indicator for MetaTrader 5, developed by Blackmill Solutions UG. It employs a sophisticated combination of multiple moving averages, K-lines, and weighted analysis to provide traders with a robust set of visual tools for market analysis. Key Features Multiple Moving Average Analysis Combines short and long-term moving averages (MA1, MA3, MA10, MA30) Utilizes both Simple Moving Averages (SMA) and Weighted Moving Averages

Volume Weighted Average Price (VWAP) is a measure that combines price and volume data to reflect the average price at which a security has traded throughout a specific period. This indicator calculates the VWAP based on your selected timeframe and plots it on the main chart. It automatically identifies new sessions for the chosen timeframe and resets the calculation accordingly, ensuring that the displayed VWAP remains current. Use VWAP MTF to observe areas where trading activity is concentrate
Introducing to your attention unique trading advisor, Squeeze roc xau points, exclusively designed for trading on the XAU/USD pair. We analyzed predominantly all objectively important timeframes and identified unique characteristics of gold movements relative to the dollar to create this product. These insights can be extremely useful in predicting market reversal points on timeframes from M30 to H8 for the XAU/USD pair. You can choose your favorite timeframe to receive signals or use multiple
This indicator is designed for scalping Gold, BTC, US30, GBPUSD, and can also be used on any financial instrument. It does not repaint, erase past signals, and it is not lagging. The indicator is a combination of two well-known indicators: Bollinger Bands and TD Sequence. It has a relatively high win rate; however, it is not a complete system and should be used in conjunction with other indicators to filter noise, increase the win rate, and is intended for experienced scalpers. Always set reaso

Zone to Zone Indicator for MT5 Unleash the full potential of your trading strategy with the "Zone to Zone" indicator for MetaTrader 5. This advanced tool provides unparalleled precision and versatility, making it an essential addition to any trader's toolkit. Key Features: MT5 Compatibility : Seamlessly integrates with the MetaTrader 5 platform for a smooth and efficient trading experience. Accurate Historical Resistance/Support Zones : Effortlessly draw and identify key resistance and support

Take the stress out of trading with the Buy Sell Chill Indicator —your ultimate companion for effortless trend identification. This easy-to-use tool gives you a clear visual arrow to show the direction the market is about to take, making trading decisions as simple and "chill" as possible. Why Choose the Buy Sell Chill Indicator? Relaxed and Intuitive : Designed to make trading less stressful and more enjoyable by giving you straightforward signals with no clutter. Customizable Features : ATR Pe

EMA Scalper Indicator is an indicator of EMA lines and reversal EMA lines. Each pair of EMA channels area that can be used to make reversal entry. After the EMA lines are widening because of major trend, the area can be used to find profitable entry and exit, especially after EMA reversal. Do the cut loss whenever candle closed outside the area.
The A, B, C, D, and E area are colored differently. Solid lines: Normal EMA lines. Dashed lines: Reversal EMA lines.

Volume Delta Candles: A Comprehensive Tool for In-Depth Trading Analysis Unlock a seamless way to interpret trading experience within each candle. With Volume Delta Candles, there's no need for additional volume indicators—everything you need is built in. This advanced tool utilizes lower timeframes or live market data to present the percentage of buying versus selling volume within each candle as an intuitive color-coded bar. Before diving in, ensure you’re familiar with Volume and Volume Delta

Four MA on OBV Four MA on OBV è un indicatore professionale per MetaTrader 5 che combina l’On-Balance Volume (OBV) con quattro medie mobili per fornire una conferma del trend basata sul volume e un’analisi oggettiva della direzione di mercato. Progettato per trader che si affidano a struttura, validazione tramite volume e decisioni basate su regole, questo indicatore offre una visione chiara e stabile di accumulazione, distribuzione e forza del trend su tutti i timeframe. Il tuo feedback sostien
Scopri come acquistare un robot di trading dal MetaTrader Market, il negozio di applicazioni per la piattaforma MetaTrader.
Il sistema di pagamento di MQL5.community supporta le transazioni tramite PayPal, carte bancarie e gli altri sistemi di pagamento più diffusi. Per essere pienamente soddisfatto, ti consigliamo vivamente di testare il robot di trading prima di acquistarlo.
Ti stai perdendo delle opportunità di trading:
- App di trading gratuite
- Oltre 8.000 segnali per il copy trading
- Notizie economiche per esplorare i mercati finanziari
Registrazione
Accedi
Se non hai un account, registrati
Consenti l'uso dei cookie per accedere al sito MQL5.com.
Abilita le impostazioni necessarie nel browser, altrimenti non sarà possibile accedere.